Last updated on 04th Jul 2020| 3545
A data analyst is one of the most lucrative career paths in today’s world, and it’s getting more and more interesting every day. There are so many data analytics jobs out there, and if you’re thinking about applying for a job as a data analyst, here are a few questions you need to ask yourself during your data analyst interview.
1. What is Data Analysis?
Ans:
In order to extract insights from data, data analysis is a systematic process that includes handling data through operations like intake, cleaning, transformation, and assessment. To begin, information is gathered from various sources. Because the data is raw, it must be cleaned and processed in order to fill in missing values and remove any entities that are no longer relevant.
2. What is Data Profiling?
Ans:
The process of thoroughly examining every entity found in data is known as data profiling. Providing extremely accurate information based on data and its characteristics, including datatype, frequency of occurrence, and more, is the aim here.
3. What is Data Validation?
Ans:
Data validation is the process that involves the determining the accuracy of data and the quality of source as well. There are many processes in data validation but The two most important are data screening and data verification.
- Data screening: Making use of variety of models to ensure that data is accurate and no redundancies are present.
- Data verification:. If there is redundancy, it is evaluated based on the multiple steps and then a call is taken to ensure presence of the data item.
4. Distinguish differences between Data Analysis and Data Mining?
Ans:
Data analysis is the process of cleaning, organizing, and utilizing data to generate meaningful insights. Data mining is a technique for discovering hidden patterns in data.
Data analysis yields results that are far more understandable to a wide range of audiences than data mining.
5. What are top tools used to perform Data Analysis?
Ans:
- Google Search Operators
- RapidMiner
- Tableau
- KNIME
- OpenRefine
6. What is outlier?
Ans:
An outlier is the value in a dataset that is considered to be away from mean of the characteristic feature of a dataset. There are two types of the outliers: univariate and multivariate.
7. How to know if data model is performing well or not?
Ans:
- A well-designed model should be predictably accurate. This relates to the ability to predict future insights when they are required.
- A rounded model easily adapts to any changes made to the data or pipeline if necessary.
- The model should have ability to cope in case there is immediate requirement to large-scale data.
- The model’s operation should be simple and easily understood by clients in order to help them achieve the desired results.
8. What are scenarios cause a model to be retrained?
Ans:
Data is a constantly evolving entity. A company’s growth may result in unforeseen opportunities that necessitate updating the data. Additionally, evaluating the model to determine its standing can assist analysts in determining whether or not a model needs to be retrained.
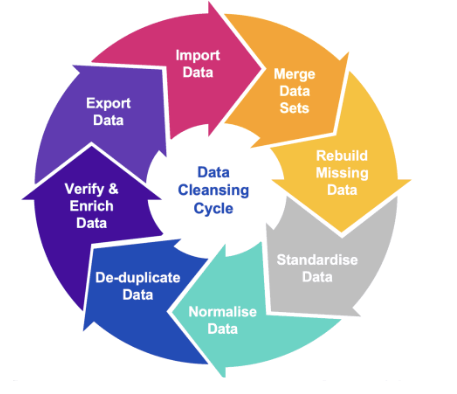
9. Explain Data Cleaning.
Ans:
Data Cleaning, also known as Data Wrangling, is a structured method of locating and safely removing erroneous content in data to ensure that data is of the highest quality. Here are some methods for cleaning data:
- Removing the data block entirely
- Finding ways to fill a black data in, without causing redundancies
- Replacing data with mean or median values
- Making use of the placeholders for empty spaces.
10. What is use of Pivot table?
Ans:
One of the most important aspects of Excel is pivot tables. They enable easy viewing and summarization of a large dataset by the user. The majority of actions with pivot tables involve drag-and-drop functionality, which facilitates rapid report creation.
11. How can deal with problems arise when data flows in from variety of sources?
Ans:
There are the many ways to go about dealing with the multi-source problems. However, these are done primarily to solve problems of:
- Identifying a presence of similar/same records and merging them into single record
- Re-structuring a schema to ensure there is a good schema integration.
12. What steps involved when working on data analysis project?
Ans:
Many steps are the involved when working end-to-end on data analysis project. Some of important steps are as mentioned below:
- Problem statement
- Data cleaning/preprocessing
- Data exploration
- Modeling
- Data validation
- Implementation
- Verification
13. Explain KNN imputation method?
Ans:
Using the KNN approach, many closest neighbours and a distance metric must be chosen simultaneously. It has the ability to forecast a dataset’s continuous and discrete properties. In order to aid in the subsequent analysis, a distance function is utilised in this case to determine how comparable two or more qualities are.
14. What are some of popular tools used in Big Data?
Ans:
- Hadoop
- Spark
- Scala
- Hive
- Flume
- Mahout.
15. What are top Apache frameworks used in distributed computing environment?
Ans:
In situations when dealing with large datasets in a distributed working environment is necessary, MapReduce and Hadoop are regarded as superior Apache frameworks.
16. What is time series analysis?
Ans:
Time series analysis, or TSA, is widely used statistical technique when working with the trend analysis and time-series data in particular. The time-series data involves presence of the data at particular intervals of a time or set periods.
17. Where is time series analysis used?
Ans:
Since time series analysis (TSA) has wide scope of usage, it can be used in the multiple domains. Here are some of places where TSA plays an important role:
- Statistics
- Signal processing
- Econometrics
- Weather forecasting
- Earthquake prediction
- Astronomy
- Applied science.
18. What is collaborative filtering?
Ans:
Collaborative filtering is the algorithm used to create recommendation systems based mainly on behavioral data of a customer or user.
For example when browsing e-commerce sites, section called ‘Recommended for you’ is present. This is done using browsing history, analyzing the previous purchases, and collaborative filtering.
19. Name some of statistical methodologies used by data analysts?
Ans:
- Markov process
- Cluster analysis
- Imputation techniques
- Bayesian methodologies
- Rank statistics
20. What is K-means algorithm?
Ans:
The K-means algorithm divides data into distinct groups according to how near one data point is to the other. In the k-means method, “the k” denotes the number of clusters. It makes an effort to keep each cluster reasonably spaced apart from one another. However, since it works in the unsupervised nature, the clusters will not have the any sort of labels to work with.
21. What are data validation methodologies used in data analysis?
Ans:
- Field-level validation: Validation is done across each fields to ensure that there are no errors in a data entered by the user.
- Form-level validation: Here, validation is done when user completes working with form but before information is saved.
- Data saving validation:This type of validation occurs during the saving of a file or database record.
- Search criteria validation: This kind of validation checks if the results a user receives while searching for something are genuine.
22. What is Hierarchical Clustering?
Ans:
An method called hierarchical clustering, often known as hierarchical cluster analysis, organises related items into what are known as clusters. Establishing a collection of distinct yet related clusters is the aim; each cluster should be distinct from the others.
23. Which types of hypothesis testing used today?
Ans:
There are the many types of hypothesis testing. Some of them are as follows:
- Analysis of variance (ANOVA): Here, analysis is conducted between mean values of multiple groups.
- T-test: When there is a limited sample size and no known standard deviation, this kind of testing is used.
- Chi-square Test: The purpose of this type of hypothesis testing is to determine the degree of correlation between categorical variables within a sample.
24. What are ideal situations in which t-test or z-test can be used?
Ans:
In most circumstances, a sample size of more than thirty is taken into consideration for the z-test, while in less than thirty cases, the t-test is employed as standard procedure.
25. What are properties of clustering algorithms?
Ans:
- Flat or hierarchical
- Iterative
- Disjunctive.
26. What is difference between concepts of recall and true positive rate?
Ans:
Recall and true positive rate, both are totally identical. Here’s formula for it:
Recall = (True positive)/(True positive + False negative)
27. Why is Naive Bayes called ‘naive’?
Ans:
Naive Bayes is referred to be naïve since it makes the broad assumption that all facts supplied are indisputably significant and independent of one another. This is false and will not stand up in a real-world scenario.
28. What are problems working Data Analyst might encounter?
Ans:
- Multiple entries of the same entity, along with spelling and data errors, will reduce the accuracy of a developing model.
- If the source data being ingested is not from a trusted source, the data may require extensive cleaning and preprocessing before analysis can begin.
- The same goes for when extracting a data from the multiple sources and merging them for use.
- The analysis will take backstep if the data obtained is incomplete or inaccurate.
29. Why is KNN preferred when determining the missing numbers in data?
Ans:
K-Nearest Neighbour (KNN) is recommended because it can readily estimate the value to be found based on values closest to it.
30. How are outliers detected?
Ans:
There are several strategies for finding outliers, however the two most widely used methods are as follows:
- Standard deviation method: In this case, an outlier is defined as a value that is less than or greater than three standard deviations from the mean value.
- Box plot method: In this case, a result is deemed an outlier if it is less than or greater than 1.5 times the interquartile range (IQR).
31. What is the distinction between Principal Component Analysis (PCA) and Factor Analysis (FA)?
Ans:
The primary distinction between PCA and FA is that factor analysis is used to describe and deal with variation between variables, whereas PCA seeks to explain covariance between existing components or variables.
32. How can handle suspicious data in dataset while performing analysis?
Ans:
- Creation of validation report with details about a data in the discussion
- Escalating a same to an experienced data analyst to look at it and take a call
- Replacing invalid data with corresponding valid and up-to-date data
- Using the many strategies together to find missing values and using an approximation if needed
33. How use regularization in regression model?
Ans:
Regularization (L1/L2) adds the penalty term to the cost function, discouraging overly a complex models that might overfit the training data. It’s necessary when dealing with the collinearity, noisy data, or when trying to a prevent overfitting.
34. Difference between standardized and unstandardized coefficients?
Ans:
- In the case of the standardized coefficients, they are interpreted based on a standard deviation values.
- The unstandardized coefficient is a measured based on actual value present in a dataset.
35. How evaluate ROI of machine learning model deployed in production?
Ans:
Assessing the costs of creating, implementing, and sustaining the model in comparison to its advantages such as higher income, lower expenses, or higher customer satisfaction is the process of evaluating return on investment.
36. How use data analysis to optimize supply chain operations?
Ans:
Data analysis may be used to estimate demand, detect bottlenecks, expedite deliveries, enhance supplier relationships, and optimise inventory management.
37. How design a metric to quantify performance of customer service department?
Ans:
A few aspects to take into account while designing the measure include case backlog, escalations, customer satisfaction ratings, and resolution times. The measure need to be easily interpreted, applicable, and in line with the objectives of the organisation.

38. How is beneficial to make use of version control?
Ans:
- Establishes simple way to compare files, identify differences, and merge if any changes are made.
- Creates an easy way to track life cycle of an application build, including the every stage in it, like development, production, testing, etc.
- Brings about a good way to establish the collaborative work culture
- Ensures that every version and variant of a code is kept safe and secure.
39. What are future trends in data analysis?
Ans:
Make sure to state valid facts and respective validation from the sources to add positivity to candidature. Also, try to explain how an artificial intelligence is making a huge impact on the data analysis and its potential in a same.
40. What are disadvantages of data analytics?
Ans:
- Data analytics can cause breach in the customer privacy and information like transactions, purchases, and subscriptions.
- Some of tools are complex and require prior training.
- It takes the lot of skills and expertise to select a right analytics tool every time.
41. Explain a recommendation system ?
Ans:
A recommendation system can drive a revenue by personalizing the user experiences, increasing engagement, promoting the upsell and cross-sell opportunities, and improving a customer retention.
42. How can optimize model in real-time streaming data application?
Ans:
Optimization might include adopting lightweight models (e.g., linear models), model quantization or trimming, optimising the data pipeline, and using distributed computer resources.
43. Explain semi-supervised learning in scenario with limited labeled data?
Ans:
Semi-supervised learning can be employed by a leveraging the small amount of labeled data to guide learning process with the larger volume of unlabeled data. Techniques are self-training, multi-view learning, and co-training can be used to improve a model performance.
44. What are responsibilities of a Data Analyst?
Ans:
- Collects and analyzes a data using statistical techniques and reports results accordingly.
- Interpret and analyze trends or a patterns in complex data sets.
- Establishing the business needs together with business teams or management teams.
- Find opportunities for improvement in an existing processes or areas.
- A Data set commissioning and decommission.
45. Describe Bayesian approach over frequentist statistics?
Ans:
A Bayesian strategy may be used when prior information must be included into analysis, or when working with tiny datasets when the flexibility of Bayesian approaches might yield more robust results.
46. How solving problem involving graph data?
Ans:
Graph data may be analysed using approaches such as graph theory, network analysis, and graph databases. To discover the influential nodes, clusters, and linkages, algorithms such as PageRank, community identification, and shortest path can be used.
47. Describe use of ensemble learning techniques to improve model accuracy?
Ans:
Ensemble learning techniques are bagging, boosting, and stacking, can be used to combine the multiple weak models to create stronger model. This often results in the better generalization and robustness against overfitting.
48. Define concept drift in real-time data streaming application?
Ans:
Concept drift can be handled by the continuously monitoring model performance, setting up the alerting mechanisms for performance degradation, and implementing strategies for an incremental learning and model updating.
49. What are prerequisites to become a Data Analyst?
Ans:
- Being well-versed in the programming languages like XML, JavaScript, and ETL frameworks
- Proficient in databases are SQL, MongoDB, and more
- Ability to be effectively collect and analyze data
- Knowledge of a database designing and data mining
- Having ability/experience of working with large datasets
50. Difference between data mining and data profiling?
Ans:
| Aspect | Data Mining | Data Profiling | |
| Goal |
Discovers patterns and insights in large datasets for decision-making and prediction. |
Assesses data quality, completeness, and structure to ensure reliability and accuracy. | |
| Techniques Used | Uses clustering, classification, regression, and association rule mining. | Employs statistical analysis, pattern recognition, and data quality assessment. | |
| Application Areas | Applied in marketing, finance, healthcare, and fraud detection for predictions. | Used in data preparation, cleansing, and integration to ensure data meets quality standards. |
51. Explain Normal Distribution?
Ans:
The Normal Distribution is important in statistics and serves as the foundation for machine learning. It basically specifies and quantifies how the means and standard deviations of variables differ, i.e. how values are distributed.
52. What are the ways to detect outliers?
Ans:
- Box Plot Method: This approach considers a result to be an outlier if it exceeds or falls below 1.5*IQR (interquartile range), that is, if it is above the top quartile (Q3) or below the bottom quartile (Q1).
- Standard Deviation Method: According to this method, outlier is defined as a value that is greater or lower than mean ± (3*standard deviation).
53. How does data visualization help?
Ans:
Data visualization has grown rapidly in the popularity due to its ease of viewing and understanding complex data in form of charts and graphs. In addition to providing data in the format that is easier to understand, it highlights a trends and outliers. The best visualizations illuminate the meaningful information while removing noise from data.
54. Mention some of python libraries used in data analysis?
Ans:
- NumPy
- Bokeh
- Matplotlib
- Pandas
- SciPy
- SciKit, etc.
55. Explain a hash table?
Ans:
Hash tables are usually defined as a data structures that store data in associative manner. In this, data is generally stored in the array format, which allows each data value to have unique index value. Using the hash technique, hash table generates an index into array of slots from which can retrieve the desired value.
56. What is collisions in hash table?
Ans:
Hash table collisions are typically caused when a two keys have the same index. Collisions, thus, result in the problem because two elements cannot share the same slot in an array. The following methods can be used to avoid a such hash collisions:
- Separate chaining technique: This method involves the storing numerous items hashing to common slot using the data structure.
- Open addressing technique: This technique locates unfilled slots and stores item in a first unfilled slot it finds.
57. What logistic regression?
Ans:
Logistic Regression is basically mathematical model that can be used to study datasets with the one or more independent variables that determine the particular outcome. By studying relationship between the multiple independent variables, model predicts a dependent data variable.
58. What are advantages of using version control?
Ans:
- Analysis of deletions, editing, and creation of datasets since original copy can be done with version control.
- Software development becomes a clearer with this method.
- It helps distinguish different versions of document from one another. Thus, latest version can be easily identified.
- There’s complete history of project files maintained by it which comes inthe handy if ever there’s a failure of central server.
59. Explain N-gram?
Ans:
N-gram, known as probabilistic language model, is defined as connected sequence of n items in given text or speech. It is basically composed of the adjacent words or letters of length n that were present in source text. In simple words, it is the way to predict the next item in the sequence, as in (n-1).
60. Difference between data lake and data warehouse ?
Ans:
- Data Warehouse: This is considered an ideal place to store all data gather from many sources. A data warehouse is the centralized repository of data where data from operational systems and the other sources are stored. It is standard tool for integrating data across team- or department-silos in mid-and large-sized companies. It collects and manages the data from varied sources to provide the meaningful business insights.
- Data Lake: Data lakes are basically large storage device that stores a raw data in original format until they are needed. with large amount of data, analytical performance and native integration are be improved. It exploits the data warehouses’ biggest weakness: their incapacity to be flexible. In this, neither planning nor knowledge of a data analysis is required; analysis is assumed to happen later, on-demand.
61. What is VLOOKUP?
Ans:
VLOOKUP stands for ‘a Vertical Lookup’. It is the function that makes Excel search for certain value in a column (or the ‘table array’), in order to return a value from the different column in a same row.
62. What are Affinity diagrams?
Ans:
An affinity diagram is a tool for analysis used to classify or arrange data into smaller groups based on connections. These facts or notions are used in the examination of challenging situations and are typically the outcome of discussions or brainstorming sessions.
63. What qualities make for strong data model?
Ans:
Provides predictable performance, allowing estimations of results to be made as accurately or nearly so as possible.
- It needs to be a responsive and flexible enough to adjust as necessary when company demands change.
- The model ought should scale in line with the changes in the data.
64. Distinguish difference between variance and covariance?
Ans:
- Variance: In statistics, variance is defined as deviation of a data set from its mean value or average value. When variances are greater, the numbers in the data set are farther from mean. When the variances are smaller, the numbers are nearer mean.
- Covariance: Covariance is the another common concept in statistics, like variance. In statistics, covariance is the measure of how two random variables change when compared with the each other.
65. What are anticipated developments in data analysis?
Ans:
Ensure that you give true information with the proper source identification to back up your eligibility. Also, make an attempt to demonstrate how artificial intelligence is having a huge impact on data analysis and what the future holds.
66. What is difference between COUNT, COUNTA, COUNTBLANK, and COUNTIF in Excel?
Ans:
- COUNT function returns a count of numeric cells in a range.
- COUNTA function counts a non-blank cells in a range.
- COUNTBLANK function gives count of blank cells in a range.
- COUNTIF function returns a count of values by checking a given condition.
67. How does approach exploratory data analysis (EDA)?
Ans:
Exploratory Data Analysis involves summarizing main characteristics of a dataset, often using the visual methods. Start by examining summary statistics, creating visualizations like a histograms and scatter plots, and looking for a patterns and outliers. EDA helps to understand distribution of data, identify trends, and generate hypotheses for a further analysis.
68. Explain the concept of normalization ?
Ans:
Normalization is the process of scaling and transforming a data to bring it within a standard range. It is important in the data analysis to ensure that variables with different units or scales are comparable. Normalization prevents a one variable from dominating others and facilitates a better interpretation of coefficients in the models like linear regression.
69. Explain difference between supervised and unsupervised learning?
Ans:
- Supervised learning entails training a model on a labelled dataset, where the algorithm learns the link between the input characteristics and the output.
- Unsupervised learning, on other hand, deals with unlabeled data and aims to the identify patterns, relationships, or groupings within the data without the explicit guidance.
70. How do assess effectiveness of machine learning model?
Ans:
Model assessment involves using the metrics such as accuracy, precision, recall, F1 score, and ROC-AUC, depending on nature of the problem. Additionally, cross-validation can be used to assess the model’s performance on different subsets of data. Understanding business context is crucial to determine most relevant metrics for specific problem.
71. Explain overfitting ?
Ans:
Overfitting happens when the model learns the training data too well, capturing noise and patterns that do not generalise to new data. Techniques like as cross-validation, regularisation, and utilising extra data can be used to mitigate overfitting. Regularisation approaches, such as L1 or L2 regularisation, penalise complicated models by prohibiting them from fitting noise in the data.
72. What distinguishes underfitting and overfitting in particular?
Ans:
- Overfitting: Overfitting is the statistical phenomenon that happens when model is overly complex and explains the any random mistake or noise. Given that it overreacts to small variations in a training data, an overfit model performs poorly in terms of a prediction.
- Underfitting: Whenthe statistical model is under fitted, it is unable to represent underlying data trend. Additionally, this kind of model performs the poorly in terms of prediction.
73. Explain concept of A/B testing ?
Ans:
A/B testing compares two variants of a variable to see which one performs better. In data analysis, it is often applied in controlled experiments to assess the changes in the product or process. It involves randomly assigning subjects to the two groups (A and B), exposing them to a different conditions, and then analyzing results to determine impact of changes.
74. How feature selection in a machine learning project?
Ans:
Feature selection involves the choosing a subset of relevant features for a building model. start by analyzing the correlation between the features, using techniques like a recursive feature elimination or tree-based methods. Additionally, might consider domain knowledge and leverage techniques like a principal component analysis (PCA) for the dimensionality reduction.
75. How handle situation where analysis results in unexpected findings?
Ans:
First carefully validate a data and methodology to ensure accuracy. If findings persist, seek input from colleagues, subject matter experts, or stakeholders to gain additional perspectives. It’s essential to be a transparent about unexpected findings and explore the potential explanations before drawing conclusions.

Get JOB Oriented Fuse ESB Training for Beginners By MNC Experts
- Instructor-led Sessions
- Real-life Case Studies
- Assignments
76. What is difference between left join and inner join in SQL?
Ans:
An inner join in SQL returns only rows with matching values in both tables being joined. In contrast, a left join retrieves all rows from the left table as well as the matching rows from the right table. If no match is found in a right table, NULL values are returned for columns in the right table.
77. What is importance of data governance in data analysis process?
Ans:
Data governance ensures the quality, integrity, and security of data throughout lifecycle. It involves the establishing policies, procedures, and standards for data management. In data analysis, effective data governance ensures that data used is accurate, consistent, and complies with the relevant regulations.
78. Explain decision tree ?
Ans:
A decision tree is the tree-like model where each internal node represents decision based on the value of particular feature, and each leaf node represents the outcome. It is used for the classification and regression tasks. The model recursively splits a data based on features to make decisions, making it interpretable and easy to understand.
79. How communicate findings and insights to non-technical stakeholders?
Ans:
Tailor my communication to audience, using clear and simple language, visualizations, and real-world examples. create visual reports, executive summaries, or presentations that highlight a key findings, insights, and actionable recommendations without delving into the technical details.
80. Explain difference between bar chart and histogram?
Ans:
Both bar charts and histograms display distribution of data, but they differ in use and representation. A bar chart is used to display the categorical data with distinct categories, and bars do not touch. Histograms, on other hand, represent the distribution of a continuous data by dividing it into the intervals (bins) and displaying the frequency or probability of the observations within each bin.
81. How handle imbalanced datasets in classification problems?
Ans:
Imbalanced datasets, where one class significantly outnumbers the another, can lead to biased models. Techniques to handle this include oversampling minority class, undersampling majority class, or using algorithms designed for the imbalanced data, such as SMOTE (Synthetic Minority Over-sampling Technique).
82. Explain Gaussian distribution?
Ans:
A Gaussian distribution, or normal distribution, is the bell-shaped curve that is symmetric around mean. In data analysis, many natural phenomena follow a normal distribution. Knowing this helps in making a statistical inferences and predictions using the methods like a hypothesis testing and confidence intervals.
83. How assess statistical significance of findings in data analysis project?
Ans:
Statistical significance is often assessed through the hypothesis testing. set up null and alternative hypotheses, choose the appropriate significance level (e.g., 0.05), and perform tests such as t-tests or chi-square tests. If p-value is below the chosen significance level, would reject the null hypothesis, indicating a statistical significance.
84. Explain rolling average and how used in time series analysis?
Ans:
A rolling average, or moving average, is calculated by taking average of a subset of data points over the specified window that “rolls” through dataset. In time series analysis, it smoothens the fluctuations and highlights trends, making it useful for the identifying patterns over time.
85. How ensure privacy and security of sensitive data in analysis?
Ans:
Prioritize the data privacy by following the best practices such as anonymization, encryption, and access controls. Also ensure compliance with the relevant regulations (e.g., GDPR) and work closely with IT and legal teams to be establish and maintain the secure data environment.
86. Explain cross-validation in machine learning?
Ans:
Cross-validation is a technique for assessing model performance that divides data into several subsets (folds). The model is trained on some folds and tested on others, and the procedure is done several times to guarantee that all data points are used for both training and testing. Cross-validation provides a more robust assessment of a model’s performance while lowering the danger of overfitting to a given dataset.
87. How deal with dataset that has high dimensionality?
Ans:
High dimensionality can lead to the increased computational complexity and overfitting. Techniques to handle the high-dimensional data include feature selection, dimensionality reduction (e.g., PCA), and using the algorithms designed for a high-dimensional data, such as LASSO regression. These methods help streamline the analysis by focusing on most relevant features.
88. What varieties of sampling strategies do data analysts use?
Ans:
Sampling techniques come in two flavors: probability and non-probability. Using probability sampling, which selects at random, you can draw robust statistical conclusions about the entire group. It reduces the possibility of bias in selection. Simple random samples, systematic samples, and cluster samples are a types of probability sampling. Non-probability sampling makes data collection easier by selecting participants non-randomly based on convenience or other factors. Quota sampling, convenience sampling, and deliberate sampling are a instances of non-probability sampling.
89. As a data analyst, what are your advantages and disadvantages?
Ans:
Strong analytical abilities, meticulousness, competence in data manipulation and visualization, and the capacity to extract meaning from intricate datasets are among the strengths of a data analyst. Conversely, deficiencies can be restricted subject expertise, inexperience with certain data analysis instruments or methods, or difficulties in effectively conveying technical results to stakeholders who are not technical.
90. What are the type 1 and type 2 errors in statistics?
Ans:
Hypothesis testing is used to make decisions about whether data supports or refutes research predictions with null and alternative hypotheses. A Type I mistake is a false positive conclusion, which indicates that the null hypothesis is rejected even when it is correct. A Type II mistake is a false negative conclusion, which indicates that while the null hypothesis is wrong, it is not rejected.