
Last updated on 04th Jun 2020| 3414
MSBI, Microsoft’s Business Intelligence suite, includes SSIS for data integration, SSAS for data analysis and modeling, and SSRS for report generation. SSIS manages data extraction, transformation, and loading, while SSAS supports multidimensional analysis and data mining. SSRS facilitates report creation and delivery, enabling informed decision-making through comprehensive data utilization. Together, these components form a robust end-to-end solution for businesses, from data handling to valuable insights and reporting.
1. What is MSBI?
Ans:
MSBI stands for “Microsoft Business Intelligence.” It is a powerful suite of tools developed by Microsoft to provide best-in-class business intelligence solutions.
2. What are the tools that we have in MSBI?
Ans:
- SSIS
- SSAS
- SSRS
3. What is full form for SSIS ? Explain it.
Ans:
SQL Server Integration Service. This is a tool that allows data integration and workflow applications. It’s often used to extract data from various sources, transform that data to suit operational needs (through transformations), and then load the data into end destinations.
4. Explain about SSAS.
Ans:
SQL Server Analysis Services. This tool provides multidimensional data analysis capabilities. With SSAS, organizations can structure their data into cubes that can then be analyzed in various ways. There are two models in SSAS: Multidimensional and Tabular.
5. Define SSRS.
Ans:
SQL Server Reporting Services. SSRS allows users to design and generate interactive reports. These reports can be viewed through a web browser or directly within a Windows application.
6. What is SSIS?
Ans:
SQL Server Integration Services is a Microsoft SQL Server database software component that may be used to conduct a range of data integration and data transformation operations.
7. What is the overview of SSIS?
Ans:
ETL: Extracting, Transforming, and Loading data.
Data Migration: Transferring data between various sources.
Workflow: Linking tasks in sequences.
8. Explain the difference between control flow and data flow in SSIS.
Ans:
Control Flow: Manages tasks like executing SQL scripts, sending emails, or processing files.
Dictates the order of operations and logic using tasks and precedence constraints.Data Flow: Handles the flow of data between sources and destinations. Uses transformations to manipulate data as it moves from source to destination.
9. How many types of transformation are in SSIS?
Ans:
There are 26 types of transformation in SSIS.
- Data Conversion
- Derived Column
- Lookup
- Merge
10. What are the different types of transformations available in SSIS?
Ans:
Aggregation: Summarizes data, similar to SQL’s groups by.
Derived Column: Creates new columns from existing data.
Data Conversion: Converts data types.
11. What is merge ?
Ans:
“Merge” typically refers to the action of combining two or more sets of data or elements into a single set. It can have various contexts: Version Control: In systems like Git, “merge” refers to the process of combining the changes from one branch into another.
12. Short note on union all.
Ans:
UNION ALL” is an operation used in SQL (Structured Query Language) to combine the result sets of two or more SELECT statements. The “UNION ALL” transformation merges the results of these statements into a single result set that includes all rows, including duplicates.
13. Differences between Union and Union All.
Ans:
UNION: Combines and eliminates duplicate results from the result sets of two or more SELECT queries.
UNION ALL: Combines the result sets of two or more SELECT statements but retains duplicates.
14. Explain the difference between merge and union all transformations.
Ans:
Purpose: Combines data from two sources based on a specified join condition.
How it works: Similar to SQL’s JOIN operations (INNER JOIN, LEFT JOIN, RIGHT JOIN, etc.), the merge transformation aligns rows from two sources based on a common key or set of keys.
15. What is a connection manager in SSIS?
Ans:
In SQL Server Integration Services (SSIS), a Connection Manager is a link or a pathway to a data source. It defines the details required for SSIS to connect to external sources or destinations, such as databases, files, web services, and other data systems.
16. Explain the various types of connection manager.
Ans:
OLE DB Connection Manager: Connects to SQL Server and other databases that support OLE DB.
Flat File Connection Manager: Connects to flat files like CSV or text files.
Excel Connection Manager: Connects to Microsoft Excel workbooks.
17. How scope helps in connection manager?
Ans:
- Connection Managers can be defined at the package level or at the project level.
- Package-level Connection Managers are only available to tasks and components within that specific package.
- Project-level Connection Managers are shared across all packages in the same project.
18. Explain the configuration and runtime in connection manager.
Ans:
- When you set up a Connection Manager, you typically need to specify connection properties, such as server name, database name, authentication details, file paths, etc., depending on the type of connection.
- During execution of an SSIS package, the Connection Managers are used to establish connections to the specified data sources or destinations. They are crucial for tasks like data extraction, transformation, and loading (ETL processes).
19. What are the Dynamic properties of connection manager?
Ans:
The properties of a Connection Manager can be made dynamic using parameters or variables. This allows for more flexible and configurable ETL processes, where you might need to connect to different data sources based on runtime conditions or external configurations.
20. What are checkpoints in SSIS?
Ans:
Checkpoints are a mechanism to save the point of execution of an SSIS package. When a package fails, the checkpoint file retains information about which tasks completed so that on a restart, tasks that ran successfully before the failure can be skipped.
21. Why checkpoints are used in SSIS?
Ans:
Checkpoints in SSIS are used to save package execution progress. If a package fails, a checkpoint allows it to restart from the point of failure rather than from the beginning. This ensures data integrity, saves time, and resources during long or complex ETL processes.
22. How do the checkpoints work on SSIS ?
Ans:
- When you enable checkpoints in an SSIS package, SSIS will create a checkpoint file when the package starts.
- As tasks within the package complete successfully, their status is recorded in this file.
- If the package fails, the checkpoint file remains in place.
23. What are variables and what role do they play in SSIS packages?
Ans:
Variables in SSIS (SQL Server Integration Services) are objects that store values which can change during package execution. They play vital roles in SSIS packages:
Dynamic Behavior: Allow tasks and components to be configured at runtime, making packages flexible.
Value Storage: Hold values like counters, file paths, or connection strings that might change between executions.
Control Flow: Used in expressions and constraints to determine the flow of package tasks.
24. What are the types of SSAS models?
Ans:
Multidimensional Models (OLAP): Uses cubes to allow for quick querying and analysis of large datasets.
Tabular Models: Uses tables and relationships with in-memory technology to allow for fast querying and is simpler to model compared to OLAP.
Data Mining: Allows for pattern discovery, prediction, and forecasting
25. Why SSAS is used ?
Ans:
Data Modeling: Designing structured data hierarchies and relationships
Quick Data Retrieval: Using pre-aggregated OLAP cubes or tabular models.
Calculations: Utilizing MDX and DAX for complex computations.
Analysis Tools: Enabling data drill-down/up and pivoting.
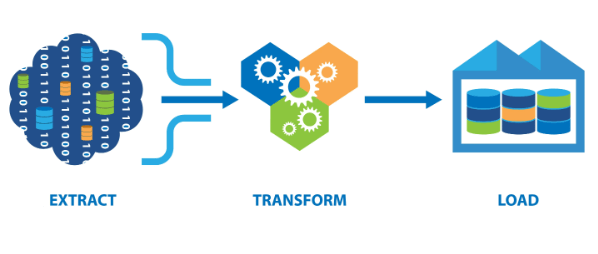
26. Explain the concept of ETL (Extract, Transform, Load).
Ans:
Extract: Pull data from various sources, which can be databases, spreadsheets, APIs, or other formats.
Transform: Clean, enrich, and reformat the data to make it suitable for analysis. This can include operations like filtering, sorting, aggregating, joining, and more.
Load: Insert the transformed data into a target database, data warehouse, or another platform for analysis or reporting.
27. What is tabular model in SSAS in short?
Ans:
The SSAS Tabular Model is a newer data modeling approach in SQL Server Analysis Services that uses in-memory database techniques to provide fast performance for relational data sources.
In-memory storage: Data is loaded into memory, enabling rapid query performance.
Relational Model: Organized in tables and relationships, similar to relational databases.
DAX (Data Analysis Expressions): The primary query and formula language used in the tabular model.
28. Differentiate between a multidimensional model and a tabular model in SSAS.
Ans:
Multidimensional Model (SSAS-MD): Based on the OLAP (Online Analytical Processing) cube concept. Data is stored in a multi-dimensional space.
Tabular Model (SSAS-Tabular): Based on columnar storage and in-memory database technology. Data is stored in tables, similar to relational databases. Uses DAX (Data Analysis Expressions) for calculations.
29. Explain SSAS models comparison.
Ans:
Multidimensional Model: Based on OLAP cubes. Uses dimensions and measures.
Query language: MDX. Suited for complex analytical scenarios with deep hierarchies.
30. Describe the concept of a cube in SSAS.
Ans:
A cube in SSAS refers to a multi-dimensional data structure used for fast data retrieval and analysis. It organizes data from one or more fact tables and related dimension tables, allowing users to slice and dice, drill down/up, and aggregate data easily. Cubes pre-aggregate data and provide a multidimensional view of data, which is optimal for querying and reporting in business intelligence scenarios.
31. What is a dimension and a measure in SSAS?
Ans:
Dimension: Categorical data used for analysis, like “Product” or “Time.” Helps in organizing and navigating data hierarchically.
Measure: Quantitative data, like “Sales” or “Quantity.” Represents aggregated values, usually subjected to operations like sum, average, or count.
32. What is calculated members in SSAS?
Ans:
In SQL Server Analysis Services (SSAS), calculated members are specially defined members of a dimension or measure group that are calculated at query time, rather than being stored in the cube. They are derived from existing members using Multidimensional Expressions (MDX), which is the query language for SSAS.
33. What is mean by named sets in SSAS?
Ans:
Named Sets are predefined groups of dimension members or tuples using MDX expressions. They simplify complex set definitions for reuse in queries.
Static: Fixed definition, doesn’t change.
Dynamic: Evaluated based on the current query context. They allow for custom groupings or calculations in cube analyses.

Become a Expert in BI & Data Mining Tools By Enrolling MSBI Training
- Instructor-led Sessions
- Real-life Case Studies
- Assignments
34. What are calculated members and named sets?
Ans:
Calculated Members: A calculated member is a custom member of a dimension in a cube that is defined by a formula or expression. This expression can use the values of other members in the cube. Unlike regular members that come from the source data, calculated members are derived based on formulas or calculations you define.
Named Sets: A named set is a custom-defined set of members or tuples. Think of it as a saved query or a custom grouping of members that you can reuse in multiple queries.
35. Define Hierarchy.
Ans:
In Microsoft Business Intelligence (MSBI), hierarchies structure data from general to detailed levels for intuitive navigation. In SQL Server Analysis Services (SSAS), hierarchies are vital for data analysis in cubes. In Power BI, they enhance visualizations, allowing drill-down capabilities. These hierarchies can be set up in Visual Studio’s Data Tools for use in tools like Excel or Power BI.
36. How do you handle hierarchies in SSAS?
Ans:
Create a New Dimension: Derived from a source database table.
Add Attributes: E.g., for a Time hierarchy: Year, Quarter, Month, Day.
Create Hierarchy: Right-click and choose “New Hierarchy” in the dimension.
37. Define MDX.
Ans:
MDX stands for “MultiDimensional eXpressions.” It is a query language for OLAP (Online Analytical Processing) databases, much like SQL is for relational databases. MDX is used primarily with Microsoft’s Analysis Services. With MDX, users can create and query multidimensional data structures, often used in business intelligence and data analysis applications.
38. Define DAX IN SSAS.
Ans:
DAX, which stands for “Data Analysis Expressions,” is a formula and query language used in various Microsoft products, including Power BI, Power Pivot for Excel, and SQL Server Analysis Services (SSAS) Tabular models. DAX is designed for working with relational data and offers functions that are specifically tailored for columnar databases. In the context of SSAS, DAX is primarily used in Tabular models to create custom calculations and aggregations for data analysis.
39. Explain the role of MDX and DAX in SSAS.
Ans:
MDX (Multidimensional Expressions) is used in multidimensional models, like cubes, for complex queries and data manipulation. DAX (Data Analysis Expressions) is used in tabular models, focusing on formulas, calculated columns, and measures. MDX is for OLAP cubes, while DAX is for tabular models in SSAS, catering to different data modeling needs.
40. What is SSRS? What are its main components?
Ans:
SSRS stands for SQL Server Reporting Services. It’s a server-based report generation software system from Microsoft. It is part of the suite of tools provided by Microsoft SQL Server and was first introduced in 2004.
- Report Server
- Report Designer
- Report Manager
41. What is parameterised report ?
Ans:
Allows users to specify criteria for report data. Uses input values (parameters) to dynamically filter or customize content. Enables dynamic, user-driven reports by adjusting data and presentation based on user inputs.
42. What is linked report ? Explain .
Ans:
A linked report is a concept primarily associated with reporting tools and platforms, such as Microsoft’s SQL Server Reporting Services (SSRS). In simple terms, a linked report is a report that derives from an existing report but can have its own set of properties, parameters, and security settings. It’s a way to create different versions of a report without changing the original or making multiple copies of the report definition.
43. Explain the characteristics of linked report.
Ans:
Source Report: The linked report maintains a link to its original report, often referred to as the source or parent report.
Parameters: A linked report can have different default parameter values than the original.
Properties: Things like description, name, and location can be distinct from the source report.
44. Explain the difference between a parameterized report and a linked report.
Ans:
Parameterized Report: Allows users to specify input (parameters) to fetch and display dynamic data. Offers interactivity and customization based on user input.
Linked Report: A reference or pointer to an existing report but can have different settings (like parameters or security). Useful for presenting the same report data in different ways or to different audiences without duplicating the report.
45. How do you implement security in SSRS?
Ans:
Authentication: Integrate with Active Directory or use custom authentication.
Roles: Assign predefined roles (e.g., Browser, Content Manager) to users/groups. Item-level Security: Set permissions on folders, reports, and shared data sources.
46. How do subreports work?
Ans:
A subreport is a report item that appears inside the main report body and provides a link to another report. Database reporting solutions like Microsoft’s SQL Server Reporting Services (SSRS), Crystal Reports, and others commonly exploit this idea.
47. What distinguishes drill-through reports from sub reports?
Ans:
Drill-through reports are accessed separately from the main report and provide more detailed data related to a specific point in the main report. Subreports, on the other hand, are embedded within the main report to provide supporting or related information in the same document.
48. Explain the different kinds of charts that SSRS offers.
Ans:
Column: Vertical bars that are helpful for contrasting data.
Bar: For comparing specific data points, use horizontal bars.
Area: Highlights changes in magnitude over time.
49. In SSRS, how do you schedule a report?
Ans:
Manager of Reports: Launch the SSRS web application.
Locate Report: Go to the required report.
Subscription: Select “New Subscription” from the menu.
50. What are subscriptions based on data?
Ans:
One component of SQL Server Reporting Services (SSRS) is data-driven subscriptions. They let you disseminate reports using dynamic subscription data that was obtained from an outside data source. Data-driven subscriptions produce this information from a database query rather than requiring the user to explicitly select report parameters, recipients, or delivery options.

Enroll in MSBI Certification Course From Real-Time Experts
Weekday / Weekend BatchesSee Batch Details51. What are the main benefits of using the MSBI suite of tools for an organization?
Ans:
Data Integration: Simplify data gathering from various sources using SSIS.
Advanced Analytics: Utilize SSAS for complex data analysis and forecasting.
Interactive Reporting: Create insightful reports with SSRS.
52. How does MSBI integrate with Microsoft tools, like Excel ?
Ans:
SSIS for data transfer, SSAS for multidimensional analysis, Power Query/Pivot for data manipulation, Power BI for visualisation, SharePoint for sharing, and SSRS for report exporting to Excel are all ways MSBI connects with Excel.
53. How does MSBI integrate with Microsoft tools like sharepoints ?
Ans:
MSBI integrates SSRS reports into SharePoint libraries, enables interactive dashboards via PerformancePoint, and hosts PowerPivot/Power View reports, fostering collaborative data analysis and accessibility within SharePoint for streamlined decision-making processes.
54. What is Multi dimensional model ?
Ans:
SQL Server Analysis Services (SSAS) Multidimensional Model is based on the traditional OLAP (Online Analytical Processing) paradigm. This model offers a way to design data cubes that can quickly answer complex queries by pre-aggregating data.
55. Explain about the Extract.
Ans:
- The initial step in the ETL (Extract, Transform, Load) process.
- Involves retrieving raw data from source systems.
- The data can come from databases, files, APIs, or other sources.
56. How would you handle performance optimization in an MSBI project?
Ans:
Handling performance optimization in an MSBI (Microsoft Business Intelligence) project requires a systematic approach, keeping in mind the tools in the MSBI stack: SSIS (Integration Services), SSAS (Analysis Services), and SSRS (Reporting Services).
57. What are the general steps to handle performance optimization?
Ans:
Analyze: Use tools to find bottlenecks.
Prioritize: Target major issues first.
Optimize Code: Refactor as needed.
Infrastructure: Consider hardware upgrades.
Caching: Use or improve caching.
58. Describe a challenging problem you faced in an MSBI project.
Ans:
During an MSBI project, we faced a challenge where the SSIS (SQL Server Integration Services) package was failing intermittently when pulling data from a legacy system. The error logs were not clear about the root cause, and due to the sporadic nature of the issue, replicating it was tough.
59. How to resolve the problem in MSBI?
Ans:
Identify the Issue: Check error messages or logs for details.
Isolate the Problem: Test related components individually (e.g., specific SSIS task or SSAS query).
Search Online: Use error messages or problem descriptions to find solutions on forums, Microsoft documentation, or blogs.
60. Which tools or parts make up the MSBI suite?
Ans:
The primary instruments/parts of MSBI are:
- For ETL tasks, use SQL Server Integration Services (SSIS).
- To generate reports, use SQL Server Reporting Services (SSRS).
- For OLAP-based data analysis, use SQL Server Analysis Services (SSAS).
61. Describe ETL.
Ans:
ETL stands for extract, transform, and load. It is a process that compiles data from many sources, alters it in line with corporate guidelines, and then uploads it into a database.
62. How are a cube and a database different from one another?
Ans:
A database is a grouping of connected data tables, whereas a cube is a multi-dimensional storage structure in SSAS that enables quick data queries. Databases are geared for CRUD operations, while cubes are optimized for analysis and sophisticated queries.
63. What is the role of the Data Flow task in SSIS?
Ans:
The Data Flow task is a key component in SSIS, responsible for moving data from source to destination and allowing transformations to be applied on the data while it’s in transit.
64. How can you deploy an SSRS report?
Ans:
SSRS reports can be deployed using the Report Designer in SQL Server Data Tools or by using the Report Manager web interface.
65. What is a dimension in SSAS?
Ans:
A dimension is a structure, often a table, that categorizes data in the cube. For instance, a “Time” dimension might categorize data by year, quarter, month, and day.
66. Can you explain what checkpoints are in SSIS?
Ans:
Checkpoints in SSIS allow a package to restart at the point of failure rather than re-executing the entire package from the beginning.
67. What types of transformations are available in SSIS?
Ans:
SSIS provides various transformations like Sort, Merge, Lookup, Derived Column, Data Conversion, and Aggregate, among others.
68. How is security implemented in SSRS?
Ans:
Role-based security is a technique used by SSRS. Roles may be given to individuals or organisations, and they may grant access to reports and other resources.
69. What are measure groups in SSAS?
Ans:
Measure groups in SSAS are collections of related measures inside a cube. Each measure group is associated with a single fact table in the data source.
70. What is a Data Source View (DSV) in SSAS?
Ans:
Data Source View (DSV) is an abstraction of the data sources, which can be used to manage tables, views, and relationships between them within SSAS projects. It provides a logical model of the data, independent of the physical database structure.
71. What is the difference between a Merge Join and a Lookup transformation in SSIS?
Ans:
A Merge Join requires both input streams to be sorted and can perform INNER, LEFT OUTER, and FULL OUTER joins. The Lookup transformation is used to join data from two sources based on a single key column and retrieves a column from the reference dataset.
72. What are snapshots in SSAS?
Ans:
Snapshots in SSAS are instances of a cube at a particular point in time. They can be used to maintain historical data or to compare data between different time frames.
73. What are the different types of SSIS configuration?
Ans:
SSIS configurations allow external values to be provided to the package at runtime. Types include XML configuration files, environment variables, registry entries, SQL Server table, and Parent package variables.
74. What are subreports in SSRS and when should they be used?
Ans:
Embedded Reports: Subreports are individual reports integrated within a primary or main report in SQL Server Reporting Services (SSRS).
Modularity: They break down complex reports into smaller, more manageable sections, improving readability and maintenance.
75. What is the difference between Tabular and Multidimensional models in SSAS?
Ans:
The Multidimensional model uses OLAP cubes and dimension-based modeling, suitable for complex aggregations and hierarchical data structures. The Tabular model uses columnar storage and in-memory processing, offering a relational perspective and is generally faster and simpler than the multidimensional model.
76. What is the Slowly Changing Dimension (SCD) in SSIS?
Ans:
SCD deals with how to handle changes in dimension data over time. It provides mechanisms to manage changing data in a warehouse environment. SSIS provides an SCD wizard to handle these types of changes.
77. What are the key components of SSRS architecture?
Ans:
Report Server: Oversees the processing, rendering, and transmission of reports.
Report Manager: A web-based interface that allows you to manage reports and objects.
Report Server Database: A database that stores metadata, report information, and settings for the Report Server.
78. How can you handle errors in SSIS?
Ans:
Errors in SSIS can be handled using “Event Handlers” and “Error Outputs.” Event Handlers are tasks that run in response to events raised during package execution. Error Outputs are paths in data flow components where error data is directed.
79. What are actions in SSAS?.
Ans:
Actions in SSAS define operations that can be performed based on user interactions with items in a cube or dimension. They can be used to provide additional details, trigger reports, or navigate to a web page.
80. What is the purpose of SQL Server Integration Services (SSIS)?
Ans:
SSIS is used for ETL (Extract, Transform, Load) operations, which involve extracting data from various sources, transforming it according to business rules, and loading it into a destination database.
81. How can you schedule SSIS package execution?
Ans:
SSIS packages can be scheduled using SQL Server Agent, which allows you to automate package execution at specified intervals or times.
Deploy: Ensure SSIS package is on SQL Server or SSIS Catalog.
SQL Server Agent: Open SSMS > Connect to SQL Server > Expand “SQL Server Agent” > Right-click “Jobs” > “New Job”.
Job Setup: Name job > “Steps” > “New” > Select “SQL Server Integration Services Package” type > Choose SSIS package.
Scheduling: “Schedules” > “New” > Define frequency.
Save: Click “OK”.
Note: Ensure SQL Server Agent is running.
82. What are data sources and data source views in SQL Server Analysis Services (SSAS)?
Ans:
Data Sources (DS):Define connections to databases.
- Define connections to databases.
- Includes connection strings, credentials, and other properties.
- Can connect to SQL Server, Oracle, Teradata, and more.
83. What is a fact table in the context of SSAS?
Ans:
In SSAS, a fact table contains quantitative data (measures) and is associated with dimension tables. It forms the core of a multidimensional model used for analysis.
- Central table in a star or snowflake schema.
- Contains measurable numeric data (facts).
- Linked to dimension tables via foreign keys.
84. Explain the difference between a star schema and a snowflake schema in SSAS.
Ans:
Star Schema: Dimension tables directly linked to fact table. Denormalized, meaning redundancy might exist in dimension tables.
Snowflake Schema: Dimension tables normalized, causing them to branch out further. Reduces redundancy but can be more complex to query.
85. How can you create a calculated measure in SSAS?
Ans:
Calculated measures in SSAS are created using MDX (Multidimensional Expressions) or DAX (Data Analysis Expressions) depending on whether you’re working with a Multidimensional or Tabular model.
86. What is a KPI (Key Performance Indicator) in SSAS?
Ans:
- Measures performance against a specific goal.
- Consists of a measure (value), target value, and status expression.
- Often visualized with traffic lights or gauges in reports.
- Used to track business objectives in SSAS cubes.
87. What is the purpose of SQL Server Reporting Services (SSRS) subscriptions?
Ans:
- Automate report delivery.
- Send reports to users on a defined schedule or event.
- Can deliver to various formats (e.g., email, shared folder).
- Ensures timely access to data without manual report execution.
88. What is the role of the SSRS Report Builder?
Ans:
- User-friendly tool for designing reports.
- Allows users to create, edit, and preview reports without using the full SSRS development environment.
- Supports drag-and-drop, and wizards for common tasks.
89. Can you explain the concept of drill-through in SSAS?
Ans:
- Allows users to navigate from a summary (aggregated data) to detailed data.
- Provides deeper insights into specific data points in a cube.
- Often used in reporting to explore the.
90. What is a Managed Package in SSIS?
Ans:
A managed package in SSIS is a package that is stored and managed in SQL Server or the SSIS service, rather than a file system.
SSIS Packages: These are workflows of operations performed on data, like ETL (Extract, Transform, Load) processes. They can be produced by the SSIS runtime and performed by utilising the SQL Server Data Tools (SSDT). They contain tasks, transformations, and other components.
91. What are data-driven subscriptions in SSRS?
Ans:
Data-driven subscriptions in SSRS allow you to use dynamic subscription data that’s retrieved from an external data source. This lets you generate and send reports to a dynamic list of subscribers.
92. What are data-driven subscriptions in SSRS?
Ans:
- Central table in a data warehouse’s star or snowflake schema.
- Contains quantitative data (facts) like sales, revenue, or counts.
- Has foreign keys connecting to dimension tables.
- Often includes aggregated data for better query performance.
93. How can you handle errors in SSIS?
Ans:
Error Outputs: Redirect erroneous rows in data flow components.
Event Handlers: Respond to package events or errors.
Configure Error Handling: Set dispositions for errors/truncations in data flow columns.
Logging: Enable to capture runtime details.
Try-Catch Logic: Use Sequence Containers with precedence constraints.
94. What is Parameterized Reporting in SSRS?
Ans:
Parameterized reporting in SSRS allows you to create reports that accept inputs at runtime, letting users define a subset of data they want to see. Uses user-input parameters to fetch dynamic data.
95. How can you improve the performance of an SSIS package?
Ans:
- Choosing the right data flow buffer size will enhance performance. Minimizing transformations.
- Using SQL Server destinations instead of OLE DB destinations for loading data into SQL Server.
96. What is a Linked Report in SSRS?
Ans:
A reference to an existing report with potential different settings. Can have its own parameters, security, and subscription settings. Uses the same report definition as the original.
97. What are aggregations in SSAS?
Ans:
Aggregations in SSAS are pre-calculated summaries of data, which can speed up query times. They are created to improve the performance of multidimensional queries.Defined on measures from fact tables, often combined with attributes from dimension tables.
98. How can you deploy SSIS packages?
Ans:
Project Deployment: Transfers entire projects to SSIS catalog.
Package Deployment: Moves individual packages to file system, SQL Server, or SSIS Package Store.
99. What is the difference between a snapshot report and a cached report in SSRS?
Ans:
A snapshot report includes information on the layout and search results that were retrieved at a certain moment. Until a fresh snapshot is taken, nothing changes. By reducing the overhead of processing the report for each request, a cached report is a duplicate of a processed report that has already been saved.
100. How can you optimize performance in SSIS?
Ans:
- Using the appropriate batch size.
- Avoiding unnecessary data type conversions.
- Using “Fast Load” option in destinations.
- Reducing the logging level.


