
Last updated on 04th Jul 2020| 5263
Our Dimensional Data Modeling Interview delves into fundamental principles of designing data warehouses and business intelligence systems. This discussion revolves around organizing data for optimal querying and reporting, emphasizing the development of dimensional models to enhance analytical efficiency. Commonly addressed topics include Fact Tables, Dimension Tables, Star Schema, and Snowflake Schema, with interview questions designed to assess candidates’ comprehension of key dimensional data modeling concepts.
1. Dimensional data modelling: what is it?
Ans:
Purpose: Dimensional data modelling is applied in the realm of data warehousing to facilitate swift and uncomplicated reporting and querying.
Approach: It entails crafting a logical model that articulates business concepts and their interconnections in a manner easily comprehensible to end-users.
Objective: The objective is to structure data in a way that resonates with how business users conceptualise their operations, fostering intuitive reporting and analysis.
2. What constitutes a dimensional data model’s essential elements?
Ans:
Facts: Numeric performance metrics or measurable business data.
Dimensions: Descriptive characteristics or hierarchies providing context to facts.
Attributes:Supplementary dimensional characteristics supplying more information about dimensions.
Example: In a sales context, the “Sales Amount” is a fact, while “Product,” “Time,” and “Location” serve as dimensions, with attributes like product color or city population.
3. What is a schema for stars?
Ans:
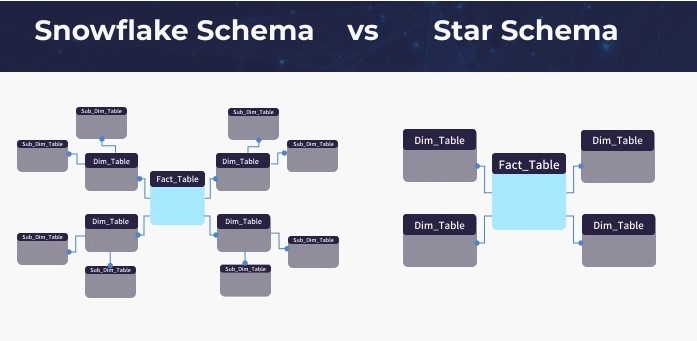
Structure: Comprises a central fact table linked to multiple denormalized dimension tables, forming a star-shaped structure.
Advantages: Streamlines querying and reporting by enabling direct associations between the fact table and specific dimensions. Enhances performance for analytical queries.
4. A snowflake schema: what is it?
Ans:
- Another dimensional data type is the snowflake schema, in which dimension tables are further subdivided into normalised sub-dimensions.
- This produces a structure with a snowflake-like appearance.
- Compared to the star schema, it can make queries more complex even while it decreases redundancy.
5. What factors need to be taken into account while creating aggregate tables to optimize query performance?
Ans:
Purpose: Addresses the complexity of managing changes to dimensional data over time.
Types: Type 1 (overwriting current data), Type 2 (creating new records for updates), and Type 3 (maintaining old and new values in separate columns).
Application: Applied to track historical alterations in dimension attributes, such as employee roles or product descriptions.
6. Justify the gradually Surrogate Key.
Ans:
Definition: A surrogate key is a simple, unique identifier (often an integer) assigned to a dimension table for ease of maintenance.
Purpose: Utilized in lieu of natural keys to ensure consistency and stability, particularly when natural keys might undergo changes.
7. Why is a surrogate key used in dimensional modelling, and what does it mean?
Ans:
In the realm of dimensional modeling, a surrogate key serves as a synthetic identifier crucial for uniquely identifying each record within a dimension table in a data warehouse or data mart. The term “surrogate key” denotes an artificial key introduced for specific purposes.Uniqueness: Surrogate keys ensure the uniqueness of each dimension record, providing a stable identifier that persists even when natural or business keys undergo changes.Stability: Unlike natural keys, which may change due to updates or corrections, surrogate keys remain constant.Performance: Surrogate keys typically consist of simple numeric values, enhancing efficiency for indexing and querying compared to complex natural keys.
8.What distinguishes snowflakes from star schema in database design?
Ans:
Star schema simplifies with a core fact table and denormalized dimensions for performance, while snowflake schema normalises dimensions for storage efficiency, increasing complexity with normalised tables and additional joins.
9. Describe what is meant by “conformed dimensions.”
Ans:
Definition: Conformed dimensions are dimensions that maintain uniformity in meaning and content across various data marts and data warehouses within an organization.
Importance: Ensures consistency in reporting, facilitating accurate analysis and comparisons across diverse business units or departments.
10. What benefits does utilising a dimensional data model offer?
Ans:
Reporting and Querying: The structure of dimensional models makes reporting and querying simple. The process of pulling data from the database is made easier by using star or snowflake schemas.
Improved Performance of Analytical Queries: Improved query performance is frequently a result of the structure of dimensional models, particularly star schemas. This is critical for analytical processing when it’s important to get insights quickly.
Enhanced Knowledge of Users: The dimensional models’ user-friendly layout facilitates end users’ understanding and navigation of the data. This comprehension improves the data warehouse’s usefulness for reporting and making decisions.
Adaptability to Change in Response to Business Needs: Dimensional models are more effectively able to adjust to shifting business needs. Because of its modular design, the integration ofadditional features or alterations without changing the model as a whole.
11. What does a factless fact table aim to achieve?
Ans:
Depiction of Occurrences without Measurements: Factless fact tables are made without using numerical measurements in order to depict events or connections between dimensions. This is especially helpful when tracking occurrences rather than measurable data is the main goal.
Keeping an eye on Connections or Events: Monitoring and analyzing occurrences or relationships between various dimensions is the main objective. It offers a thorough understanding of relationships without being constrained by numerical values.
12. Describe what is meant by “junk dimensions.”
Ans:
Handling Flags or Indicators: Small, low-cardinality dimensions known as “junk dimensions” are designed to handle flags or indicators that don’t neatly fit into pre existing dimensions. This helps prevent too many flags from clogging up the main dimensions.
Column Count Reduction: The fact table can have fewer columns if garbage dimensions are used. This makes the data structure neater and more structured.
13. How should a dimensional data model manage missing or unknown values?
Ans:
Specified Codes or Default Values: Assigning specific codes or default values to denote unknown or missing data is one method. This guarantees that such values can still be included in and taken into account by queries and reports.
Surface Component Creation for “Unknown” Dimension: Another strategy is to include a unique “unknown” dimension element. This preserves the data model’s clarity by offering a distinct category for addressing missing or unknown values.
14. When is it utilised, and what is a bridge table?
Ans:
Fixing Many-to-Many Relationships: When working with many-to-many relationships between dimension tables, bridge tables are utilised. They behave as go-betweens, enabling the relationship between dimensions without generating redundant information or compromising data integrity.
Keys from Linked Dimensions: In order to ensure that the relationships between the connected dimensions are accurately represented without adding to the overall complexity of the structure, the bridge table comprises keys from both linked dimensions.
15. What benefits does the star schema have over the snowflake model?
Ans:
Enhanced Query Efficiency: Because star schemas have simpler join structures, they typically provide greater query performance. This is helpful in data warehousing situations when information retrieval quickly is essential.
Simplicity of Understanding and Upkeep: Star schemas are easy to comprehend and maintain because of their simplicity. This reduces complexity and potential errors, which is good for the data warehouse’s development and continuing management.
16. Describe the distinction between a composite key and a degenerate dimension.
Ans:
| Feature | Composite Key | Degenerate Dimension | |
| Definition |
A composite key is a primary key composed of multiple columns.. |
A degenerate dimension is an attribute in the fact table, not associated with a separate dimension table. | |
| Structure | It is typically a combination of two or more columns acting as a unique identifier. | It is a single attribute or a set of related attributes directly present in the fact table. | |
| Usage |
Used as a primary key in the fact table to establish relationships with multiple dimensions.. |
Used to provide additional context or information about a specific transaction in the fact table.. | |
| Examples | Examples include MD5, SHA-256, SHA-3. | Examples include AES (Advanced Encryption Standard), RSA (Rivest-Shamir-Adleman). | |
| Examples |
Primary Key: (ProductID, TimeID, LocationID). |
Invoice Number, Tracking Number, Order Number, etc… | |
| Relationships |
Links the fact table to multiple dimension tables. |
Does not establish relationships with other tables; it exists within the fact table itself. |
17. What frequent features are found in a time dimension table, and how do you construct one?
Ans:
- Shared attributes: Properties like day, month, quarter, year, and other pertinent time-related hierarchies are usually included in a time dimension table.
- Further Features: It could include elements such as the day of the week, federal holidays, fiscal years, or any other characteristics that set time-related data in context.
- Building: You build a time dimension table by adding distinct values to each time-related field. Days, months, and years, for instance, are filled in according to the range of dates that are significant to the company. The table is then connected to fact tables by means of time-related keys.
18. Why is it vital to understand what a conformed fact is?
Ans:
Understanding conformed facts in data warehousing is crucial for several reasons:
- Consistency: Ensures uniformity in reporting.
- Interoperability: Facilitates collaboration across data sources.
- Cross-Functional Analysis: Enables meaningful comparisons.
- Data Integrity: Maintains consistency in metrics and measures.
- Scalability: Supports growth without compromising data coherence.
- Efficiency: Streamlines development, minimizing redundancy.
19. Explain the notion of drill-down and roll-up in the context of dimensional data modelling.
Ans:
Roll-Up: Going from a detailed level to a higher-level summary in the data hierarchy. Changing daily sales data to monthly or annual aggregated figures is one example.
Drill-Down: Going from a higher-level overview to a more comprehensive level. For instance, looking at detailed product sales after first seeing the region’s total sales. Within the data model, these ideas enable flexible analysis and querying.
20. In a Type 2 situation, how would you manage gradually shifting dimensions?
Ans:
Managing Gradually Shifting Dimensions: Gradually shifting dimensions: new records are created with the most recent data whenever a dimension changes.
Inactive Designation: By designating the prior record as inactive, the current state of the dimension is preserved while historical examination is permitted.
Instance: When a worker’s department changes, the old record is marked as inactive and a new one is made with the updated department details. This makes it possible to trace previous departmental affiliations.
21. In the context of a data warehouse with several topic areas, what is a conformed dimension?
Ans:
Common and Uniform: In a data warehouse including numerous topic areas, a conformed dimension is one that is shared and uniform throughout the subject areas.
Reporting and Analysis according to Standards: Users can rely on a shared understanding of dimension because of its uniform application, which guarantees standardized reporting and analysischaracteristics in a range of topics or domains.A role-playing dimension is a single dimension table that is used repeatedly in a fact table, each time with a different role or perspective.
22. Describe what a role-playing dimension is.
Ans:
A single dimension table that is utilised again in a fact table, each time with a new role or perspective, is called a role-playing dimension. A date dimension used for the order date and the ship date is one example.
23. In what way can query performance be optimised inside a dimensional data model?
Ans:
Instance: A date dimension table utilized in a sales fact table for both the order date and the ship date serves as an illustration. Multiple dimension tables are not necessary because each usage represents a distinct role or perspective of the same dimension table, permitting study from multiple angles.
24. What distinguishes a galaxy schema from a star schema?
Ans:
One fact table joined to several dimension tables makes up a star schema. A constellation schema, sometimes referred to as a galaxy schema, consists of several fact tables linked by common dimensions.
Star Schema: A star schema is created by joining multiple dimension tables to a single fact table, creating a structure like a star.
Schema Galáxy: A constellation or galaxy schema is composed ofis made up of multiple fact tables joined by shared dimensions, forming a more intricate structure that resembles a constellation.
25. Describe the bridge table’s Representation of Many-to-Many Relationships.
Ans:
Bridge Table in Dimensional Data Models: In a star schema, a many-to-many relationship between two dimension tables is represented by a bridge table.
suitable Linking: It incorporates keys from both dimensions and permits suitable linking between the dimensions involved in the many-to-many interaction.
26. What are aggregate tables, and how can one utilise them to enhance functionality?
Ans:
For the purpose of accelerating query performance, aggregate tables include precomputed summary data. They lessen the necessity to carry out intricate calculations on the spot by storing aggregated values at several degrees of granularity.
Query Performance Acceleration: Precomputed summary data is stored in aggregate tables to speed up query execution. They eliminate the need for intricate computations to be made while executing queries because they contain aggregated values at different granularities.
27. Using a dimensional data model, how do you deal with shifting business needs?
Ans:
Iterative modelling, in which changes are made to the data model in response to changing business demands, is a means of responding to changing requirements. Dimensions, facts, and hierarchies could all be added or changed.
Continuous Stakeholder Communication:Maintain ongoing discussions with business stakeholders to grasp changing priorities and strategic shifts.
Flexible Dimensional Design:Design dimensions with flexibility, considering the incorporation of new attributes, hierarchies, or adjustments without significant structural modifications.
Scalable Architecture:Ensure the model’s architecture is scalable, accommodating potential additions of new data sources, tables, or extensions as business demands evolve.
28. And when is it used? What is a Quick Reference Table?
Ans:
In the context of dimensional data models, a quick reference table plays a pivotal role in summarizing crucial details associated with dimensions and facts. This table provides a condensed overview, encompassing key elements such as dimension names, primary keys, attributes, hierarchies, and their relationships with pertinent facts. It serves as an efficient reference guide, offering a snapshot of the structural composition and descriptive aspects of each dimension, as well as outlining the measures associated with the facts. This resource proves invaluable for data modelers, analysts, and stakeholders, offering a swift and comprehensive understanding of the dimensional schema’s architecture and organization.
29. Describe the idea of a dimension that is slowly shifting category 1.
Ans:
A slowly shifting dimension categorized as Category 1 in the realm of dimensional data modeling is characterized by its nuanced approach to managing changes in descriptive attributes over time. This category specifically deals with gradual alterations, where adjustments to attribute values unfold progressively and incrementally. The primary focus of such dimensions revolves around accommodating shifts in descriptive data, changes that, while significant, do not substantially redefine the core identity of the dimension.
30. In a dimensional data model, how can data quality be guaranteed?
Ans:
Validation Checks: Applying validation checks guarantees that the data follows established guidelines and standards.
Referential Integrity Requirements: Consistency between connected tables is maintained through the enforcement of referential integrity requirements.
Data Purification: Improving the quality of the data is ensured by doing data cleansing and purification prior to loading it into the data warehouse.
Data Governance Procedures: Putting data governance procedures into practice aids in creating and upholding standards for data quality.
Monitoring and Data Profiling: Proactively detecting and resolving data quality concerns requires frequent monitoring and data profiling operations.
31. What distinguishes a constellation schema from a star schema?
Ans:
Star Schema:
- Structure: Central to a star schema is a fact table, containing quantitative measures, surrounded by dimension tables that hold descriptive attributes
Constellation Schema (Snowflake Schema):
- Relationships: The relationships in a star schema are direct and straightforward, forming a star-like pattern.
- Simplicity: Star schemas are known for their simplicity, making them easily comprehensible and suitable for scenarios with a primary fact table and several related dimensions.
- Structure: A constellation schema extends the star schema by normalizing dimension tables into sub-dimensions, creating a more complex, snowflake-like structure.
- Relationships: Unlike the star schema, a constellation schema involves some dimension tables being related to others, resulting in a network of intricate relationships.
- Normalization: Dimension tables in a constellation schema are normalized, reducing redundancy but introducing a more intricate schema. Each dimension table may have sub-dimensions, resembling a snowflake.
- Use Cases: Constellation schemas are employed when a higher degree of data normalization is necessary or when complex hierarchical relationships among dimensions need representation.
32. Explain the concept of a hypercube in dimensional data modelling.
Ans:
Dimensions: The hypercube is characterized by several dimensions, each signifying a distinct attribute or characteristic of the data. For instance, in a sales hypercube, dimensions might encompass time, geography, products, and customers.
Measures: Within the hypercube, measures or metrics are present to quantify data points, offering quantitative insights at the intersections of specific dimension values.
Cuboid: A cuboid, a smaller unit within the hypercube, represents a unique combination of dimension values. Each cuboid holds a set of data points linked to its corresponding dimension values.
Drill-down and Roll-up: The hypercube supports operations such as drill-down, involving a transition from a higher aggregation level to a more detailed one, and roll-up, which involves moving from detailed data to a higher level of aggregation.
Slicing and Dicing: Slicing entails selecting a specific value along one dimension to observe a “slice” of the hypercube, while dicing involves selecting values along multiple dimensions to examine a more detailed subset of the data.
33. When is it okay to utilise a degenerate dimension, and what does that mean?
Ans:
- Single-Value Attributes: When a dimension possesses only one attribute or value, and that value is directly available in the fact table, it can be represented as a degenerate dimension. For instance, a transaction ID or invoice number may serve as a degenerate dimension, uniquely identifying a transaction.
- Convenience: In situations where creating an additional dimension table for a single attribute would not significantly enhance analysis and reporting, a degenerate dimension provides a convenient and efficient solution. It eliminates the necessity for an extra join operation in queries.
- Simplicity: When the data model is designed to be straightforward, and the dimension is uncomplicated with no need for additional attributes or hierarchies, utilizing a degenerate dimension contributes to a simplified structure.
- Transaction-Related Information: Degenerate dimensions are often applicable in transactional data scenarios where the dimension is inherently transaction-specific and lacks a broader context beyond individual facts.
34. What distinguishes a gradually evolving dimension Type 3 from Type 2?
Ans:
Type 2 Dimension:
- Change Management: Type 2 dimensions handle changes by creating new records for each alteration, maintaining a historical record with different effective dates.
- Attributes: Each record in a Type 2 dimension encompasses a set of attributes, and changes to any attribute trigger the creation of a new record.
- History: It offers a comprehensive historical perspective, enabling an analysis of how attributes have evolved over time.
- Use Cases: Type 2 is well-suited for scenarios requiring meticulous historical tracking, such as monitoring changes in employees’ job positions.
Type 3 Dimension:
- Change Management: Type 3 dimensions selectively track changes in specific attributes by maintaining multiple columns within the same record. Typically, one column stores the current value, while another stores the previous value.
- Attributes: Only chosen attributes are preserved in a historical context, and these attributes have designated columns for both current and previous values.
- History: It provides a limited historical view, focusing on preserving the history of a subset of attributes rather than the entire dimension.
- Use Cases: Type 3 is suitable when there’s a need to monitor changes in critical attributes over time, and a comprehensive historical record is not essential.
35. In dimensional modelling, what is the function of surrogate keys and how are they produced?
Ans:
- Surrogate keys are usually just basic numbers that serve as a unique identifier for dimension tables.
- To assure uniqueness, they are constructed using identity columns, sequences, and other mechanisms.
36.Describe what a conformed measure is.
Ans:
- Consistency: Conformed measures maintain a uniform definition and calculation logic across various business units.
- Shared Understanding: Stakeholders across different segments comprehend the meaning and calculation of conformed measures consistently.
- Integration: Facilitates seamless integration of data across diverse data marts and business domains.
- Cross-Functional Analysis: Enables meaningful comparisons and insights across different facets of the business.
- Reusability: Designed for efficient reuse across organizational segments, reducing redundancy and discrepancies.
- Attributes: Only chosen attributes are preserved in a historical context, and these attributes have designated columns for both current and previous values.
- History: It provides a limited historical view, focusing on preserving the history of a subset of attributes rather than the entire dimension.
- Use Cases: Type 3 is suitable when there’s a need to monitor changes in critical attributes over time, and a comprehensive historical record is not essential.
37. What is the process for converting currencies in a dimensional data model?
Ans:
- Identify Currency Attributes:Determine dimensions or attributes involving monetary values.
- Include Currency Dimension:Introduce a currency dimension to capture associated currencies.
- Source Exchange Rates:Obtain reliable exchange rates and update them regularly.
- Define Conversion Logic:Establish consistent logic (daily rates or average rates).
- Create Currency Conversion Tables:Develop tables for storing exchange rates and historical data.
- Integrate Exchange Rates:Connect rates to the currency dimension in the data model.
- Calculate Converted Measures:Create calculated measures for converted monetary values.
- Handle Historical Data:Account for changes in exchange rates over time.
- Testing and Validation:Thoroughly test the process and validate results.
- Documentation:Document the conversion process, logic, and considerations.
38. When is it allowed to employ a trash dimension and what is its purpose?
Ans:
A trash dimension finds its application in scenarios where there is a need to manage miscellaneous or unclassified data that doesn’t neatly fit into existing dimensions within a data model. Its purpose lies in capturing and categorizing data that might not conform to typical classifications or lacks a clear place in conventional dimensions. This can encompass outliers, errors, or data that defies regular categorization, providing a mechanism to handle such anomalous or uncategorized data effectively.
39. Describe the notion of a conformed role in relation to modelling dimensional data.
Ans:
In the realm of dimensional data modeling, the concept of a conformed role refers to a dimension’s ability to play different roles or perspectives across various contexts or business processes. This implies that a dimension can assume distinct roles, offering different attributes or hierarchies depending on the specific context in which it is utilized. The implementation of conformed roles enhances consistency and integration throughout different sections of the data model, contributing to a more versatile and adaptable dimensional structure.
40. What difficulties might arise while introducing gradually altering dimensions in a data warehouse?
Ans:
The introduction of gradually altering dimensions, whether they follow Type 1, Type 2, or Type 3 change patterns, introduces several potential challenges in a data warehouse environment. Challenges include ensuring the historical accuracy of data, addressing changes in reporting requirements over time, and managing the increased complexity that arises from tracking and maintaining historical versions of dimension attributes. Striking a balance between the need for historical data accuracy and the performance considerations of the data warehouse, as well as effectively communicating the evolving nature of the data to end-users, are critical aspects to navigate.
41. How does one handle the requirement for summaries and aggregations in a dimensional data model?
Ans:
To meet the requirement for summaries and aggregations in a dimensional data model, it is advisable to strategically pre-aggregate data at different levels within the model. This involves creating summary tables that store precomputed aggregated values, minimizing the need for extensive calculations during query execution.
The introduction of summary tables enhances query performance significantly, particularly when dealing with large datasets, and facilitates more efficient reporting. This approach aligns with the principles of dimensional modeling and optimizes the retrieval of aggregated information.
42. In dimensional modelling, what distinguishes a satellite table from a dimension table?
Ans:
- Within dimensional modeling, a dimension table is characterized by containing descriptive attributes that provide context to the data.
- On the other hand, a satellite table serves a distinct role by holding additional details or attributes specific to a subset of records within a dimension.
- Satellite tables are particularly useful for storing slowly changing or supplementary attributes without necessitating alterations to the primary dimension table.
- These tables are linked to the main dimension table through a shared key, establishing a relationship that enables the extension of information related to specific dimension records without impacting the primary dimension structure.
- The utilization of satellite tables enhances the flexibility and expansiveness of dimensional data modeling.
43. Describe the idea of a snowflake schema, including any potential benefits and drawbacks.
Ans:
Snowflake Schema:
- Description: Normalized dimensional data model in data warehousing.
Features:
- Normalization of dimension tables.
- Hierarchy maintained through sub-dimensions.
- Intricate structure resembling a snowflake.
Benefits:
- Reduced Redundancy: Normalization reduces data redundancy.
- Maintenance Ease: Easier maintenance, especially for updates.
- Data Integrity: Potential enhancement of data integrity.
Drawbacks:
- Complexity: Increased complexity with more joins.
- Performance Impact: Additional joins may impact query performance.
- Query Challenges: Writing queries can be more challenging.
44. What part does Online Analytical Processing, or OLAP, play in dimensional data modelling?
Ans:
Role: Facilitates multidimensional analysis.Functions: Supports aggregations and pre-aggregated structures.Interactivity: Enables interactive exploration of data.Operations: Allows slicing, dicing, and pivoting for varied perspectives.Enhancement: Enhances analytical capabilities of dimensional models.Flexibility: Provides flexibility in navigating and analyzing data.Complementarity: Complements star or snowflake schema structures.
45. How may a dimension be efficiently designed to manage hierarchical relationships?
Ans:
Creating an efficient design for managing hierarchical relationships in a dimension requires thoughtful planning to optimize queries and navigate these relationships seamlessly. Key strategies include:
Structured Attribute Hierarchies:Establish clear and structured attribute hierarchies within the dimension to represent different levels of granularity, ensuring a well-organized structure.Utilization of Parent-Child Relationships:Incorporate parent-child relationships to model hierarchical structures effectively. This approach facilitates efficient traversal and querying, especially in contexts such as organizational charts or product categories.Closure Tables or Path Enumeration Techniques:Implement closure tables or path enumeration techniques for situations with deep hierarchies. These techniques precalculate paths and relationships between nodes, enhancing query optimization.
46. Describe the idea of a mini-dimension and the situations in which dimensional modelling may use it.
Ans:
A mini-dimension is a discrete dimension table that is compact and designed to hold low cardinality characteristics.
A mini-dimension, within the context of dimensional modeling, refers to a subset of a dimension table containing a specific set of attributes. It is employed to represent a distinct perspective or category within the primary dimension. For instance, in retail, a mini-dimension within the “Product” dimension could capture attributes related to seasonal promotions for a specific subset of products. It assists in preventing qualities that don’t require a full dimension from overcrowding the main dimension table.
47. In dimensional modelling, what are bridge tables and how do they handle many-to-many relationships?
Ans:
In dimensional modeling, bridge tables serve as intermediary structures to manage many-to-many relationships between two dimensions. These tables store combinations of keys from both dimensions, enabling the representation of complex relationships efficiently. For instance, in scenarios where customers can belong to multiple product segments, a bridge table would store pairs of customer and product segment keys. By serving as intermediary tables with keys from both connected dimensions, bridge tables are utilised to resolve many-to-many relationships. They aid in the data model’s correct linking.
48. In a Type 1 scenario, how would you manage gradually changing dimensions when historical data is not needed?
Ans:
In Type 1 scenarios, where historical data is not retained, the approach to managing gradually changing dimensions involves straightforward overwriting of existing values with updated ones. This method simplifies the update process by modifying attributes in-place without preserving historical versions. It is suitable for situations where only the current state of the dimension is relevant. Changes to dimension attributes in a Type 1 slowly changing dimension are simply replaced, and no previous data is kept. When previous changes are irrelevant for study, this method works well.
49. In a dimensional data model, what is a garbage dimension and how does it help with performance?
Ans:
A garbage dimension, within the context of dimensional modeling, is a dimension table containing infrequently used or less critical attributes. This approach aids in performance optimization by segregating these attributes into a separate dimension. This ensures that the main dimension table remains focused on essential attributes, reducing the impact on query performance. For example, a “Miscellaneous” dimension might encompass infrequently used flags or codes. A dimension with low cardiacity qualities that doesn’t need its own dimension table is called a garbage dimension. It can increase efficiency by lowering the quantity of joins required for queries.
50. Describe the idea of a role-playing dimension and give an illustration.
Ans:
A role-playing dimension involves utilizing a single dimension table in multiple roles within a data model, each representing a different perspective or context. For example, a “Date” dimension could play roles such as “Order Date,” “Ship Date,” or “Delivery Date” within a sales data model. This flexibility enables querying based on various temporal aspects without requiring separate dimension tables for each role. A dimension table that is utilised repeatedly in a fact table, each time with a distinct role or perspective, is known as a role-playing dimension. A date dimension that is utilised for both the order date and the ship date is one example.

Get Dimensional Data Modeling Training from Real Time Experts
- Instructor-led Sessions
- Real-life Case Studies
- Assignments
51. How would one go about creating a dimension model for an attribute that changes gradually?
Ans:
Developing a dimension model for attributes undergoing gradual changes involves choosing an appropriate approach tailored to the data’s characteristics. Common strategies include:
Type 1: Direct Overwrite: Overwriting existing values without historical preservation.Type 2: Historical Tracking: Creating new records with effective date ranges for each change.Type 3: Limited History Storage: Storing limited history within the same record.Performance Impact of Adding or Removing Dimensions:
The right Type (e.g., Type 1, Type 2, or Type 3) must be selected for slowly changing qualities in accordance with the business demands and the significance of historical monitoring.
52. How does the performance of a data warehouse change when dimensions are added or removed?
Ans:
The performance of a data warehouse may be influenced by adding or removing dimensions. Adding dimensions can complicate queries, potentially impacting performance, while removing dimensions might enhance efficiency. The actual impact depends on factors like query workload, indexing, and the overall data warehouse architecture. While adding dimensions can make a query more complex, it could be required to collect more context. While removing dimensions can make queries simpler, there may be a loss of flexibility and information.
53. How are surrogate keys managed in data integration across various source systems?
Ans:
To maintain data integrity, surrogate keys need to be generated uniformly across source systems. Methods like table mapping or using universally unique To get this uniformity, strategies like mapping tables and employing universally unique identifiers (UUIDs) can be helpful. Effectively managing surrogate keys in data integration across various source systems involves employing strategies such as:
Centralized Surrogate Key Generator: Ensuring consistency through a centralized generator.Mapping Tables: Using mapping tables to reconcile surrogate keys between source and target systems.Standardized Key Generation Rules: Establishing standardized rules for surrogate key generation to maintain consistency.
54. Describe the idea of a gradually shifting Type 6 dimension.
Ans:
A Type 6 slowly changing dimension keeps its history and present values in separate columns, combining aspects of Types 1 and 2. This method offers adaptability in managing alterations. A Type 6 dimension, representing a gradually shifting dimension, combines elements of both Type 1 and Type 2. It maintains a current value, historical values with effective date ranges (Type 2), and a separate attribute to track changes over time (Type 1). This approach provides a comprehensive view of the dimension’s evolution.
55. Which typical mistakes in dimensional data modelling should one avoid?
Ans:
Overcomplicating the model, failing to take user reporting needs into account, and not coordinating the model with business requirements are common mistakes.
Ensuring effective dimensional data modeling involves avoiding common mistakes such as:
- Ignoring Business Requirements: Aligning the model with actual business needs.
- Overlooking Data Quality: Addressing data quality issues to prevent inaccurate analyses.
- Complex Hierarchies: Designing hierarchies with consideration for potential impacts on query performance.
- Inadequate Testing: Conducting thorough testing to identify and resolve issues.
- Ignoring Conformed Dimensions: Consistently using conformed dimensions to prevent inconsistencies.
56. What is the best way to manage quickly shifting dimensions in a dimensional data model?
Ans:
Quick changes in dimensions can be difficult. Methods include applying efficient dating or utilising Type 4 dimensions to keep a distinct table for historical modifications to record alterations over time.Adopting these strategies allows effective management of the challenges associated with quickly shifting dimensions in a dimensional data model.
Type 4: Temporal Snapshots: Employing temporal snapshots to capture changes at regular intervals.
Data Versioning: Implementing versioning mechanisms to handle rapidly changing data.
Efficient Indexing: Optimizing indexing to expedite queries on quickly changing dimensions.
Real-time Updates: Exploring real-time data integration for immediate updates.
57. What does a data mart do in relation to dimensional data modelling?
Ans:
A data mart is a region within a data warehouse dedicated to a particular topic or business domain. It gives users inside that business sector access to a more customised and useful subset of data.
Ensuring effective dimensional data modeling involves avoiding common mistakes such as:
Ignoring Business Requirements: Aligning the model with actual business needs.Overlooking Data Quality: Addressing data quality issues to prevent inaccurate analyses.Complex Hierarchies: Designing hierarchies with consideration for potential impacts on query performance.Inadequate Testing: Conducting thorough testing to identify and resolve issues.Ignoring Conformed Dimensions: Consistently using conformed dimensions to prevent inconsistencies.
58. In a dimensional data model, how are data lineage and traceability managed?
Ans:
Clear linkages between data sources, transformations, and the finished dimensional model can be established, and documentation and metadata management can help manage data lineage and traceability. In the intricate realm of a dimensional data model, meticulous management of data lineage and traceability is imperative. This is typically achieved through the establishment of comprehensive documentation and the utilization of metadata repositories. These repositories act as reservoirs of information, encapsulating details about the origin, transformation processes, and ultimate destinations of data within the data warehouse. By comprehensively documenting the journey of data, stakeholders gain a profound understanding of how data evolves and is manipulated throughout the entire data ecosystem.
59. What effect does denormalization have in a dimensional data model on query performance?
Ans:
Denormalization lowers the number of joins, which can enhance query performance. But it might boost data redundancy and storage specifications as well as the difficulty of upkeep. The strategic implementation of denormalization within a dimensional data model engenders a profound impact on query performance dynamics. Denormalization entails the duplication and storage of data in a manner that mitigates the need for intricate and resource-intensive join operations during queries. The overarching objective is to expedite the retrieval of information, thus optimizing query performance. However, it is crucial to recognize that this efficiency enhancement comes with the trade-off of increased storage requirements. Balancing the imperative for swift query responses with prudent storage management becomes paramount in this context.
60. Describe the idea of a dimension hierarchy and the reasons behind its significance in a data warehouse.
Ans:
A logical hierarchy of nested levels inside a dimension is represented by a dimension hierarchy. It is crucial for arranging data such that drill-down or roll-up analysis is simple and makes sense to end users. Within the expansive landscape of a data warehouse, the notion of a dimension hierarchy assumes paramount significance. A dimension hierarchy represents a structured organization of data in a hierarchical fashion, introducing layers of granularity and categorization. Consider, for instance, a time dimension that may feature hierarchies such as year, quarter, month, and day. The intrinsic value of dimension hierarchies lies in their ability to facilitate drill-down and roll-up operations, empowering users to navigate and analyze data at varying levels of granularity with consummate ease.
61. In a dispersed data environment, what function does a conformed dimension serve?
Ans:
A conformed dimension in a distributed data environment ensures that dimension properties are compatible and consistent throughout various data sources and data warehouses, facilitating coherent reporting and analysis. In the intricate tapestry of a dispersed data environment, a conformed dimension emerges as a linchpin for ensuring data consistency and coherence across diverse data marts or data warehouses. Essentially, a conformed dimension serves as a standardized reference point, ensuring that the definition and usage of dimensions remain uniform and consistent irrespective of the specific data repository. This standardization is pivotal for fostering accurate and meaningful cross-functional analysis, thereby promoting a cohesive analytical framework across the organizational spectrum.
62. Describe the idea of a bridge table and how it is used in gradually changing proportions.
Ans:
Bridge tables are used to manage many-to-many relationships in gradually altering dimensions. Its use of keys from the dimension table and a related attribute enables accurate depiction of connection changes over time. The utilization of a bridge table comes to the fore in the context of managing gradually changing dimensions within a data warehouse. As dimensions evolve over time, especially in scenarios where historical changes need to be tracked, a bridge table plays a pivotal role. This table acts as a link between the surrogate keys of the dimension and the associated fact table, facilitating the tracking of changes over time without necessitating alterations to the original dimension table. This nuanced approach to handling evolving dimensions ensures historical accuracy and integrity in analytical processes.
63. What effect does a garbage dimension have on a data warehouse’s Extract, Transform, Load (ETL) procedure?
Ans:
A garbage dimension can simplify the ETL process by reducing the number of joins and complexity of combining flags and indicators to map modifications. In the intricate landscape of Extract, Transform, Load (ETL) procedures within a data warehouse, the presence of a garbage dimension can introduce unwarranted complexities. A garbage dimension, housing irrelevant or extraneous data, has the potential to complicate the ETL process. This complication arises from the unnecessary processing of data that does not contribute to the analytical objectives, leading to increased ETL times and resource utilization. Therefore, the judicious cleansing and filtering of irrelevant data, either prior to or during the ETL process, become imperative to maintain operational efficiency and streamline data processing workflows.
64. What factors need to be taken into account when creating a dimension model for an operational database that is heavily normalised?
Ans:
Choosing the right dimensions, establishing metrics, and figuring out how to denormalize the data for effective reporting without losing too much standardisation are all important factors to take into account in a highly normalised operational database. When tasked with creating a dimension model for an operational database characterized by heavy normalization, a nuanced approach is essential. While normalization minimizes redundancy and ensures data integrity, it may concurrently amplify the complexity of queries. Striking an optimal balance between normalization and denormalization becomes imperative, with careful consideration given to specific performance requirements and prevalent query patterns. The challenge lies in harmonizing the virtues of data integrity with the imperatives of query efficiency in a manner that aligns with the overarching goals of the operational database.
65. In a dimensional data model, how do you manage several currencies in a global company setting?
Ans:
Maintaining exchange rate tables, performing the proper conversions during reporting or as part of the ETL process, and implementing currency conversion factors are all necessary for managing numerous currencies and ensuring accurate analysis. Navigating the intricacies of managing multiple currencies within the framework of a dimensional data model necessitates the incorporation of a dedicated currency dimension. In this sophisticated arrangement, each fact record is intricately associated with a specific currency through a foreign key relationship with the currency dimension. This meticulous linkage allows for accurate conversion and reporting in diverse currencies, a critical prerequisite for global companies operating in varied markets. Effectively managing several currencies within a dimensional data model ensures the fidelity and relevance of financial analyses conducted in a global business setting.

Best Hands-on Practical Dimensional Data Modeling Course to Build Your Skills
Weekday / Weekend BatchesSee Batch Details66. Describe conformed cubes and their importance in multidimensional analysis.
Ans:
A multi-dimensional model that is consistent and interoperable across various warehouses or data marts. It enables users to conduct multi-dimensional analysis in a common manner regardless of the particular data source. The concept of conformed cubes assumes a pivotal role in the realm of multidimensional analysis within the data warehouse landscape. Conformed cubes represent standardized sets of dimensions and measures that exhibit consistency across multiple data marts or data warehouses. This adherence to standardized structures ensures seamless integration and analysis capabilities across disparate segments of the organization. The paramount importance of conformed cubes lies in their ability to provide a cohesive and uniform basis for multidimensional analysis, thereby fostering a holistic and integrated approach to decision-making across the organizational spectrum.
67. What constitutes a Type 4 dimension, and how is it different from previous kinds in the context of gradually shifting dimensions?
Ans:
In order to preserve both the present and historical values, a Type 4 dimension has a separate table for historical changes. This method provides a middle ground between historical tracking (Type 2) and simplicity (Type 1). Within the realm of gradually shifting dimensions in a data warehouse, the Type 4 dimension, often referred to as a “historical attribute” or “SCD4,” represents a distinctive approach. Diverging from its predecessors, notably Type 1 (overwrite) and Type 2 (add new row), the Type 4 dimension introduces a nuanced methodology. It involves the maintenance of a separate table specifically dedicated to recording historical changes to dimension attributes. Unlike previous methods, where historical changes might be overwritten or appended as new rows in the original dimension table, the Type 4 dimension preserves historical changes independently. This separation allows for the simultaneous storage and retrieval of both current and historical dimension attribute values, offering a comprehensive perspective for trend analysis over time.
68. In a dimensional data model, how do you ascertain a fact table’s degree of granularity?
Ans:
The business needs and the required amount of detail for analysis dictate the granularity of a fact table. It must be in line with the reporting requirements and key performance indicators (KPIs). The meticulous determination of a fact table’s degree of granularity constitutes a foundational aspect in the realm of dimensional data modeling. Granularity, in this context, pertains to the level of detail encapsulated within the fact table. To ascertain this granularity, one must identify the key dimensions and their corresponding attributes that collectively contribute to a unique combination of values in the fact table. The granularity level is essentially defined by the finest level of detail necessitated for analytical endeavors.
69. What is the function of gradually altering dimensions in a data warehouse to facilitate trend analysis?
Ans:
By capturing changes in dimension attributes over time, slowly changing dimensions help trend analysis by enabling users to examine past trends and patterns in the data. The integral function of gradually altering dimensions within a data warehouse lies in their capacity to capture and retain historical changes to dimension attributes over time. This nuanced functionality proves to be indispensable for facilitating trend analysis within the organizational data landscape. By diligently maintaining a historical record of changes, analysts are empowered to discern patterns, identify trends, and gain profound insights into the dynamic evolution of business data. This historical perspective not only enriches the analytical process but also serves as a strategic resource for making informed decisions based on past trends and predicting future developments.
70. Give an explanation of “drill-across” in relation to modelling dimensional data.
Ans:
The term “drill-across” describes the capacity to examine data from several data marts or fact tables. It entails merging data from several sources to present a more complete picture of the company. The concept of “drill-across” emerges as a sophisticated analytical capability within the domain of dimensional data modeling. Unlike traditional drill-down or drill-up operations that focus on navigating through a single dimension hierarchy, drill-across introduces a horizontal exploration of data across multiple dimensions simultaneously. This nuanced capability empowers users to traverse and analyze data in a more comprehensive manner, facilitating a holistic understanding of the intricate relationships and interactions between diverse dimensions.
71. How can a dimension model be created to account for seasonality in business data?
Ans:
By including properties like month, quarter, or season in the temporal dimension, seasonality can be addressed. Furthermore, to capture seasonal variations, particular dimensions associated with events or seasons can be incorporated. When endeavoring to account for seasonality in business data within a dimensional data model, a strategic approach involves the incorporation of a dedicated time dimension. This temporal dimension is intricately designed to encompass hierarchies such as year, quarter, month, and day. Furthermore, to encapsulate the nuances of seasonality, an additional attribute or factor can be introduced within the time dimension. This attribute effectively captures and correlates seasonal variations, allowing for the association of specific time periods with pertinent seasonality attributes. Such a dimension model not only facilitates the representation of seasonality in business data but also enriches the analytical capabilities for seasonal trend analysis.
72. In a dimensional data model, what is the purpose of a conformed hierarchy and how does it affect reporting?
Ans:
The uniformity of hierarchies’ representation throughout the firm is guaranteed by a conformed hierarchy. With its help, users can produce standardised reports that are predicated on dependable dimension frameworks. The inclusion of a conformed hierarchy in a dimensional data model serves as a linchpin for maintaining standardized and consistent hierarchical relationships across disparate data marts or data warehouses. In the context of reporting, conformed hierarchies play a transformative role. By adhering to standardized structures, reporting tools and queries gain the capability to seamlessly navigate and analyze data across various organizational segments.
73. How would you manage dimensions with a lot of hierarchy depth in a star schema?
Ans:
Dimensions having a high level of hierarchy depth can be managed by defining parent-child relationships within the dimension table or utilising snowflake structures to normalise the hierarchy. Navigating the complexities inherent in a star schema where dimensions exhibit considerable hierarchy depth necessitates a thoughtful and strategic approach. Optimal management involves deploying techniques such as pre-aggregation of summary data, strategic indexing, and judicious use of materialized views. Additionally, a prudent selection of the hierarchy detail required for most queries is essential. By leveraging appropriate indexing strategies and strategic data organization, one can enhance the efficiency of dimension management within a star schema, thereby ensuring streamlined and effective query performance.
74. Describe the meaning of a degenerate dimension and how transactional data is handled with it.
Ans:
A property in the fact table that isn’t connected to a different dimension table is called a degenerate dimension. By giving particular transactions more context, it is frequently utilized to handle transactional data. The concept of a degenerate dimension introduces a unique facet to dimensional data modeling, particularly concerning transactional data. This dimension is characterized by the absence of a corresponding dimension table; instead, the dimension attribute exists solely within the fact table. Typically manifesting as a transactional identifier or code, the degenerate dimension simplifies the data model by directly incorporating its value into the fact table. This streamlined approach expedites the storage and retrieval of transactional data, offering a pragmatic solution to handle dimension attributes that are inherently tied to individual transactions.
75. In what way is a dimensional data model for a real-time data warehouse designed?
Ans:
Reducing latency, utilising partitioning for effective updates, and integrating streaming data sources to guarantee timely data availability for analysis are all part of designing for a real-time data warehouse. Crafting a dimensional data model for a real-time data warehouse entails a meticulous consideration of the dynamic nature of data in near real-time scenarios. This design necessitates the integration of real-time data streams, agile Extract, Transform, Load (ETL) processes, and the adoption of in-memory databases to expedite query performance. The design must be attuned to the evolving nature of real-time data, ensuring that the system can capture, process, and deliver insights with minimal latency. Paramount considerations include data freshness, latency mitigation strategies, and concurrency management, all converging to create a robust and responsive dimensional data model for the demands of a real-time data warehouse environment.
76. What does a dimensional data model’s conforming granularity serve as?
Ans:
Conformed granularity permits users to conduct consistent analysis and reporting by guaranteeing that dimensions and metrics are defined uniformly throughout the business. Within the intricate landscape of a dimensional data model, the concept of conforming granularity emerges as a linchpin for maintaining a harmonious and standardized data structure. It serves as the bedrock for consistency and coherence across diverse components within the model. In essence, conforming granularity denotes the uniformity in the level of detail maintained across dimensions and fact tables, ensuring a seamless integration of data elements. This adherence to a standardized granularity level is paramount, as it fosters a cohesive analytical environment, facilitating accurate reporting and meaningful multidimensional analysis.
77. Describe the idea of a bridge table and how a dimensional model uses it to handle temporal data
Ans:
When managing many-to-many relationships, a bridge table can be especially beneficial for displaying temporal data while working with relationships that change throughout time. A cornerstone in the arsenal of a dimensional data model, the bridge table assumes a pivotal role in the adept handling of temporal data. Particularly in situations where historical changes need to be meticulously tracked, the bridge table serves as an intermediary mechanism, facilitating a nuanced representation of time-dependent attributes. This intermediary table establishes crucial relationships between the dimension table and the associated fact table. By encapsulating temporal changes and their corresponding surrogate keys, the bridge table empowers the model to navigate the intricacies of temporal data without necessitating direct alterations to the primary dimension table.
78. How might gradually altering dimensions be used in situations where past data is essential for auditing or compliance?
Ans:
Type 2 slowly changing dimensions are commonly employed in compliance or auditing contexts to uphold a historical record of modifications, guaranteeing responsibility and traceability. The utilization of gradually altering dimensions unfolds as a strategic imperative in scenarios where the preservation of historical correctness holds utmost importance. This is particularly evident in contexts such as auditing or compliance, where a meticulous record of historical changes is not just advantageous but often mandated. The nuanced approach of gradually altering dimensions allows for the preservation of a comprehensive historical record, a chronicle of changes that is indispensable for audit trails and compliance checks.
79. How does adding indexing affect a fact table’s functionality in a dimensional data model?
Ans:
Because indexing makes it easier to access particular rows in the fact database more quickly, it can greatly increase query performance. It does, however, come with a price: higher storage needs and possible overhead during data upgrades. The introduction of indexing into the realm of a fact table within a dimensional data model represents a transformative element that significantly influences its functionality. Indexing, as a mechanism, bestows upon the fact table an enhanced capability to expedite data retrieval operations. By strategically organizing and structuring the data, indexes facilitate swift access to specific rows or subsets, thereby mitigating the time required for executing analytical queries. However, this enhancement is not devoid of considerations, as the strategic deployment of indexing necessitates a judicious balance. Excessive indexing may incur heightened storage requirements and potentially impact the efficiency of data loading processes.
80. Describe the idea of a fact constellation and the circumstances in which it could be chosen over a star schema.
Ans:
Many fact tables that share dimension tables are part of a fact constellation. When working with many business processes that are too complex for a single fact table to fully describe, it could be chosen over a star schema. The architectural choices within a dimensional data model present a dichotomy between the traditional star schema and the more intricate fact constellation. Unlike the star schema’s centralized approach, wherein a single fact table is surrounded by dimension tables, the fact constellation introduces a more complex network. This schema involves the interconnection of multiple fact tables, sharing common dimensions and relationships. The adoption of a fact constellation over a star schema becomes pertinent in scenarios marked by intricate relationships and shared dimensions among different fact tables.
81. When handling dimensions whose properties change gradually, how do you manage situations when historical correctness is critical?
Ans:
Type 2 dimensions can be used to handle slowly changing attributes, guaranteeing that past changes are recorded by keeping historical values and generating new records for each change. Managing dimensions undergoing gradual changes, especially when historical correctness is of paramount importance, requires a nuanced strategy. This involves the incorporation of techniques such as versioning or effective dating, wherein each dimension record is associated with a specific validity period. As changes unfold over time, new records are seamlessly introduced, and existing ones are meticulously updated to reflect the relevant time frames. This meticulous management of changes, aligned with temporal intervals, ensures the historical correctness of the dimensional data model.
82. How does aggregate navigation help a dimensional data model optimize query performance?
Ans:
When feasible, aggregate navigation routes queries to pre-aggregated data in order to minimise complex computations and enhance query efficiency, especially in situations involving huge datasets. A pivotal strategy in the pursuit of optimizing query performance within a dimensional data model is the judicious deployment of aggregate navigation. This approach entails the creation and utilization of pre-aggregated data structures or summary tables. By strategically aggregating and storing precomputed results for frequently queried measures, aggregate navigation emerges as a formidable tool in reducing the computational overhead during query execution. The result is a significant enhancement in response times and a more efficient allocation of resources. This deliberate optimization mechanism transforms the landscape of analytical queries within the data warehouse, bolstering overall performance and responsiveness.
83. In the context of multidimensional analysis, define “drill-through”.
Ans:
From a summarised view, drill-through gives viewers access to detailed, underlying data. To get more specific information, one must navigate from aggregated data to the detailed data source. In the expansive realm of multidimensional analysis, the concept of “drill-through” assumes a position of prominence as an analytical capability. Unlike traditional drill-down or drill-up operations that navigate within a single dimension hierarchy, drill-through introduces a horizontal exploration across multiple dimensions. The essence of drill-through lies in the ability to access detailed or granular data that underlies summary or aggregated information. It represents a seamless transition from a higher level of abstraction to a more detailed level, often traversing from aggregated data to the underlying transactional or source-level details.
84. What are the possible problems when dealing with high cardinality dimension tables?
Ans:
The intricate challenges posed by high cardinality dimension tables within a dimensional data model revolve around the sheer volume of distinct values in one or more attributes. This heightened cardinality brings forth a cascade of implications, including increased storage requirements, prolonged query response times, and potential performance bottlenecks. Effectively addressing these challenges demands a strategic approach, encompassing the implementation of techniques such as indexing, partitioning, and selective denormalization. The delicate balance between optimizing query performance and managing storage efficiency becomes paramount when contending with dimensions characterized by high cardinality.
85. How do you make sure that naming standards for dimensions and measures are consistent in a data warehouse that houses several subject areas?
Ans:
Data governance procedures, documentation, and the application of defined naming conventions for dimensions, metrics, and hierarchies all contribute to the maintenance of name convention consistency. The pursuit of consistent naming standards for dimensions and measures within a data warehouse, particularly one housing several subject areas, necessitates a comprehensive and steadfast approach. This involves the establishment of a well-documented naming convention, serving as the guiding framework for naming practices. Regular communication and training initiatives reinforce the significance of adhering to these standards, fostering a collective understanding across the data modeling and development teams.
86. What is the function of a role-playing dimension and how is it different from assigning distinct roles to different dimensions?
Ans:
In a single fact table, a role-playing dimension serves several functions, each with a distinct role. By eliminating redundancy and guaranteeing a single source of truth for dimension data, it varies from employing distinct dimensions. Within the intricate tapestry of a dimensional data model, the concept of a role-playing dimension introduces a layer of versatility and efficiency. This entails a dimension table assuming different roles within the same model, providing a compact and reusable representation. For instance, a date dimension might seamlessly transition between roles like “Order Date” and “Ship Date.” This approach contrasts with the alternative
87. When creating a dimensional data model for sources of unstructured or semi-structured data, how do you go about it?
Ans:
In order to account for the variety in data structures, designing for unstructured or semi-structured data entails establishing appropriate dimensions, extracting pertinent features, and implementing strategies like schema-on-read. The strategic development of a dimensional data model to accommodate unstructured or semi-structured data requires a meticulous and comprehensive approach. It commences with a thorough evaluation of the structural characteristics inherent in unstructured data, followed by a transformative preprocessing and transformation phase to mold the data into a format compatible with the structured framework of a dimensional model. Sophisticated techniques such as entity extraction, text analysis, and categorization are instrumental in bringing structure to what was previously unstructured.
88. What part do surrogate keys play in a dimensional data model’s data integrity?
Ans:
Surrogate keys are essential for maintaining data integrity since they give dimension tables a reliable and distinct identification. Even in the event that natural keys change, they allow for constant linkages between fact and dimension tables. Surrogate keys play a pivotal role in maintaining the robustness of data integrity within a dimensional data model. Distinct from natural keys, surrogate keys are systematically generated to provide a unique identifier for each dimension record. The paramount significance of surrogate keys lies in their ability to shield the data model from the inherent fluctuations in natural keys or source systems, thereby ensuring stability and consistency. By furnishing a dependable reference point, surrogate keys enhance data integrity and facilitate seamless joins between dimension and fact tables.
89. Describe the idea of a factless fact table and give an instance of when it could be applied.
Ans:
A factless fact table depicts the relationships between dimensions but does not include any measurements. A fact table on classroom scheduling that tracks student enrollment, teacher assignments, and space allocation without the use of particular numerical metrics serves as an example.
The intriguing concept of a factless fact table introduces a distinctive dimension to dimensional data modeling, wherein the table eschews measurable numeric facts to focus on capturing relationships between dimensions. An illustrative example of its application unfolds in scenarios centered around event tracking or occurrences within a university setting. Envision a factless fact table documenting student enrollments, featuring foreign keys that reference dimensions like time, student, and course.
90. How do you construct a dimension model to facilitate time-based analysis for cases where time is a critical dimension?
Ans:
Creating a robust time dimension with granular features, adding date hierarchies, and even utilising specialised methodologies for addressing irregular time intervals or corporate calendars are all part of designing for time-based research. The meticulous construction of a dimension model tailored for time-based analysis, especially when time serves as a critical dimension, demands a holistic and thoughtful approach. Central to this strategy is the creation of a dedicated time dimension featuring hierarchies encompassing year, quarter, month, and day.
Further augmentation may involve the incorporation of additional attributes such as fiscal periods or holidays to enhance the granularity of time-based analysis. The primary objective is to structure the time dimension in a manner that facilitates drill-down and roll-up operations, providing users with the capability to analyze data at varying levels of temporal granularity.
91. How do degenerate dimensions in a dimensional data model matter?
Ans:
Degenerate dimensions are attributes contained in the fact table that do not necessitate a separate dimension table. They improve the granularity of analysis by offering more context for certain transactions. The incorporation of degenerate dimensions within a dimensional data model represents a pragmatic solution aimed at streamlining the data structure, particularly in scenarios where dimension attributes are intricately tied to individual transactions.
These dimensions, lacking a corresponding dimension table, incorporate transactional identifiers or codes directly into the fact table. The significance of degenerate dimensions becomes apparent in their ability to simplify the data model, expediting the storage and retrieval of transactional data.
92. What effect might gradually shifting dimensions have on an ETL process’s efficiency in a data warehouse?
Ans:
Because logic is needed to manage historical records, recognize changes, and update foreign keys in the fact table, slowly changing dimensions—especially those with history tracking, like Type 2—may make ETL operations more difficult. The inclusion of gradually shifting dimensions introduces a layer of complexity that significantly influences the efficiency of the Extract, Transform, Load (ETL) process within a data warehouse. In scenarios where historical changes need meticulous tracking, the ETL process must dynamically adapt to accommodate the capture and processing of these changes.
The intricacies stem from the necessity to identify and manage alterations in historical data, potentially leading to increased processing times and resource utilization. Striking a delicate balance between the imperative for historical accuracy and the efficiency of the ETL process becomes a critical consideration when dealing with gradually shifting dimensions.
93. Describe “drill-across” and give an example of a business situation where it would be useful.
Ans:
The advanced analytical capability encapsulated within the concept of “drill-across” emerges as an invaluable tool within dimensional data modeling. Its utility becomes particularly evident in dynamic business scenarios where a comprehensive exploration of data is essential across multiple dimensions simultaneously. An illustrative example of its application is discernible in the realm of retail analytics. Picture a scenario where a retail business aspires to analyze sales performance across various product categories and geographic regions concurrently. Leveraging the capabilities of drill-across, analysts can seamlessly navigate through dimensions such as product category and geographical location, gaining a comprehensive view of sales performance that transcends the constraints of a single dimension.