Last updated on 17th Nov 2021| 7263
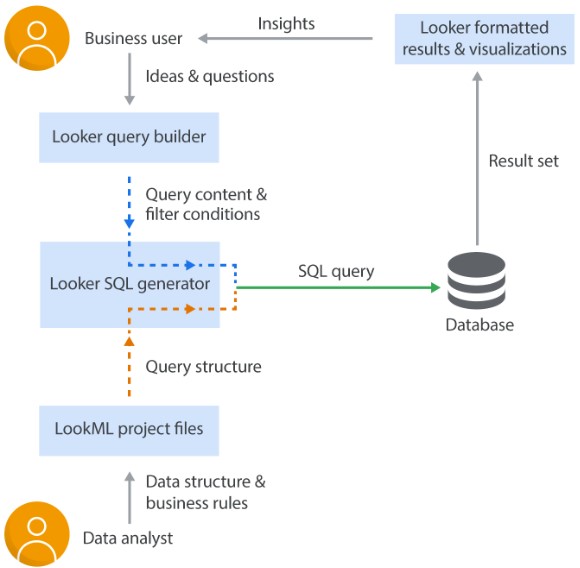
Looker is a business intelligence and data exploration platform that allows users to analyze and visualize data from various sources. It provides a user-friendly interface for creating and sharing reports, dashboards, and insights, making it easier for non-technical users to explore and understand complex datasets. Looker connects to databases, data warehouses, and other data sources, enabling organizations to make data-driven decisions by gaining valuable insights from their data.
1. What is Looker, and what is its primary purpose?
Ans:
Looker is a business intelligence and data exploration platform designed to help users analyze and visualize data from various sources, facilitating data-driven decision-making. Looker is a business intelligence and data exploration platform that helps organizations analyze and visualize their data. Its primary purpose is to enable users to create and share interactive reports, dashboards, and insights, allowing for better decision-making based on data-driven insights.
2. Explain the critical components of Looker.
Ans:
- LookML: A modelling language for defining data relationships.
- Explore: Saved query with associated dimensions and measures.
- Dashboard: Interactive view combining visualizations.
- Reports/Visualizations: Customizable data representations.
- Data Connection: Links to diverse data sources.
- Sharing/Collaboration: Shareable insights and scheduled reports.
- Embedding: Integration into external applications.
3. How does Looker use LookML?
Ans:
LookML is a language used by Looker to define data models and relationships. It allows users to describe the structure of their data, making it easier to explore and visualize. Looker uses LookML as a modelling language to define a database’s data structure and relationships. Users create LookML models to describe dimensions, measures, and calculations, providing a semantic layer on top of raw data. This abstraction allows non-technical users to explore and analyze data without writing SQL queries directly.
4. What types of data sources can Looker connect to?
Ans:
- Relational Databases: Such as MySQL, PostgreSQL, and Microsoft SQL Server.
- Big Data Technologies: Like Google BigQuery, Amazon Redshift, and Apache Spark.
- Data Warehouses: Including Snowflake, Teradata, and others.
- NoSQL Databases: Such as MongoDB and Cassandra.
- Web Services: Through APIs and direct connections to services like Salesforce.
- Flat Files: These include CSV, Excel, and other delimited files.
- Custom Data Sources: Using Looker’s API, users can define their data sources.
5. How does Looker support multi-language localization for reports and dashboards?
Ans:
Looker provides localization features, allowing users to create multilingual reports and dashboards by translating text and labels into different languages. Looker supports multi-language localization for reports and dashboards through localization files. These files allow you to translate text elements in your Looker instance, making it accessible in different languages. Looker provides a process for creating and managing these files, enabling you to customize the user interface for diverse language preferences.
6. How does Looker handle data security?
Ans:
- Access Controls: Role-based permissions limit user access.
- Data Encryption: Encrypts data in transit and at rest.
- SSO Integration: Integrates with Single Sign-On for secure authentication.
- Audit Trails: Maintains detailed logs for monitoring and accountability.
- Secure Data Connections: Establishes secure connections to data sources.
- Data Masking: Masks sensitive data to control visibility.
- IP Allowlisting: Enforces access restrictions through IP allow listing
7. What is Looker’s role in collaborative analytics?
Ans:
- Shared Exploration: Facilitates collaborative data exploration.
- Real-Time Collaboration: Enables real-time interaction on insights.
- Scheduled Reports: Automates and shares reports on a schedule.
- Embedding: Supports integration into other applications.
- Version Control: Ensures consistency in data modelling and analysis.
8. Explain the purpose of Looker Scheduler.
Ans:
Looker Scheduler automates the delivery of reports and dashboards at scheduled intervals, ensuring users receive up-to-date information without manual intervention. Looker Scheduler automates the delivery of reports and dashboards at scheduled intervals. It allows users to set up recurring deliveries of insights, ensuring that stakeholders receive updated information regularly without manual intervention. This feature enhances efficiency by providing timely and relevant data to teams, promoting informed decision-making based on the latest analytics.
9. How can Looker be integrated with other tools and platforms?
Ans:
Looker offers an API that allows integration with third-party tools and platforms, enabling seamless data flow and collaboration.
- APIs: Utilize RESTful APIs for third-party integration.
- Embedding: Embed data visualizations directly into applications.
- Webhooks: Trigger external events based on Looker actions.
- Custom Actions: Define and execute actions in external systems.
- SQL Runner: Run custom SQL queries for integration.
10. What is the Looker Marketplace, and how can it benefit users?
Ans:
The Looker Marketplace is a platform where users can find and share custom applications, visualizations, and extensions, enhancing the functionality and features of Looker. The Looker Marketplace is a platform where users can find and share Looker Blocks, which are pre-built data models, reports, and dashboards. Users can leverage these Blocks to accelerate their analytics implementation, saving time and effort in building from scratch. It facilitates collaboration within the Looker community and offers a range of ready-made solutions for various industries and use cases. The Looker Marketplace enhances user productivity by providing a repository of reusable analytics assets.
11. What role does Looker Explorer play in the analytics process?
Ans:
Looker Explorer is the interface within Looker where users can build and interact with reports and dashboards, allowing them to explore and visualize data.
- Data Exploration: Allows users to analyze data interactively.
- Dimension/Measure Selection: Choose attributes and metrics for analysis.
- Filtering/Slicing: Focus on specific criteria for detailed analysis.
- Drill-Down Capability: Explore granular levels of data for deeper insights.
- Visualization Creation: Generate various visualizations and reports.
12. How does Looker support version control for LookML models?
Ans:
Looker integrates with version control systems like Git, enabling users to manage and track changes to LookML models, ensuring collaborative development and maintaining a history of modifications.
- Git Integration: Tracks changes, additions, and deletions in LookML files.
- Branching/Merging: Supports parallel development with branches and merging.
- Collaborative Development: Facilitates teamwork on LookML models.
- History/Rollback: Maintains version history for review and rollback.
13. Explain the concept of “Looks” in Looker.
Ans:
In Looker, a “Look” refers to a saved query or report users can create and share. It captures the specific data analysis and visualization settings for easy replication.n Looker, a “Look” refers to a saved query or a specific visualization of data created by a user. It includes selected dimensions, measures, filters, and visualizations configured within the Looker Explorer. “Looks” provide a way to save and share specific data views or analyses, enabling users to quickly revisit and distribute valuable insights efficiently. They are an integral part of Looker’s functionality for organizing and sharing customized data perspectives within an organization.
14. What is the significance of caching in Looker, and how does it enhance performance?
Ans:
Looker uses caching to store and retrieve results from previous queries, improving performance by reducing the need to recompute data for commonly accessed reports.
- Faster Response Times: Caching results in quicker data access.
- Reduced Database Load: Lowers strain on the underlying database.
- Improved User Experience: Enhances the overall analytics experience.
- Efficient Resource Utilization: Optimizes computing resource usage.
15. What role do Looker’s alerting and scheduling features play in proactive monitoring?
Ans:
Looker’s alerting and scheduling features allow users to set up automated alerts based on specific conditions, enabling proactive monitoring of critical metrics. This allows timely notifications when key metrics deviate, enabling teams to identify and address potential issues. Scheduling ensures regular reports, promoting a proactive data analysis and decision-making approach.
16. Describe the process of embedding Looker content into external applications.
Ans:
- Create Embedding User: Generate API credentials for embedding.
- Configure Embed URL: Use Looker’s embedding API to specify content and parameters.
- Implement Authentication: Ensure secure access for embedding users.
- Integrate Embed URL: Embed into the external app using iframe or other methods.
- Customization: Adjust appearance and behavior with Looker’s embedding API options.
17. What is the difference between a “Dimension” and a “Measure” in Looker?
Ans:
18. How does Looker handle data exploration on large datasets?
Ans:
Looker optimizes data exploration on large datasets through database-specific optimizations, query caching, and parallel processing to ensure efficient analysis.
- SQL Optimization: Optimizes queries for large datasets.
- Incremental Loading: Fetches only new or modified data.
- Caching: Stores results of frequently used queries.
- Aggregation Awareness: Automatically uses aggregations for efficiency.
- Derived Tables: Precomputed aggregations optimize complex queries
19. Can Looker be deployed on-premises or as a cloud-only solution?
Ans:
Looker provides a cloud-based solution where the platform is hosted and managed by Looker in the cloud. Alternatively, Looker can be deployed on-premises, allowing organizations to host and manage the Looker platform within their own infrastructure.
20. What role does Looker’s Data Dictionary play in the analytics workflow?
Ans:
Looker’s Data Dictionary serves as a central repository for metadata and documentation, helping users understand and document the structure and meaning of their data.
- Documentation Hub: Centralized repository for metadata.
- Data Understanding: Clarifies meaning and context of data elements.
- Consistency: Promotes standardized reference for all users.
- Collaboration: Facilitates collaboration among data teams.
21. How does Looker handle data transformation and cleaning processes?
Ans:
Looker focuses on providing a clean and transformed view of data through LookML modelling. Data cleaning and transformation can be done in the LookML code.
- LookML Transformations: Define transformations in LookML.
- Custom Dimensions/Measures: Create custom fields for data cleanup.
- SQL Runner: Execute custom SQL queries for advanced cleaning.
- ETL Integration: Integrates seamlessly with various ETL tools.
22. Explain the purpose of “Explore” in Looker and how it aids data exploration.
Ans:
An “Explore” in Looker is a curated view of the data that simplifies exploration. It defines the starting point for users to build queries and generate reports.
- Focused Data View: Explore provides a predefined view of specific data.
- Selected Fields: Includes relevant dimensions and measures.
- Filters: Users can apply filters to narrow down the dataset.
- Visualizations: Offers varied visualization options.
- Interactive Queries: Enables interactive query building for data exploration.
23. What is the Looker Block Library, and how can it benefit users?
Ans:
The Looker Block Library is a collection of pre-built templates, data models, and visualizations that users can leverage to accelerate their analytics implementation. Looker Block Library is a collection of pre-built data models and visualizations designed to address specific business needs. Users can leverage these blocks to implement analytics solutions quickly without extensive coding. It benefits users by saving time, providing a starting point for analysis, and ensuring consistency in data interpretation across an organization.
24. How does Looker handle scheduled data maintenance and updates?
Ans:
Looker Scheduler automates data updates by refreshing queries at specified intervals, ensuring that reports and dashboards reflect the latest data. Looker typically relies on the underlying database’s scheduling capabilities for data maintenance and updates. Users can schedule data refreshes using database jobs or Looker’s Scheduler at specified intervals. This ensures that the data presented in Looker remains up-to-date, reflecting changes in the source database.
25. What role does Looker’s API play in extending its functionality?
Ans:
Looker’s API (Application Programming Interface) allows developers to extend and customize Looker’s functionality. It enables integration with other tools, automates tasks, and creates custom applications. Through the API, users can programmatically interact with Looker by accessing and manipulating data, running queries, or embedding Looker content into external applications. This flexibility makes it easier to tailor Looker to business needs and workflows.
26. Can Looker be used for real-time analytics, and if so, how?
Ans:
Looker can support real-time analytics by connecting to data sources that provide real-time data and by utilizing features like live query and streaming datasets. Looker is primarily designed for batch-oriented analytics but offers some capabilities for near-real-time analytics. Looker can connect to real-time data sources, and with the use of Looker’s Persistent Derived Tables (PDTs), users can create tables that refresh at shorter intervals, providing more frequent updates.
27. How does Looker handle data governance and ensure data quality?
Ans:
Looker supports data governance through user permissions, access controls, and the ability to centralize metadata and documentation in the Data Dictionary. Looker incorporates several features to help data governance and ensure data quality. It allows for creating centralized data models, ensuring consistency in definitions and metrics across the organization. Looker also provides access controls and permissions, allowing administrators to manage who can access and modify specific data.
28. What are some of the popular visualization options available in Looker?
Ans:
- Charts
- Tables
- Maps
- Dashboards
- Funnel Charts
- Treemaps
- Heatmaps
- Scatter Plots
29. Explain the concept of “Derived Tables” in Looker.
Ans:
Derived Tables in Looker are tables created during the data modelling, allowing users to define custom calculations, filters, and aggregations for more advanced analytics. Derived Tables in Looker are custom tables created within LookML (Looker Modeling Language) that derive their data from SQL queries. These tables are defined in LookML and can be based on existing or derived tables. Derived Tables enable users to preprocess and transform data before visualization, allowing for complex calculations, aggregations, or filtering.
30. How can Looker aid in ad-hoc analysis, and what features support this functionality?
Ans:
Looker’s intuitive interface and interactive dashboards support ad-hoc analysis, allowing users to explore and analyze data on the fly. Features like filters and pivots enhance this capability.
- Explore Section: Interactive querying without extensive SQL knowledge.
- Drill Everywhere: Dive into specific data points for detailed analysis.
- Persistent Derived Tables (PDTs): Pre-aggregated tables for improved performance.
- LookML: Define custom dimensions and measures for ad-hoc calculations.
31. What is the role of caching in Looker, and how does it impact performance?
Ans:
Caching in Looker involves storing query results for reuse, reducing the need to rerun queries. This enhances performance by delivering faster response times for frequently accessed data. In Looker, caching plays a crucial role in optimizing query performance. Looker uses caching to store and reuse the results of queries, reducing the need to recompute the same data repeatedly.
32. How does Looker handle data modelling for time-based analysis?
Ans:
Looker supports time-based analysis through features like timeframes, time-based dimensions, and unique date functions, enabling users to analyze data trends over specific periods. Looker, a business intelligence platform, handles time-based analysis through data modelling features. To facilitate temporal analysis, it allows users to create time dimensions, such as day, week, or month. LookML, Looker’s modelling language, supports time-based calculations and filtering, enabling users to build reports and dashboards that consider time-related aspects in their data.
33. Explain the “Persistent Derived Tables” (PDTs) concept in Looker.
Ans:
PDTs are tables in Looker that persistently store the results of complex queries. They help improve performance when dealing with computationally expensive calculations. Persistent Derived Tables (PDTs) in Looker are precomputed tables that store the results of a SQL query. Unlike traditional derived tables computed on the fly when a query is executed, PDTs are saved in the database and updated regularly, ensuring quicker query response times.
34. What is the significance of “Data Actions” in Looker?
Ans:
Data Actions in Looker allow users to take specific actions based on insights, such as creating tasks, sending emails, or triggering workflows directly from the Looker interface. Data Actions” in Looker are a feature that allows users to take direct actions based on insights gained from their data visualizations or reports. These actions can be customized and integrated into the Looker interface, enabling users to interact directly with external systems, applications, or processes from Looker.
35. Explain Looker’s data exploration capabilities.
Ans:
- Create Explores: Define specific views of data with dimensions and measures.
- Drag-and-Drop Interface: Build reports and dashboards through an intuitive drag-and-drop interface.
- Filtering and Slicing: Easily filter and slice data to focus on specific subsets.
- Drill-down: Explore more profound levels of data by drilling down into dimensions.
- Collaborative Exploration: Share and collaborate on explorers, dashboards, and reports.
- Data Visualization: Utilize various chart types for effective data representation.
- SQL Runner: Users can write custom SQL queries for more advanced analysis.
- Version Control: Looker’s version control ensures consistency and traceability in data exploration.
36. Can Looker handle data from unstructured sources, and if so, how?
Ans:
Looker is primarily designed for structured data but can integrate with tools that preprocess unstructured data or leverage SQL queries to structure data for analysis. Looker primarily works with structured data sources, and its strength lies in analyzing and visualizing structured datasets. While it may not directly handle unstructured data, you can preprocess it externally and integrate it into Looker through connectors or transformations. Utilizing tools like ETL (Extract, Transform, Load) processes or data preprocessing tools allows you to structure the unstructured data before bringing it into Looker for analysis and reporting.
37. What role does the Looker Marketplace play in extending functionality?
Ans:
The Looker Marketplace offers a hub for users to discover and install custom applications, visualizations, and integrations, expanding Looker’s capabilities. The Looker Marketplace serves as a hub for extensions and customizations, allowing users to enhance and extend Looker’s functionality. It provides a platform to find and share custom applications, visualizations, and data blocks.
38. How does Looker address scalability concerns as the volume of data grows?
Ans:
Looker supports scalability by leveraging underlying database optimizations, utilizing in-database processing, and providing options for distributed data storage. Looker addresses scalability concerns as data volumes grow through a combination of features and best practices. It employs a scalable architecture that supports distributed processing and efficient query optimization. Additionally, Looker recommends strategies such as data partitioning, caching, and performance tuning to optimize query performance.
39. What authentication and authorization options does Looker offer for user access control?
Ans:
Looker supports various authentication methods, including Single Sign-On (SSO) and multi-factor authentication, and provides granular authorization controls to manage user access. Looker provides multiple authentication and authorization options for user access control. Authentication options include LDAP, SAML, Google Apps, and OAuth, allowing users to log in using their existing credentials. Authorization is managed through role-based access control (RBAC), allowing administrators to define roles with specific permissions for data and functionality within Looker.
40. How does Looker handle data lineage and tracking changes in data sources?
Ans:
Looker allows users to document data lineage in LookML, and it provides tools for tracking changes in data sources, ensuring transparency and data governance. Looker facilitates data lineage and change monitoring through its “Data Dictionary” feature. The Data Dictionary provides a centralized repository to document and understand your data model. It helps track field changes and explore settings and relationships between different data elements.
41. Explain the process of creating custom calculations and metrics in Looker.
Ans:
- Access LookML: Go to Looker’s development mode.
- Define Field: Use measure or dimension in LookML.
- Write Calculations: Use LookML syntax for calculations, e.g., sql: ${order_items.amount}.
- Apply Formatting: Use parameters like format for desired output.
- Test: Save changes and test metrics in Looker.
- Explore Further: Refer to Looker’s documentation for advanced options.
42. How does Looker handle data permissions and access control for different user roles?
Ans:
Looker provides:
- A role-based access control system.
- Allowing administrators to define permissions for different user roles.
- Ensuring secure and controlled access to data.
Looker, a business intelligence platform, manages data permissions and access control through a robust system. It utilizes a model-view-controller (MVC) architecture, allowing users to create data models (explores), define views, and control access through roles and permissions. LookML, Looker’s modelling language, facilitates this process by abstracting the underlying SQL queries.
43. What is the Looker Action Hub, and how can it enhance workflow integrations?
Ans:
The Looker Action Hub is a platform for creating and sharing integrations with other applications, streamlining workflows by enabling data-driven actions based on Looker insights. The Looker Action Hub is a platform that allows Looker users to integrate data-driven workflows with other business tools seamlessly. It enhances workflow integrations by providing a central hub for connecting Looker data to external actions and applications, enabling users to automate processes and make data-driven decisions more efficiently.
44. Can Looker be used for forecasting and predictive analytics? If so, how?
Ans:
Looker is a predictive analytics tool that can be integrated with external tools to generate predictive models and forecasts based on historical data. This allows businesses to make data-driven predictions and optimize decision-making processes, providing insights into future trends and outcomes.
45. Explain the “Persistent Derived Tables” (PDTs) concept in Looker.
Ans:
PDTs in Looker are tables that persistently store the results of complex queries, offering performance benefits by avoiding the need to rerun computationally expensive calculations. Persistent Derived Tables (PDTs) in Looker store the results of a SQL query in a database. Unlike standard derived tables recreated each time a query runs, PDTs persist in the database, allowing for more efficient data processing and improved query performance.
46. How does Looker handle data sources with different types and formats?
Ans:
Looker provides flexibility by supporting various data types and formats, and it allows users to define appropriate data transformations in LookML to handle diverse data sources. Looker is designed to handle diverse data sources with different types and formats. It provides a flexible modelling layer that allows users to define relationships, transformations, and data types, enabling seamless integration of varied data.
47. How does Looker handle data modelling for complex datasets?
Ans:
LookML in Looker allows for creating flexible and intricate data models, enabling users to define relationships, calculations, and business logic for complex datasets.
- LookML Language: Defines relationships and transformations.
- Reusable Components: Creates consistency with dimensions and measures.
- Derived Tables: Optimizes performance with precomputed aggregations.
- SQL Runner: Executes custom SQL queries for flexibility.
- Join Logic: Allows the definition of complex multi-table relationships.
48. How does Looker facilitate collaboration between data analysts and business users?
Ans:
Looker is a platform that facilitates collaboration between data analysts and business users by offering a user-friendly interface. It allows analysts to create data models and share insights intuitively. This platform encourages a shared understanding of data, promoting effective communication and collaboration between technical and non-technical stakeholders.
49. Can Looker connect to live streaming data sources, and if so, what are the capabilities?
Ans:
Looker enables real-time dashboards and reports by connecting to live streaming data sources, allowing users to analyze and visualize data as it’s generated. This feature is useful for monitoring dynamic data like website traffic, social media mentions, and IoT device data, providing immediate insights for informed decision-making.
50. What are some considerations for optimizing Looker performance in a large-scale deployment?
Ans:
- Infrastructure Scaling: Ensure scalable hosting.
- Database Optimization: Optimize indexing and data models.
- Caching Strategies: Implement efficient caching.
- Looker Configuration: Fine-tune settings for performance.
- Query Optimization: Optimize queries and minimize joins.
- Content Organization: Organize LookML models wisely.

Best Looker Certification Course with Advanced Concepts from Real Time Experts
Weekday / Weekend BatchesSee Batch Details51. How does Looker handle data versioning, especially when there are changes in underlying databases?
Ans:
Looker integrates with Git, enabling users to track and maintain version history of LookML models. However, it doesn’t automatically offer data versioning capabilities. Users must coordinate with their database version control systems for compatibility and consistency. Effective documentation and communication between data teams and Looker users are crucial for versioning.
52. What role does the Looker Scheduler play in managing report delivery schedules?
Ans:
Looker Scheduler automates the delivery of reports by allowing users to schedule when reports and dashboards should be refreshed and distributed to stakeholders. The Looker Scheduler is a component in Looker that allows users to organise and automate the delivery of reports. It enables users to set up specific schedules for running reports and delivering them to specified recipients. This functionality benefits organizations requiring regular data insights updates without manual intervention.
53. Can Looker handle data from cloud-based data warehouses, and if so, which ones are supported?
Ans:
Yes, Looker supports integration with various cloud-based data warehouses. Some of the commonly supported ones include:
- Google BigQuery
- Amazon Redshift
- Snowflake
- Microsoft Azure Synapse Analytics (formerly known as Azure SQL Data Warehouse)
54. How does Looker support data drilling and exploration for deeper insights?
Ans:
Looker is a data exploration tool that allows users to drill down into detailed data points, enabling them to access high-level summaries and detailed information. It uses interactive dashboards and features, allowing users to explore data hierarchies, apply filters, and gain deeper insights through visualizations, making it a user-friendly interface for complex dataset analysis.
55. Explain Looker’s approach to data modelling for multidimensional analysis.
Ans:
Looker supports multidimensional analysis by creating explore-based dimensions and measures, allowing users to analyze data across multiple dimensions for richer insights. Looker employs a modelling language called LookML for multifaceted analysis. LookML enables the creation of abstracted, reusable data models that define relationships and dimensions within the dataset. By utilizing LookML, Looker separates the data modelling layer from the visualization layer, promoting consistency and reusability.
56. What is the significance of Looker Blocks, and how can they expedite report development?
Ans:
Looker Blocks are pre-built templates that expedite report development by providing a starting point for everyday use cases, saving time and effort in creating specific analyses. Looker Blocks are pre-built, customizable templates or components that expedite report development by providing a foundation for common analytics use cases. These blocks encapsulate best practices, data models, and visualizations for specific industries or functions. Using Looker Blocks, developers and analysts can accelerate the creation of reports, dashboards, and analytics applications.
57. How does Looker handle data security compliance, especially in regulated industries?
Ans:
Looker is a business intelligence platform that focuses on data security and compliance in regulated industries. It offers features like role-based access control, encryption, audit trails, and authentication methods. It integrates with identity providers and allows administrators to manage permissions. Looker also provides data governance and monitoring tools.
58. Can Looker integrate with business intelligence tools other than its native visualizations?
Ans:
- Looker is designed to integrate with various business intelligence tools beyond its native visualizations.
- It provides flexibility by supporting connections to different data sources, and you can export data to multiple formats like CSV or Excel.
- Looker also offers APIs, enabling integration with other BI tools, dashboards, or applications in your business intelligence ecosystem.
- This allows you to leverage Looker’s data modelling and exploration capabilities while integrating seamlessly with other tools that suit your specific needs.
- Always check Looker’s documentation for the most accurate and current information on integrations.
59. What role does Looker’s Explores API play in customizing and extending Looker functionality?
Ans:
Looker’s Explores API allows developers to customize and extend Looker functionality by programmatically interacting with data and creating tailored experiences. Looker’s Explores API is crucial in customizing and extending Looker functionality by providing a programmatic way to interact with and manipulate Looker Explores. This API allows developers to dynamically create, modify, and run Looks (saved queries).
60. How does Looker handle data partitioning and segmentation for improved query performance?
Ans:
Looker supports data partitioning strategies, allowing users to optimize query performance by efficiently querying specific partitions of data relevant to their analysis. Looker employs “persistent derived tables” (PDTs) to handle data partitioning and segmentation, enhancing query performance. PDTs are pre-aggregated tables that store the results of complex queries, reducing the need to recalculate them during user queries. This is particularly useful for scenarios involving large datasets or complicated computations.
61. How does Looker handle data sources with different time zones, and what considerations are essential for accurate reporting?
Ans:
Looker allows users to set time zone contexts for analyses, ensuring accurate reporting across different geographical regions. It handles time zones at both user and data model levels. Consistent data source formatting with accurate time zone information is crucial. Use Looker’s date functions for time zone conversions and regularly verify and update information to avoid discrepancies.
62. Explain the role of user attributes in Looker and how they can be utilized.
Ans:
Looker’s user attributes enable personalized analytics by allowing users to define custom attributes that influence data access and calculations. These attributes can be based on user roles, permissions, or other criteria, allowing for dynamic filters or calculations. This customization enhances user engagement and ensures relevant information is displayed based on individual roles or preferences.
63. What is Looker’s approach to handling data outliers and anomalies in analyses?
Ans:
- Looker provides features like filters and outlier detection functions in LookML to help users identify and handle data outliers during analysis.
- Looker provides flexibility in addressing data outliers and anomalies by offering various analytical tools.
- Users can use filters, aggregations, and transformations to manage outliers within LookML, Looker’s modelling language.
- Looker’s Explore interface allows users to identify outliers and outliers and apply filters visually.
64. Can Looker be used for geospatial analysis, and if so, what capabilities does it offer?
Ans:
Yes, Looker supports geospatial analysis through its integration with geographical data. Looker can visualize and analyze geospatial data using maps, allowing you to gain insights based on location. Looker supports geographical data formats, such as GeoJSON and Well-Known Text (WKT). Looker supports geospatial analysis by allowing users to visualize and analyze data on maps, incorporating location-based insights into their reports and dashboards.
65. How does Looker assist in tracking key performance indicators (KPIs) and setting up performance alerts?
Ans:
Looker facilitates KPI tracking by allowing users to create custom metrics and set up alerts based on specific thresholds, ensuring proactive monitoring of performance metrics. Looker facilitates tracking key performance indicators (KPIs) by allowing users to define and monitor metrics within the platform. Users can create dashboards and reports that display relevant KPIs, providing a centralized view of performance metrics.
66. What measures does Looker take to ensure data accuracy and consistency across different reporting instances?
Ans:
Looker emphasizes data accuracy through its modelling layer, LookML, which promotes consistency in calculations and definitions across various reports and dashboards. Looker promotes data accuracy and consistency using a centralized data model defined in LookML, its modelling language. This ensures a single source of truth for your data definitions and calculations, reducing the risk of inconsistencies across reporting instances.
67. Explain the role of “Datagroups” in Looker and how they contribute to data governance.
Ans:
Datagroups in Looker help manage data access and permissions by grouping related tables, simplifying the administration of data governance policies. Datagroups” in Looker are logical groupings of data tables that share similar refresh and caching settings. They contribute to data governance by providing a structured way to manage data access and updates.
68. How does Looker handle query optimization, especially when dealing with complex SQL queries?
Ans:
Looker employs query optimization techniques, including SQL optimization and leveraging underlying database capabilities, to enhance performance for complex queries. Looker uses a multi-step approach for query optimization. It starts by translating LookML (Looker’s modelling language) into SQL. Then, Looker’s query optimization engine analyzes and rewrites the SQL to enhance performance. It considers database dialect, table size, and joins to generate efficient queries. Additionally, Looker caches results when possible, reducing the need for redundant queries and improving overall performance.
69. Can Looker be used for cohort analysis, and what features support this type of analysis?
Ans:
Looker is a versatile tool that can be used for cohort analysis, allowing users to define specific cohorts and track their behavior over time. Its features like time-based filtering, calculated fields, and custom dimensions enable effective segmentation and analysis. Looker’s flexibility in data exploration and visualization makes it an ideal choice for analyzing user retention and other critical metrics.
70. What are some best practices for Looker administration and maintenance in an enterprise setting?
Ans:
- Regular Backups: Schedule backups to prevent data loss.
- Version Updates: Keep Looker updated for new features and security.
- Monitoring: Use tools to track performance and set alerts.
- User Permissions: Manage roles for secure access.
- Performance Optimization: Optimize queries and consider caching.
- Content Organization: Organize content logically for easy navigation.
- Governance: Establish policies for data compliance.
- Documentation: Maintain detailed documentation for configurations.
- Collaboration: Encourage sharing insights and visualizations.

Enroll in Looker Training with Advanced Concepts
- Instructor-led Sessions
- Real-life Case Studies
- Assignments
71. How does Looker handle data lineage and impact analysis to understand data flow better?
Ans:
Looker provides data lineage information in LookML, allowing users to trace the origin and transformations of data, aiding in impact analysis and understanding data flow. Looker provides data lineage and impact analysis features to enhance understanding of data flow within your organization. It allows you to trace the origin of data and its transformations, helping you comprehend how data moves through different processes.
72. What options does Looker provide for data export and sharing outside the platform?
Ans:
Looker offers data export in CSV and Excel formats, allowing users to share reports and dashboards externally. It also provides multiple options for data export and sharing, integrates with cloud storage services like Google Drive and Amazon S3, supports scheduled data deliveries, and supports webhooks for automated sharing.
73. Explain the role of “Drill Fields” in Looker and how they contribute to detailed analysis.
Ans:
Looker’s “Drill Fields” feature allows users to create interactive drill-down experiences, allowing them to explore underlying data behind a visual element. By drilling into a field, Looker generates a new query focused on the selected field, allowing users to navigate through different levels of granularity and access detailed information.
74. How can Looker be utilized for A/B testing and experimentation analytics?
Ans:
- Connect Data: Integrate Looker with A/B testing tools.
- Define Metrics: Use LookML to create A/B test KPIs.
- Explore Data: Analyze A/B test results with Looker’s tools.
- Build Dashboards: Create dynamic dashboards for visual insights.
- Set Alerts: Receive notifications for significant changes.
- Share Insights: Collaborate by sharing reports and dashboards.
- Segmentation: Analyze A/B test results across user segments.
- Historical Analysis: Compare past A/B tests for informed strategies.
75. What role does Looker’s extension framework play in customizing the user interface and user experience?
Ans:
Looker’s extension framework allows users to customize the user interface, creating tailored experiences by adding custom visualizations, integrations, or widgets. Looker’s extension framework plays a crucial role in customizing the user interface and user experience by allowing developers to create custom applications, visualizations, and integrations within the Looker platform. This framework enables tailored solutions to meet specific business needs, enhancing users’ overall usability and functionality.
76. How does Looker handle data versioning for LookML models and maintain consistency across different environments?
Ans:
Looker integrates with Git for version control for LookML models, allowing users to manage changes, collaborate, and maintain consistency across different environments. Git tracks changes to LookML files, promoting a systematic approach to model development and deployment in various environments.
77. Can Looker be integrated with third-party data sources and APIs, and what are the considerations for such integrations?
Ans:
Looker can integrate with third-party data sources and APIs, requiring authentication and connection settings. However, factors like data security, authentication mechanisms, format compatibility, and data update frequency must be considered for successful integrations. Ensuring Looker can effectively communicate with external sources and handle data that aligns with business requirements is crucial.
78. What advanced analytics features does Looker provide for users with more complex analytical needs?
Ans:
- LookML Modeling Language
- Advanced Visualizations
- Drill-Into Functionality
- Data Blending
- Custom Metrics
- Machine Learning Integration
- Scheduled Reports
- Data Exploration
79. How does Looker handle data caching strategies for optimal performance?
Ans:
Looker provides caching options, including result set caching and aggregate table caching, to optimize query performance and reduce the need to recompute data. Looker employs an intelligent caching strategy, storing aggregated results in a cache for faster retrieval. It uses a combination of Persistent Derived Tables (PDTs) and Looker Data Actions to optimize query performance and minimize database load, ensuring efficient and timely data access.
80. Explain the role of “LookML Dashboards” in Looker and how they differ from standard dashboards.
Ans:
Looker’s LookML Dashboards, defined using LookML code, offer greater customization and flexibility compared to standard dashboards. They provide a structured, reusable way to build dashboards using LookML, enhancing collaboration, facilitating model-driven analytics, and ensuring a single source of truth for data definitions and calculations.
81. How does Looker handle data security at the row level, especially when dealing with sensitive information?
Ans:
Looker provides row-level security by allowing users to define and enforce data access policies based on specific conditions, ensuring sensitive information is appropriately restricted. Looker implements row-level security to control access to sensitive data. It utilizes user attributes and LookML model logic to filter data at the row level based on user roles and permissions. This ensures that users only see the data they are authorized to access, maintaining confidentiality and security for sensitive information.
82. Explain the concept of “LooksML” and how it contributes to the Looker modelling process.
Ans:
“LooksML” is a term sometimes used informally to refer to LookML, Looker’s modelling language. LookML allows users to define data models, relationships, and business logic. There may be a typo in your question. If you meant “LookML,” it’s Looker’s modelling language. LookML is crucial in the Looker modelling process by providing a semantic layer. Users define data models, relationships, and business logic using LookML.
83. Can Looker integrate with Tableau or Power BI data visualization tools?
Ans:
Looker is a standalone business intelligence and data exploration platform with native visualization capabilities, but can also integrate with other data visualization tools like Tableau or Power BI through data export or API connections. Users can create and customize visualizations within Looker, reducing the need for additional tools.
84. What is the purpose of “Content Validation” in Looker, and how does it ensure data accuracy?
Ans:
Looker’s “Content Validation” feature ensures data accuracy by comparing expected and actual results, ensuring the consistency of reports and analyses. This process checks for discrepancies or anomalies, ensuring data alignment with expected values and business rules. Content Validation is crucial for users relying on Looker for decision-making, enhancing trust in the displayed information.
85. How does Looker handle incremental data loading for frequently updated datasets?
Ans:
Looker supports incremental data loading by allowing users to specify total key fields, ensuring that only new or modified data is loaded into the system. Looker supports incremental data loading through strategies like Incremental PDTs (Persistent Derived Tables). This ensures that Looker stays current with the latest data without reprocessing the entire dataset each time, optimizing performance for dynamic and continually changing data sources.
86. Explain the role of “Cross-Filtering” in Looker and how it enhances data exploration.
Ans:
Cross-filtering in Looker enables users to interactively filter data across different dimensions and explore relationships, providing a dynamic and versatile exploration experience. Cross-filtering” in Looker enables users to interactively explore data across various dimensions and metrics by applying filters from one visualization to another. It provides a dynamic and interconnected way to investigate data relationships, uncover insights, and understand how various factors influence different aspects of the dataset.
87. What role do “Derived Tables” play in Looker, and how are they used in the data modelling process?
Ans:
Derived Tables in Looker allow users to create custom tables during the data modelling process, enabling the incorporation of additional calculated or transformed data. Derived Tables” in Looker serve as a mechanism to create custom or temporary tables during the data modelling process. They are derived from existing tables, allowing users to perform additional transformations, calculations, or aggregations on the data before presenting it in Looker.
88. How does Looker handle data permissions for users with varying access levels across different departments?
Ans:
- Flexible data permissions.
- Allowing administrators to define access controls based on user roles.
- Ensuring that each department accesses only relevant data.
Looker manages data permissions through user roles, groups, and model-level access control. Users are assigned roles that define their level of access, and these roles can be tailored based on specific departmental needs. By configuring LookML model logic, administrators can control which data users can access at the row and field levels.
89. What considerations should be considered when designing Looker reports for mobile accessibility?
Ans:
- Responsive Design: Adapt to different screen sizes.
- Prioritize Content: Highlight crucial info first.
- Touch-Friendly Controls: Use significant, touch-friendly elements.
- Consistent UX: Maintain design consistency.
- Performance Optimization: Optimize for mobile speed.
- Font and Contrast: Ensure readability and contrast.
- Interactive Elements: Test touch interactions.
- Device Testing: Check on various mobile devices.
90. Can Looker be used for financial reporting, and what features support financial analysis?
Ans:
Yes, Looker can be used for financial reporting. It offers features supporting financial analysis, including:
- Data Exploration: Allows thorough exploration of financial data.
- Dashboards: Create interactive financial dashboards.
- Drill-Downs: Dive into detailed financial data for deeper analysis.
- Custom Metrics: Define financial metrics tailored to needs.
- Scheduled Reports: Automate regular financial reporting.
- Data Blending: Combine diverse financial data sources.
- Visualization Options: Choose from various chart types for financial representation.
- Data Governance: Ensure accuracy and security in financial data handling.
91. How does Looker handle data security and access control in a multi-tenant environment?
Ans:
Looker offers secure multi-tenant environments with controlled data access through robust access controls and permissions. It uses authentication, authorization, and encryption, allowing administrators to define access and perform actions, integrates with authentication providers, and supports secure connections.
92. Explain Looker’s approach to handling data refresh intervals for real-time analytics.
Ans:
Looker supports real-time analytics by allowing users to configure refresh intervals for dashboards and reports, ensuring that data is kept up-to-date for timely insights. Looker provides flexibility in data refresh intervals to support real-time analytics. It allows users to configure refresh settings based on their specific needs. Looker supports both scheduled and on-demand data refresh options. Scheduled refresh intervals can be set according to the desired frequency, ensuring that data is kept up-to-date for analytics purposes.
93. Can Looker be used for anomaly detection, and if so, what features support this analysis?
Ans:
Looker can be utilized for anomaly detection through its various features and integrations. While Looker is primarily a business intelligence and data exploration platform, it can integrate with specialized tools and models for anomaly detection. Looker can be used for anomaly detection by incorporating statistical functions and custom calculations in LookML to identify unusual patterns or outliers in the data.
94. What role does Looker’s “Persistent Derived Tables” (PDTs) play in improving query performance?
Ans:
Looker’s Persistent Derived Tables (PDTs) enhance query performance by storing aggregated or transformed data, reducing the need for real-time computations. This results in faster and more efficient data retrieval, especially for complex or resource-intensive queries, providing a significant performance boost.
95. How does Looker support data privacy regulations like GDPR?
Ans:
Looker provides features such as data redaction, encryption, and user access controls to help organizations comply with data privacy regulations like GDPR. Looker supports data privacy regulations like GDPR by providing features and tools to help organizations maintain compliance. It includes role-based access controls, enabling fine-grained control over who can access specific data. Additionally, Looker allows for anonymous anonymized information (PII) within reports, ensuring sensitive data is not exposed.
96. Explain the concept of “Timeframes” in Looker and how they are used in time-based analysis.
Ans:
Timeframes in Looker allow users to define specific periods for analysis, facilitating time-based comparisons and trend analysis in reports and dashboards. In Looker, “Timeframes” refer to a feature that enables time-based analysis by allowing users to filter quickly and aggregate data based on time intervals. This feature simplifies the exploration of trends, patterns, and comparisons over different periods.
97. What options does Looker provide for embedding reports and dashboards into external applications?
Ans:
- Looker offers embedding options through its API,
- They allow users to integrate Looker content seamlessly into external applications for a unified analytics experience.
98. How can Looker utilize analytics, and what features support this type of analysis?
Ans:
Looker supports marketing analytics through features like
- Funnel analysis,
- Attribution modelling,
- Custom metric
- We are providing insights into the effectiveness of marketing campaigns
99. What considerations should be considered when migrating from on-premises Looker deployment to a cloud-based setup?
Ans:
Considerations include,
- Data migration,
- Security configurations
- Potential changes in performance characteristics
- When migrating from on-premises to cloud-based Looker deployment.
100. Can Looker be used for data storytelling, and what features support the narrative-driven presentation of insights?
Ans:
Looker supports data storytelling through features like
- Custom visualizavisualizationsations,
- The ability to create cohesive narratives within reports,
- We are enhancing the communication of insights.