
Last updated on 09th Jul 2020| 6841
- I never thought that total float and free float were different concepts before my PMP exam preparation. I used to think they were synonymous.
- While reading the Head First PMP book, I came to understand the difference between these two terms.
- Total floats and free floats have an important role in the development of a network diagram. A better understanding of these terms will help you draw a network diagram and analyze a critical path.
- During a schedule network diagram – activity can be either predecessor or successor activity corresponding to the dependent activity we refer to
- Predecessor – An activity that logically comes before a dependent activity in a schedule
- Successor – A dependent activity that logically comes after another activity on a schedule.
- Critical Path – The critical path is the sequence of activities that represents the longest path through a project. It determines the shortest possible project duration.All activities on the critical path are called critical path activities.
- Schedule Network Diagram – is a graphical representation of the logical relationships. Also referred to as dependencies, among the project schedule activities
- PDM (Precedence Diagramming Method) – A technique used for constructing a schedule model in which activities are represented by nodes. These are graphically linked by one or more logical relationships to show the sequence in which the activities are to be performed
Total Float
- Float is also known as total float.
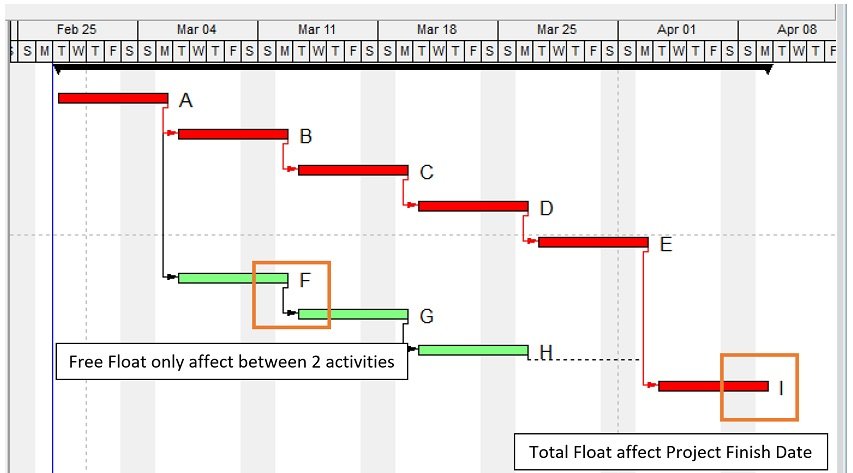
- Total float is how long an activity can be delayed, without delaying the project completion date. On a critical path, the total float is zero.
- Total float is often known as the slack.
- You can calculate the total float by subtracting the Early Start date of an activity from its Late Start date.
- Total Float = Late Start date – Early Start date Or
- You can get it by subtracting the activity’s Early Finish date from its Late Finish date.
- Total Float = Late Finish date – Early Finish date
Free Float
- Free float is how long an activity can be delayed, without delaying the Early Start of its successor activity.
- You can calculate the free float by subtracting the Early Finish date of the activity from the Early Start date of the next.
- Free Float = ES of next Activity – EF of current Activity
- Please note that if two activities are converging into a single activity, only one of these two activities may have a free float.
A note on the convention used in the example:
- You can refer to the first day of your project in two ways. Some experts consider it to be “one” and others think of it as “zero.”
- Both conventions are correct, and you are free to choose whichever you prefer. I decided to refer to my first day of the project as “one.”
Here are my reasons:
- The PMBOK Guide follows this convention.
- It seems more logical to me to say, “Hey, today is my first day of the project!” instead of saying, “Hey, today is my zero-day of the project.”
Anyway, you are free to select your choice.
- The formula used to calculate free float is different for these two situations, however, the result is the same.
- Now, we will look at some examples. I will start with a simple one and then move on to a more complicated situation.
- I’m assuming that you know how to draw a network diagram, identify the critical path, and calculate the Early Start, Early Finish, Late Start, and Late Finish dates of activities.
- If you’re having problems with these calculations, I have written a blog post on the critical path method, in detail. Read this post, and then come back.
Example: 1
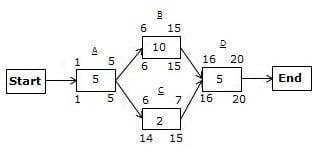
In the above network diagram, you can see two paths:
- The first path is A->B->D with a 20-day duration.
- The second path is A->C->D with a 12-day duration.
The path A->B->D is the critical path because it has the longest duration.

Get PMP Certification Training Course with Industry Standard Modules From Expert Trainers
Weekday / Weekend BatchesSee Batch DetailsCalculating the Total Float
- The path A->B->D is a critical path; therefore, it will not have a total float.
- The path A->C->D is a non-critical path, so it can have a total float.
- There are two methods to calculate the total float. In the first, you subtract the duration of the non-critical path from the critical path.
- In the second method, you find the total float for any activity by subtracting the Early Start date from the Late Start date (LS – ES) or subtracting the Early Finish date from the Late Finish date (LF – EF) on any activity.
The first method of finding the total float
- Total float = duration of the critical path – duration of the non-critical path= (duration of the path A->B->D) – (duration of the path A->C->D)= 20 – 12 = 8
- Hence, the total float is eight days.
The second method of finding the total float
- On the path A->C->D, Activity A and D lie on the critical path; therefore, they will not have a total float. Only Activity C can have a total float.
- We can calculate the total float by using either the finish dates or start dates. I will show you both ways to find it.
- First, we will go with the Late Finish and Early Finish dates:
- Total float for Activity C = (LF of Activity C – EF of Activity C)= 15 – 7= 8
- Now, the second formula:
- Total float for Activity C = (LS of Activity C – ES of Activity C)= 14 – 6 = 8
- The durations are the same. This means that both formulas will give you the same result.
Calculating the Free Float
From the figure, you can see that only Activity C can have a free float because all other activities are on the critical path.
Let’s find it.
- Free float of Activity C = ES of next activity – EF of Activity C – 1= 16 – 7 – 1= 8
- Hence, the free float for Activity C is eight days.
Now we will discuss a more complex example.
Example: 2
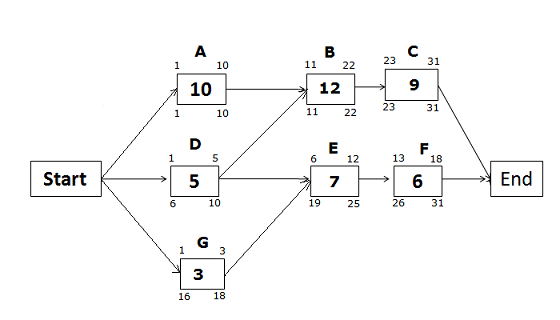
For the below-given network diagram, find which activities can have a free float and calculate the free and total float, considering the duration in days.
We know that:
Free float = ES of next activity – EF of current activity – 1
In the above diagram, Activity G can have the free float because Activity D and G converge on one common activity.
Activity D will not have a free float because its successor, Activity E, is starting the day after the completion of Activity D.
Free Float for Activity G
We know the formula for free float:
Free float of Activity G = Early Start of Activity E – Early Finish of Activity G – 1= 6 – 3 – 1= 2
Total Float for Activity G
Total float for Activity G = Late Finish of Activity G – Early Finish of Activity G= 18 –
3= 15
You can see here that the free float for Activity G is two days, and the total float is fifteen days. Both are different.