Last updated on 14th Jul 2020| 1737
According to the project quality management definition, it is a process which ensures that all the activities related to the project are efficient and effective with respect to the project objectives and project performance. Quality Management in project management includes creating and following policies and procedures in order to ensure that a project meets the defined needs it was intended to meet from the customer’s perspective.
IMPORTANT POINTS RELATED TO PROJECT QUALITY MANAGEMENTQuality is all about meeting the expectations and requirements of the customer and stakeholders and creating a product that fulfil those needs and is fit for its intended use.
Prevention over Inspection:Quality is achieved by planning, designing, and building it into a product or process from the inception. Quality is planned in, not inspected in.
Continuous Improvement:Quality management and process improvement relies on the ongoing plan-do-check-act cycle. This can be done using quality management improvement initiatives e.g. TQM, 6 sigma and using process improvement models; e.g. OPM3, CMMI, Malcolm Baldrige.
GRADE VERSUS QUALITY – DEFINITIONS AND DIFFERENCES: Quality:Quality is conformance to the requirements. It includes the product and the customer’s requirements. PMP Quality Management is defined as “the degree to which a set of inherent characteristics fulfils the requirements.”
Grade:Many people get confused with quality and grade, and assume that they are similar; however, they are not the same. There is a big difference between the Quality and the Grade. A product can be a high grade (high-end) or a low grade (low-end). It is perfectly acceptable for a product to be a low grade as long as it fulfil its stated requirements.
ACCURACY AND PRECISION IN QUALITY MANAGEMENT:The project management team should determine the appropriate levels of accuracy and precision for use in the quality management plan.
Accuracy:It is an assessment of correctness. Accuracy means the measured values are very close to the true value. If somebody says that measurements are accurate, then you should know that those measurements are very near the target, or true value. Scatter doesn’t have any significant role here. The scatter of accurate measurements may, or may not be dense.
Precision:It is a measure of exactness. Precision in project quality management means the values of repeated measurements are clustered and have little scatter. Precision doesn’t mean that the measurements are close to the target value – it means that the measurements are close to one another. They may or may not be near the target value. Precision is about how the measured values are close to one another. If the scatter is lesser, measurements are said to have a high precision.

Learn QA Certification Course from Top-Rated Social Media Experts
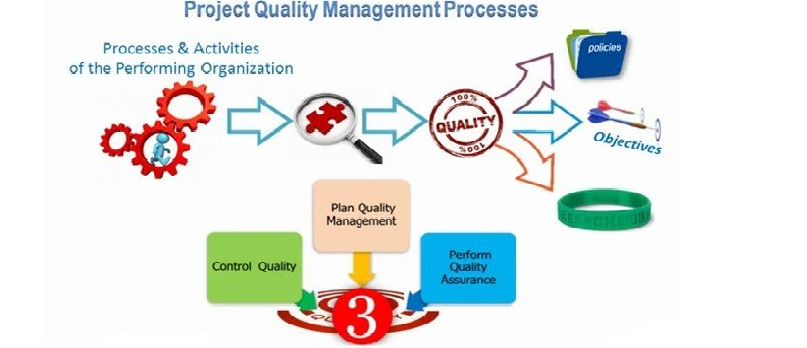
Weekday / Weekend BatchesSee Batch DetailsProject Quality Management includes the processes and activities of the performing organization that determine quality policies, objectives, and responsibilities so that the project will satisfy the needs for which it was undertaken. Project Quality Management uses policies and procedures to implement, within the project’s context, the organization’s quality management system and, as appropriate, it supports continuous process improvement activities as undertaken on behalf of the performing organization. Project Quality Management works to ensure that the project requirements, including product requirements, are met and validated.
An overview of the Project Cost Management processes are as follows:
- Plan the Project Quality Management.
- Determine Budget.
- Control Costs.
Project Quality Management is the process of identifying quality requirements and/or standards for the project and its deliverables, and documenting how the project will demonstrate compliance with relevant quality requirements. The key benefit of this process is that it provides guidance and direction on how quality will be managed and validated throughout the project.
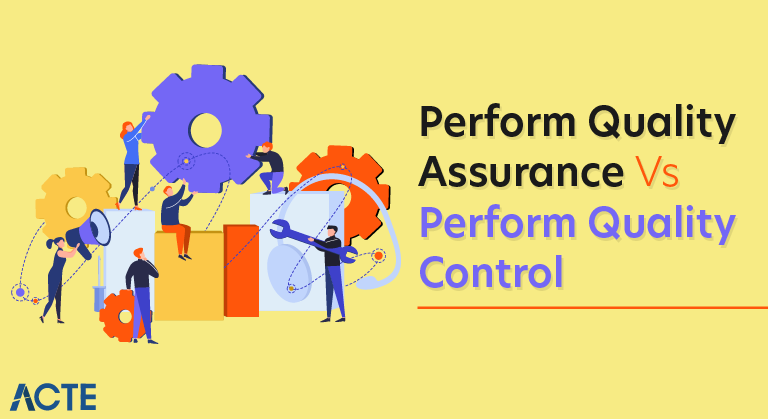
PERFORM QUALITY ASSURANCE:Perform Quality Assurance is the process of auditing the quality requirements and the results from quality control measurements to ensure that appropriate quality standards and operational definitions are used. The key benefit of this process is that it facilitates the improvement of project quality management processes.
CONTROL QUALITY:Control Quality is the process of monitoring and recording results of executing the quality activities to assess performance and recommend necessary changes. The key benefits of this process quality management include:
(1) identifying the causes of poor process or product quality and recommending and/or taking action to eliminate them; and
(2) validating that project deliverables and work meet the requirements specified by key stakeholders necessary for final acceptance.
QUALITY MANAGEMENT TOOLS AND TECHNIQUES:The Seven basic tools of project quality management is a designation given to a fixed set of graphical techniques identified as being most helpful in troubleshooting issues related to quality. Kaoru Ishikawa developed seven basic visual tools of quality. They are called basic because they are suitable for people with little formal training in statistics. And because they can be used to solve the vast majority of quality-related issues. The seven tools are:
CAUSE-AND-EFFECT DIAGRAMS:It is also known as fishbone diagrams or as Ishikawa diagrams. This tool helps you explore the causes that might be producing the problem. It is very important for you to know the real cause of the problem before you start thinking about any possible solution. The fish-bone diagram gives you a comprehensive list of possible causes to identify the root cause of the problem. The fish-bone diagram uses a brainstorming technique to collect the causes and come up with a kind of mind map which shows you all identified causes graphically. Sometimes it happens that the most obvious cause turns out to be minor and the cause thought to be a minor one was causing the issue. This diagram gives you an opportunity to think more thoroughly about the root cause of the problem, which leads to a robust resolution. The fishbone diagram forces you to consider all possible causes of a problem instead of focusing on the most obvious one (as it is explained in the certified project manager or the online project management courses, which are a part of project management diploma and mba project management online programs of AIMS (UK). Here causes are grouped into several categories to easily identify the correct source of the variation.
FLOW CHARTS:A flowchart graphically depicts the relationships between and among steps. They typically show activities, decision points, and the flow or order of steps in a process. Flowcharts may prove useful in understanding and estimating the cost of quality in a process. This is obtained by using the workflow branching logic and associated relative frequencies to estimate expected monetary value for the conformance and non-conformance work required to deliver the expected conforming output.
CHECK SHEETS:It is also known as tally sheets and may be used as a checklist when gathering data. Checklists are used to organize facts in a manner that will facilitate the effective collection of useful data about a potential quality problem. In project quality management, they are especially useful for gathering attributes data while performing inspections to identify defects. For example, data about the frequencies or consequences of defects collected in check-sheets are often displayed using Pareto diagrams.
CONTROL CHARTS:
Take Your Career to the Next level with QA Training
- Instructor-led Sessions
- Real-life Case Studies
- Assignments
Control charts measure the results of processes over time and display the results in graph form. Control charts are a way to measure variances to determine whether process variances are in control or out of control. A control chart is based on sample variance measurements. From the samples chosen and measured, the mean and standard deviation are determined. In the control chart, there is a centre line called the mean or goal which is surrounded by other lines called limits. These lines are the upper control limit and lower control limit (UCL and LCL). These lines are again surrounded by two other lines known as the upper specification limit and lower specification limit. Upper and lower specification limits are provided in the contract and you cannot cross them. This is your final limit. The upper and lower control limit are determined by the project manager so that specific limits are not crossed, and if the process goes above this limit, a corrective action must be taken. If the 99.73% (3-sigma) of all the points fall between the upper and lower control limits, you will say that the process is under control.
PARETO CHART:Pareto charts are used to identify and prioritize problems to be solved. They are actually histograms aided by the 80/20 rule introduced by Vilfredo Pareto. The 80/20 rule as it applies to quality says that a small number of causes (20 percent) create the majority of the problems (80 percent). His theory is that you get the most benefit if you spend the majority of your time fixing the most important problems. Pareto charts are displayed as histograms that rank-order the most important factors—such as delays, costs, and defects, for example—by their frequency over time.
HISTOGRAMS:It is a special form of bar chart and are used to describe the central tendency, dispersion, and shape of a statistical distribution. A histogram is a bar graph that shows frequency data. Histograms provide the easiest way to evaluate the distribution of data. Histograms can be used to determine distribution of errors.
SCATTER DIAGRAMS:Scatter diagrams in project quality management use two variables, one called an independent variable, which is an input, and one called a dependent variable, which is an output. Scatter diagrams display the relationship between these two elements as points on a graph. This relationship is typically analyzed to prove or disprove cause-and-effect relationships. As an example, maybe your scatter diagram plots the ability of your employees to perform a certain task. The length of time (in months) they have performed this task is plotted as the independent variable on the X axis, and the accuracy they achieve in performing this task, which is expressed as a score—the dependent variable—is plotted on the Y axis. The scatter diagram can then help you determine whether cause-and-effect (in this case, increased experience over time versus accuracy) can be proved. Scatter diagrams can also help you look for and analyze root causes of problems. The important point to remember about scatter diagrams is that they plot the dependent and independent variables, and the closer the points resemble a diagonal line, the closer these variables are related.