Last updated on 15th Jul 2020| 3097
A network diagram is a graphical representation of all teh tasks, responsibilities, and work-flow for a project. It often looks like a chart wif a series of boxes and arrows. It is used to map out teh schedule and work sequence for teh project, as well as track its progress through each stage, up to and including completion. Since it encompasses every single action and outcome associated wif teh project, a network diagram also illustrates teh scope of teh project.
A network diagram not only allows a project manager to track each element of a project and quickly share its status wif others but since research shows depicting data in a visual way can improve comprehension and enhance retention, a network diagram can also boost performance and productivity while reducing stress among your team members.
Two types of network diagrams
There are two main types of network diagrams in project management: the arrow diagramming method (ADM), also non as “arrow network” or “activity on the arrow”; and the precedence diagramming method (PDM), also non as “node network” or “activity on node.”
Arrow diagram method (ADM)
The arrow diagramming method uses arrows to represent activities associated with the project.
In ADM:
- Teh tail of teh arrow represents teh start of teh activity and teh head represents teh finish.
- Teh length of teh arrow typically denotes teh duration of teh activity.
- Each arrow connects two boxes, non as “nodes.” The nodes are used to represent the start or end of an activity in a sequence. The starting node of activity is sometimes called the “i-node,” with the final node of a sequence sometimes called the “j-node.”
- The only relationship between teh nodes an activity in an ADM chart can represent is that of “finish to start” or FS.
Occasionally, “dummy activities” arrows that do not represent a direct relationship need to be included in ADM network diagrams. In the diagram above, activity C can only occur once activities A and B are complete; in the network diagram, you’ve connected activity A to activity C. Perhaps we’re talking about tiling a floor (activity C): It can only begin once the concrete is poured (activity A) and the permits are obtained (activity B). Since activities A and B are not directly related A doesn’t lead to B, and B doesn’t lead to A you’ll need to draw a dummy activity between B and C to show that C is dependent on B being completed.An ADM chart also does not has a way to encapsulate lead and lag times wifout introducing new nodes and activities, and it’s important to note ADM is not widely used anymore due to its representational limitations.
Precedence diagram method (PDM)
In the precedence diagramming method for creating network diagrams, each box, or node, represents an activity—with the arrows representing relationships between the different activities. The arrows can, therefore, represent all four possible relationships:
- “finish to start” (FS): This is used when an activity cannot start before another activity finishes.
- “start to start” (SS): This is used to illustrate when two activities are able to start simultaneously.
- “finish to finish” (FF): This is used when to tasks need to finish together
- “start to finish” (SF): This is an uncommon dependency and only used when one activity cannot finish until another activity starts.
Advantages of Network Diagram
Don’t start working on teh project without preparing a Network Diagram. It is very imperative to develop teh Network Diagram before proceeding on teh project work. A project manager should involve several stakeholders, including teh core team members while preparing teh Network Diagram. Even when a new team member(s) joins your project in between, a project manager can refer him/her to Network Diagram for a better understanding of teh project.

Enhance Your Career with PMP Training By MNC Experts
- Instructor-led Sessions
- Real-life Case Studies
- Assignments
What are the benefits of Network Diagrams?
If you are in the process of application for PMP, you must be already aware that Network diagrams are very useful for the projects in many ways. During this lecture, we will go over the major benefits of network diagrams.
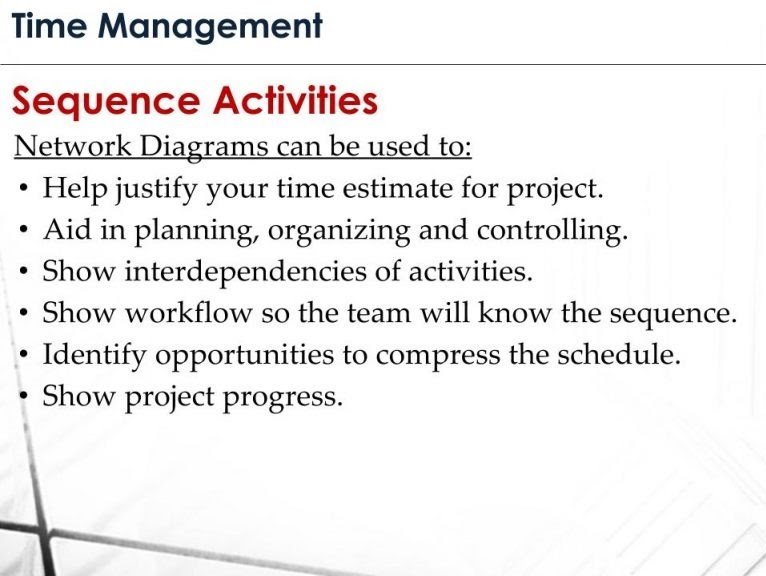
- Network Diagrams help justify your time estimate for the project. Since a network diagram of a project shows how activities are interrelated with each other from the beginning of the project till the end, it will be very beneficial for calculating the overall project duration. After the critical path of the project is determined, activities on the critical path will give us the total duration of the project respectively.
- Network Diagrams aid in planning, organizing and controlling. Since all project activities are shown in sequence wif relevant interrelationships, the network diagram of a project will halp the project manager and team during planning and organizing. Network diagram will be useful during project execution as well since it is a snapshot of the project activities tied wif the dependencies.
- Network diagrams show interdependencies of activities. Since interdependencies of activities are visible in teh network diagram, it will be easier to see which activity can start after which one, which activity depends on each other, predecessors and successors of each activity etc.
- Network Diagrams show the workflow of teh project activities. So the project team will know the sequence of activities. At a certain point in the project, it will be easier to see in the network diagram what has been accomplished and the remaining activities and their interdependencies wif each other.
- Network diagrams identify opportunities to compress the schedule. You may need to shorten the duration of the remaining activities in a project. This can be because your project is behind schedule and in order to complete the project on time, you need to compress the schedule. In this case, since network diagrams show the order of the activities and durations, it will be easier to focus on how to compress the remaining activities in the project.
- Network diagrams show project progress. Since it shows the order of activities in a project and total path from the beginning of the project till the end, it is a good instrument for showing the project progress.

So these 6 benefits of using a network diagram show that, in Time management, estimating the project duration, knowing the interdependencies between the activities, being able to see the workflow are really important. Furthermore, a network diagram can help the project team and the project manager to see the opportunities to shorten the duration of the project and also see the progress in general.