
Last updated on 09th Jul 2020| 7854
- These are the metrics pertaining to the Project Quality. They measure defects, cost, schedule, productivity and estimation of various project resources and deliverables.
- Schedule Variance : Any difference between the scheduled completion of an activity and the actual completion is known as Schedule Variance. Schedule variance = ((Actual calendar days – Planned calendar days) + Start variance)/ Planned calendar days x 100.
- Effort Variance: Difference between the planned outlined effort and the effort required to actually undertake the task is called Effort variance. Effort variance = (Actual Effort – Planned Effort)/ Planned Effort x 100.
- Size Variance: Difference between the estimated size of the project and the actual size of the project (normally in KLOC or FP) Size variance = (Actual size – Estimated size)/ Estimated size x 100.
- Requirement Stability Index: Provides visibility and understanding into the magnitude and impact of requirements changes. RSI = 1- ((No of changed + No of deleted + No of added) / Total no of Initial requirements) x100
- Productivity (Project): It is a measure of output from a related process for a unit of input. Project Productivity = Actual Project Size / Actual Effort spent for the project
- Productivity (for test case preparation) Productivity in test case preparation = Actual no of test cases/ actual effort spent on test case preparation
- Productivity (for test case execution) Productivity in test case execution = actual number of test cases / actual effort spend on testing.
- Productivity (defect detection) Productivity in defect detection = Actual number of defects (review + testing) / actual effort spent on (review + testing)
- Productivity (defect fixation) Productivity in defect fixation = actual no of defects fixed/ actual effort spent on defect fixation
- Schedule variance for a phase: The deviation between planned and actual schedule for the phases within a project. Schedule variance for a phase = (Actual Calendar days for a phase – Planned calendar days for a phase + Start variance for a phase)/ (Planned calendar days for a phase) x 100
- Effort variance for a phase: The deviation between planned and actual effort for various phases within the project. Effort variance for a phase = (Actual effort for a phase – planned effort for a phase)/ (planned effort for a phase) x 100
They focus on the quality of deliverables. Product metrics are combined across several projects to produce process metrics.
Metrics for the product:
- Measures of the Analysis Model.
- Complexity of the Design Model
- Code metrics.
Furthermore, Complexity of the Design Model is classified as–
- Internal algorithmic complexity.
- Architectural complexity.
- Data flow complexity.
Process Metrics:
- These are the metrics pertaining to the Process Quality. They measure efficiency and effectiveness of various processes.
- Cost of Quality: It is a measure in terms of money for the quality performance within an organization Cost of quality = (review + testing + verification review + verification testing + QA + configuration management + measurement + training + rework review + rework testing)/ total effort x 100
- Cost of poor Quality: It is the cost of implementing imperfect processes and products. Cost of poor quality = rework effort/ total effort x 100
- Defect Density: It is the number of defects detected in the software during the development divided by the size of the software (typically in KLOC or FP) Defect density for a project = Total number of defects/ project size in KLOC or FP
- Review Efficiency: defined as the efficiency in harnessing/ detecting review defects in the verification stage. Review efficiency = (number of defects caught in review)/ total number of defects caught) x 100
- Testing Efficiency: Testing efficiency = 1 – ((defects found in acceptance)/ total no of testing defects) x 100
- Defect removal efficiency: Gives the efficiency with which defects were detected and minimum defects were filtered down to the customer. Defect removal efficiency = (1 – (total defects caught by customer/ total no of defects)) x 100
Process metrics are collected across all projects and over long periods of time.
- They are used for making strategic decisions.
- The intent is to provide a set of process indicators that lead to long-term software process improvement.
The only way to know how/where to improve any process is to
- Measure specific attributes of the process.
- Develop a set of meaningful metrics based on these attributes.
- Use the metrics to provide indicators that will lead to a strategy for improvement.
Software process and project metrics
1. Chapter 4 Software Process and Project Metrics

Learn Practical Oriented Microsoft Project Courses By Real Time Experts
Weekday / Weekend BatchesSee Batch Details2. Software metrics refers to a broad range of measurements for computer software. Measurement can be applied to the software process with the intent of improving it on a continuous basis. Measurement can be used throughout a software project to assist in estimation, quality control, productivity assessment, and project control.
Measurement can be used by software engineers to help assess the quality of technical work products and to assist in tactical decision making as a project proceeds.
3. Why do we Measure?
- To characterize
- To evaluate
- To predict
- To improve
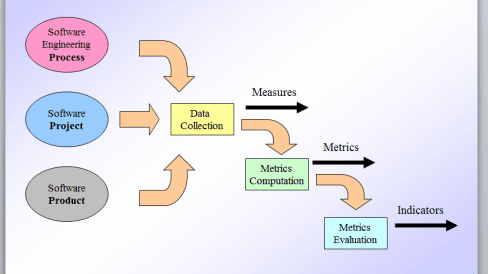
4. Measures, Metrics, and Indicators A measure provides a quantitative indication of the extent, amount, dimension, capacity, or size of some attribute of a product or process.
Metrics is a quantitative measure of the degree to which a system, component, or process possesses a a given attribute.
5. Measures, Metrics, and Indicators An indicator is a metric or combination of metrics that provide insight into the software process, a software project, or the product itself.
An indicator provides insight that enables the project manager or software engineers to adjust the process, the project, or the process to make things better.
6. Metrics in the Process and Project Domains Process indicators enable a software engineering organization to gain insight into the efficacy of an existing process (I.e., the paradigm, software engineering tasks, work products, and milestones).
They enable managers and practitioners to assess what works and what doesn’t.
7. Metrics in the Process and Project Domains Project indicators enable a software project manager to
- assess the status of an ongoing project
- track potential risks
- Uncover problem areas before they go “critical”
- Adjust work flow or tasks
- Evaluate the project team’s ability to control quality of software work products
8. Process Metrics and Software Process Improvement, We measure the efficacy of a software process indirectly; we derive a set of metrics based on the outcomes that can be derived from the process.
9. Process Metrics and Software Process Improvement A software metrics etiquette:
- Use common sense an organizational sensitivity when interpreting metrics data
- Provide regular feedback to the individuals and teams who collect measures and metrics
- Don’t use metrics to appraise individuals
- Work with practitioners and teams to set clear goals and metrics that will be used to achieve them Cont..
10. Process Metrics and Software Process Improvement A software metrics etiquette (cont.):
- Never use metrics to threaten individuals or teams
- Metrics data that indicate a problem area should not be considered “negative.” These data are merely an indicator for process improvement.
- Don’t obsess on a single metric to the exclusion of other important metrics.
11. Process Metrics and Software Process Improvement A more rigorous approach:
statistical software process improvement (SSPI):
- All errors and defects are categorized by origin (flaw in spec, flaw in logic, non -conformance to standards).
- The cost to correct each error and defect is recorded.
- The number of errors and defects in each category is counted and ranked in descending order. Cont..
12. Process Metrics and Software Process Improvement SPPI (cont.):
- The overall cost of errors and defects in each category is computed.
- Resultant data are analyzed to uncover the categories that result in the highest cost to the organization.
- Plans are developed to modify the process with the intent of eliminating (or reducing the frequency of) the class of errors and defects that is most costly.
13.Project Metrics
- Project metrics are used by a project manager and a software team to adapt project work flow and technical activities.
- Occurred during:
- estimation monitor and control progress.
- production rates: pages of documentation, review hours, function points, and delivered source lines.
- errors
- technical metrics quality
14. Project Metrics The intent of project metrics are two folds: – to minimize the development schedule by making the adjustments necessary to avoid delays and mitigate potential problems. – to assess product quality on an ongoing basis and, when necessary, modify the technical approach to improve quality.
15. Project Metrics Another model of project metrics suggests that every project should measure:
- Inputs – measures of the resources required to do the work
- Outputs – measures of the deliverables or work products created during the software engineering process
- Results – measures that indicate the effectiveness of the deliverables
16. Software Measurement
- Direct measures of SE process include cost and effort. Direct measures of product include LOC produced, execution speed, memory size, and defects reported over some set period of time.
- Indirect measures of product include functionality, quality, complexity, efficiency, reliability, maintainability, and many other “-abilities”
17. Size-oriented Metrics
- Derived by normalizing quality and/or productivity measures by considering the size of the software that has been produced.
18. Size-oriented Metrics Then we can develop a set of simple size-oriented metrics:
- Errors per KLOC
- Defects per KLOC
- $ per LOC
- Page of documentation per KLOC And other interesting metrics can be computed
- Errors per person-month, LOC per person-month, $ per page of documentation.
19. Function-Oriented Metrics
- Use a measure of the functionality delivered by the application as a normalization value.
- Functionality can not be measured directly, it must be derived indirectly using other direct measures.
- A measure called the function point.
20. Function-Oriented Metrics
Function points are derived using an empirical relationship based on countable (direct) measures of software’s information domain and assessments of software complexity.
21. Computing Function Points Analyze information do main of the application and develop co units Weight each co unit by assessing complexity Assess influence of global factors that affect the application Compute function points Establish count for input domain and system interfaces Assign level of complexity or weight to each count Grade significance of external factors, F such as reuse, concurrency, OS, … degree of influence: N = F i complexity multiplier: C = (0.65 + 0.01 x N) function points = (count x w eight) x C where: i
22. Function-Oriented Metrics To compute function points (FP), the following relationship is used: FP = count total x [0.65+0.01xΣ(Fi)]
23. Analyzing the Information Domain complexity multiplier function points number of user inputs number of user outputs number of user inquiries number of files number of ext.interfaces measurement parameter 3 4 3 7 5 count weighting factor simple avg. complex 4 5 4 10 7 6 7 6 15 10 = = = = = count-total X X X X X
24. Taking Complexity into Account Factors are rated on a scale of 0 (not important) to 5 (very important):
data communications distributed functions heavily used configuration transaction rate on-line data entry end user efficiency on-line update complex processing installation ease operational ease multiple sites facilitate change
25. Why Opt for FP Measures?
Independent of programming language uses readily countable characteristics of the “information domain” of the problem does not “penalize” inventive implementations that require few er LOC than others makes it easier to accommodate reuse and the trend toward object-oriented approaches
26. Typical Function-Oriented Metrics
- errors per FP
- defects per FP
- $ per FP
- pages of documentation per FP
- FP per person-month
27. Extended Function Point Metrics
- Function point was inadequate for many engineering and embedded systems.
- A function point extension called feature points, is a superset of the function point measure that can be applied to systems and engineering software applications.
- Accommodate applications in which algorithmic complexity is high.
28. Extended Function Point Metrics
- The feature point metric counts a new software characteristic – algorithms.
- Another function point extension – developed by Boeing integrate data dimension of software with functional and control dimensions. “3D function point”.
- “Counted, quantified, and transformed”
29. Extended Function Point Metrics Function points, feature points, and 3D point represent the same thing – “functionality” or “utility” delivered by software.
30. Reconciling Different Metrics Approaches
- Attempt to relate FP and LOC measures.
31. Metrics for Software Quality
- Must use technical measures to evaluate quality in objective, rather than subjective ways.
- Must evaluate quality as the project progresses.
- The primary thrust is to measure errors and defects metrics provide indication of the effectiveness software quality assurance and control activities.

Get On-Demand MS Project Training to Develop Your Skills
- Instructor-led Sessions
- Real-life Case Studies
- Assignments
32. Measuring Quality
- Correctness: defects per KLOC
- Maintainability: the ease that a program can be corrected, adapted, and enhanced. Time/cost.
- Time-oriented metrics: Mean-time-to-change (MTTC)
- Cost-oriented metrics: Spoilage – cost to correct defects encountered.
33. Measuring Quality
- Integrity: ability to withstand attacks
- Threat: the probability that an attack of a specific type will occur within a given time.
- Security: the probability that the attack of a specific type will be repelled. Integrity = sum [(1 – threat)x(1 – security)]
34. Measuring Quality
- Usability: attempt to quantify “user-friendliness” in terms of four characteristics:
1) The physical/intellectual skill to learn the system
2) The time required to become moderately efficient in the use of the system
3) The net increase of productivity
4) A subjective assessment of user attitude toward the system (e.g., use of questionnaire).
35. Defect Removal Efficiency
- A quality metric that provides benefit at both the project and process level.
- DRE is a measure of filtering ability of quality assurance and control activities as they applied throughout all process framework activities.
36. Defect Removal Efficiency
DRE = (errors) / (errors + defects) where errors = problems found before release defects = problems found after release The ideal value for DRE is 1 no defects found.
37. Integrating Metrics Within the Software Process Arguments for Software Metrics:
- Why is it so important to measure the process of software engineering and the product (software) that it produces?
38. Managing Variation: Statistical Process Control
- How can we compare a variety of different projects?
- Use of Control Chart: to determine whether the dispersion (variability) and “location” (moving average) of process metrics are stable or unstable.
1) The moving average control chart
2) The individual control chart