Agile metrics are standards that help a software team in monitoring how productive a team is across the different phases of the SDLC. Agile metrics are an essential component of the development process. For companies or teams that work on the agile framework, agile metrics help in assessing software quality.
- What Are Agile Metrics?
- Importance of Agile Metrics
- Agile Metrics Important for Your Project
- Defining the Common Types of Metrics in Agile
- The Power of KPIs in Agile
- The Process of Choosing Appropriate Agile Metrics
- What Are the Best Metrics to Improve Agile Team Performance?
- Traditional KPIs Versus Agile KPIs
- What Are The Benefits Of Agile Metrics In Project Management?
- Conclusion
What Are Agile Metrics?
Metrics are nothing but standards of measurement. Agile metrics are standards that help a software team monitor how productive a team is at various stages of SDLC. Agile metrics are an essential component of the development process. For companies or teams working on an agile framework, agile metrics help assess software quality.
By assessing how productive a team is, agile metrics help keep team performance under control. If there are any flaws, they highlight them at an early stage. Since the data and its usage can be measured, it becomes easier to work on the shortcomings with the help of these metrics. For example, velocity metrics can help you track your team’s output.
- Now that we know what agile metrics are, let’s take a look at how they work. The whole concept of agility rests on Continuous Improvement (CI). But it’s not something you can impose on teams. It has to come from within. In short, self-improvement (SI) is a must. Therefore, it is safe to say that CI is not possible without SI.
- Immediate delivery is an important component of Agility. But SI should not be ignored in this case. Teams that practice SI produce better results than those that do not. But being a sustainable and effective SI is no child’s play. It is a long-term process and requires a management framework. By tracking software quality and team performance, Agile Metrics supports SI. In a way, these metrics directly affect the CI.
- In addition to improving consistency, delivering a high quality product is also an important part of agility. However, striking a balance between the two can be challenging. This gives rise to the need for metrics against which teams can measure progress. Overall, agile metrics help teams become self-managing. They also help in providing value to the firms. Plus, CI becomes part of the workflow without much effort.
Importance of Agile Metrics:
Agile Metrics Important for Your Project:
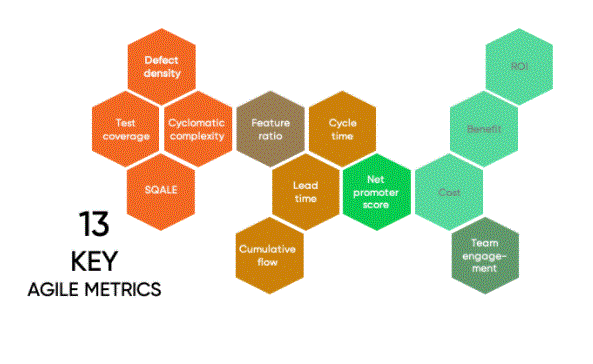
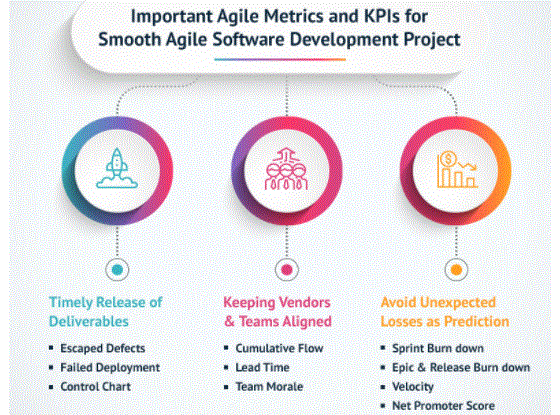
Agile metrics measure various aspects of project development. Here are some agile metrics that are important to your project. They will help you understand the development process better. Additionally, they will ease the overall software release process.
1. Sprint Burndown Report
An agile framework consists of scrum teams. They organise their processes into sprints. Since the sprint is time bound, it is important to track the work progress frequently. There is a sprint burndown report for tracking the completion of various tasks during the sprint. In this case the two main parameters of measurement are the time remaining to be completed and the work done. The x-axis refers to time. The y-axis represents the remaining work. The unit of measurement is the hour or story point. The team predicts the workload at the start of the sprint. The goal is to complete the workload by the end of the sprint.
2. Velocity
Velocity measures the average amount of work a team does during a sprint. There are several iterations in the report on this matter. The accuracy of the forecast depends on the number of iterations. The more iterations, the more accurate the forecast. The unit of measurement is the hour or story point. Velocity also determines a team’s ability to work through the backlog. As time passes, velocity develops. To ensure consistent performance, it is important to track velocity. If the velocity drops, it’s a sign that the team needs to fix something.
3. Epic and Release Burndown
Unlike sprint burndown, epic and release burndown focus on the picture. They track progress over a large work body. There are many epics and versions of work in a sprint. Therefore, it is important to track each sprint along with their progress. The whole team needs to be aware of the workflow in Epic and Version. The epic and release burndown charts make this possible.
4. Control Chart
In agile, control charts focus on the time period from “in progress” to “completed” status of tasks. Their purpose is to check the cycle time of a single issue. Continuity teams have predictable deliveries in cycle times. In addition, teams with shorter cycle times tend to have higher throughput. When teams measure cycle times, they improve the flexibility of their processes. For example, in case of changes, you can see the results immediately. As a result, team members can make the necessary adjustments. In general, the goal to achieve in each sprint is a short and consistent cycle time.
5. Cumulative Flow Diagram
Cumulative Flow Diagram (CFD) ensures consistency in workflow across the team. The x-axis represents time. The number of issues is on the Y-axis. Ideally, the diagram should be smooth from left to right. Smooth the colour band in case of uneven flow. Band narrowing means that the throughput exceeds the rate of penetration. If the band widens, it means that your workflow capacity is higher than necessary, and it can be moved elsewhere to smooth out the flow.
CFD measures the status of a work in progress. With it, you can take measures to speed up the workflow. The diagram provides a clear visual representation of the constraints. You can analyse how the bottlenecks formed in the first place. After that, the team can take steps to eliminate them and improve.
6. Lead Time
Lead time is the amount of time between the time a product is delivered and the time a request is made for actual delivery. All the processes to complete a product come under lead time. This also includes developing a business requirement and fixing bugs. Lead time is an important metric. This is because it provides accurate time calculation for every process.
7. Value Delivered
Here, project managers provide value for each requirement. It uses the metric dollar or numeral system. Implementation of high-value features should be a top priority. An upward trend in this metric indicates that things are on track. On the other hand, a declining trend is not a good sign. This means that low-value features are under implementation. If so, the team should improve. Sometimes, you may even have to stop product development.
8. Net Promoter Score
Net Promoter Score measures how willing customers are to recommend a product or service to others. It is an index that ranges from -100 to 100. Customer loyalty is an important factor in determining the success of a firm. You can use Net Promoter Score as a proxy for this purpose.
9. Work Item Age
Work item ageing is a work in progress. This metric indicates the time elapsed between the start and completion of the current task. The use of the work item Age is to trace the timeline for unfinished tasks. Using this metric, you will get a feel for how your current work progresses. You can also compare your past performance with reference to the current scenario. The measuring tool, in this case, is an ageing work in progress chart.
10. Throughput
Throughput measures the average number of tasks processed in each time unit. You can also call it a measure for story points per iteration. It represents the productivity level of a team. Throughput helps you understand the impact of workflow on business performance. You can get a better overview of your team’s potential. However, it does not show the starting point of the functions.
11. Blocked Time
This metric specifies a blocking sticker for a task. It means that due to some reason, the assignee cannot proceed with a particular task due to some dependency. As soon as the dependency is complete, you should move the blocked card to the right on the task board. Count the number and duration of blocked cards to measure the number of blockers. Resolving obstacles will allow you to complete your “in progress” task more quickly.
12. Escaped Defects
When there are bugs in production, it causes a lot of unexpected damage. They create problems, and the team needs to address them. The Remaining Defects metric helps identify bugs when a release enters production.
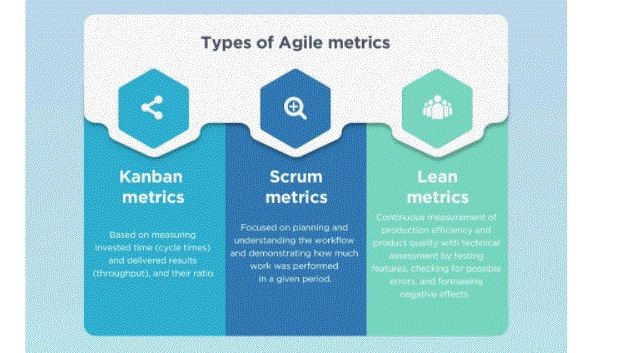
- Kanban Metrics empowers teams to better focus on Agile workflows, prioritise and organise tasks professionally, and get all the work done. Example: Lead Time and Cycle Time.
- Scrum metrics are about predictable delivery of high-quality software to users. Example: burndown chart and velocity.
- Lean metrics are focused on ensuring the flow of value from a company to its customers and eliminating waste.
Defining the Common Types of Metrics in Agile:
In Agile, three types of metrics are commonly defined:
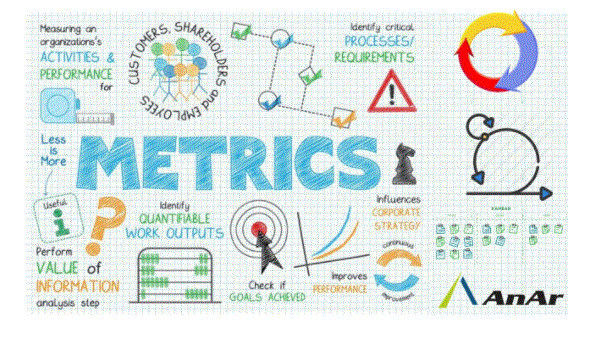
- Agile productivity requires quality metrics that will help all team members improve their processes. Let’s define some qualities that show that a metric is powerful and can lead to real improvement in an agile team.
- Any agile metric that matters should not be imposed by management; It should be used voluntarily by the team for the purpose of learning and improving.
- Scrum metrics are not just about numbers. They should be a key element in conversations about procedures and potential bottlenecks.
- You should use metrics to answer a specific question about agile processes. Avoid measuring for measure.
- It is better to use any metric in conjunction with other metrics. Using multiple KPIs together will give you a balanced picture of your agile activities.
- Metrics that are not fully understood or appear complex are not useful in guiding daily activities.
- A metric should be an essential indicator for a pattern change. It should provide an opportunity to analyse the cause in a timely manner.
- Track KPIs that can be applied to the team and KPIs that measure the individual.
- Don’t measure parameters just because they are easy to track. This practice can often mean that various project management tools that produce out-of-the-box reports were used.
- Don’t forget to record the reference. Without context the data may just be noise.
The Power of KPIs in Agile:
Follow these three general rules to make Agile Metrics a success:
- Logically, you don’t want to measure one aspect to make up for the loss of other information. There is also no need to measure too many things and spread the focus of your team.
- So, how should you choose the proper metrics for your Agile project? You can find many options, but unfortunately, many of them are simply useless. Some of them look good at first sight but offer little actionable value.
- So initially you have to decide the success criteria of your company. Try to agree on what measures should be used to track the success of the company or a project. Here are some examples:
The Process of Choosing Appropriate Agile Metrics:
value: Satisfying customer’s needs.
Quality: Product without issues and defects.
Predictability: About the ability to plan and deliver.
Growth: About potential growth and learning in the company.
Stability: About the ability to maintain this momentum indefinitely.
Productivity: About doing more work with the same resources or at the same time.

What Are the Best Metrics to Improve Agile Team Performance?
There is no ideal way to measure overall agile performance. Some experts identify four basic metrics that cover the most important points:
Cycle Time – To Measure Productivity
Remaining failure rate – to measure quality
Planned-to-Performance Ratio – To measure predictability
appiness Metric – To Measure Sustainability
Traditional KPIs Versus Agile KPIs:
Metrics and Agile metrics differ greatly in traditional projects. For example, metrics in Waterfall are focused on output while metrics in Agile focus on results. Some of the KPIs prevalent in traditional PMs can lead to mismanagement in management. For example, the number of documented requirements measures quality rather than improved collaboration with customers which can define their satisfaction. Progress and productivity are measured by monitoring the hours employed, rather than considering actual team capabilities. They measure performance by how fast the team can perform.
In fact, measuring metrics in the traditional way may not help teams get their projects done faster, but can add pressure. This is why the adoption of the Agile PM philosophy has led to the emergence of new Agile Project Metrics. The purpose of Agile KPIs is to help teams better understand and analyse their workflow, identify flaws, and focus on customer satisfaction.
- Provide realistic, data-based overview of work progress
- Help teams stay focused
- Encourage continuous self-improvement for better performance
- Assist in timely delivery of quality final products
- Promote transparency and foster creativity throughout the organisation
- Promoting Self-Improvement (SI) for Continuous Improvement (CI) encourage self-management
What Are The Benefits Of Agile Metrics In Project Management?
The metrics used in the Agile methodology have multidimensional benefits, including the following:
Conclusion:
Any Agile metric is a standard that helps a software development team to track how productive they are in the various SDLC phases. They are an integral part of the entire development process. These metrics help Agile experts assess software quality and track team performance.
Powerful Agile metrics are in place to help us better understand and professionally analyse our workflows, detect bottlenecks, and work with them. That’s why consistent delivery of healthy projects, satisfying customers, and eliminating wasteful activities is what modern Agile teams must focus on in order to be successful.


