Last updated on 14th Oct 2025| 10414
- Principal Component Analysis
- What is Principal Component Analysis (PCA)
- Why Do We Use PCA
- How PCA Works – Step-by-Step
- Mathematical Intuition Behind PCA
- Real-World Applications of PCA
- Advantages and Limitations of PCA
- When Not to Use PCA
- PCA vs Other Dimensionality Reduction Techniques
- Conclusion
Principal Component Analysis
As data becomes the driving force behind decision-making in nearly every industry, the complexity and volume of datasets have increased dramatically. Often, these datasets contain a vast number of variables or features. Managing such high-dimensional data presents numerous challenges, including increased computational cost, the risk of overfitting, and difficulty in visualizing relationships between variables. To overcome these hurdles with structured techniques and modern tools, explore Data Analytics Training a hands-on program that equips learners to handle complex datasets, apply dimensionality reduction methods, and extract actionable insights from noisy information. Principal Component Analysis, commonly known as PCA, is a statistical method that addresses these issues by reducing the number of variables in a dataset while preserving as much information as possible. This blog offers a deep but accessible introduction to PCA, covering its process, applications, and relevance in modern data science.
What is Principal Component Analysis (PCA)
Principal Component Analysis is a technique used in data analysis and machine learning to reduce the number of variables or features in a dataset. It does so by transforming the original variables into a new set of variables known as principal components. These principal components are uncorrelated and are ordered in such a way that the first few retain most of the variation present in the original dataset. To understand how such dimensionality reduction techniques fit into broader analytics trends, explore Future of Big Data a forward-looking guide that highlights emerging technologies, evolving data architectures, and the growing demand for scalable, intelligent systems across industries. Essentially, PCA provides a way of summarizing a complex dataset with many features into a smaller, more manageable representation that still captures the key patterns and trends.
Interested in Obtaining Your Data Analyst Certificate? View The Data Analytics Online Training Offered By ACTE Right Now!
Why Do We Use PCA
The primary motivation for using PCA is dimensionality reduction. In practical terms, this means simplifying the dataset by eliminating redundant or less significant features while preserving the structure and patterns. By reducing the number of variables, PCA helps improve the efficiency of machine learning algorithms, reduce the likelihood of overfitting, and make data visualization easier. To understand how such techniques fit into the broader landscape of data innovation, explore Who Is the Big Daddy of Big Data a deep dive into the pioneers, platforms, and technologies that have shaped the evolution of big data and continue to drive breakthroughs in analytics and AI. PCA is also useful in identifying patterns and relationships that may not be immediately visible in the raw data. Additionally, when dealing with highly correlated variables, PCA can help eliminate multicollinearity, which can distort statistical models and analyses.
To Explore Data Analyst in Depth, Check Out Our Comprehensive Data Analytics Online Training To Gain Insights From Our Experts!
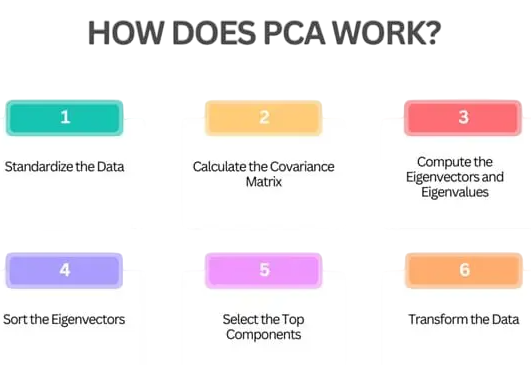
How PCA Works – Step-by-Step
- The process of applying PCA to a dataset involves several mathematical steps. First, it is essential to standardize the dataset. Standardization ensures that each feature contributes equally to the analysis, particularly when features are measured on different scales. Next, the covariance matrix of the standardized dataset is computed to examine the relationships between variables. From this matrix, the eigenvalues and eigenvectors are calculated.
- The eigenvectors represent the directions of maximum variance, and the eigenvalues determine their magnitude. By selecting the top few eigenvectors based on their corresponding eigenvalues, we construct the principal components. Finally, the original data is projected onto this new set of axes, producing a transformed dataset with reduced dimensionality but retained variance.

Mathematical Intuition Behind PCA
- At its core, PCA is rooted in linear algebra and statistics. The covariance matrix captures how features in the dataset vary with each other. If two features are positively correlated, the corresponding covariance will be high, and vice versa. By performing eigen decomposition of the covariance matrix, we obtain eigenvectors and eigenvalues. The eigenvectors define the new feature space, while the eigenvalues tell us how much of the total data variance is captured by each eigenvector.
- The first principal component is the direction in the feature space that maximizes variance, the second is orthogonal to the first and captures the next highest variance, and so on. This mathematical approach ensures that we maintain the most informative directions in the data while discarding those that contribute little to its structure.
- PCA is used across numerous industries and domains where large datasets are common. In image processing, PCA helps reduce the dimensionality of pixel data, enabling tasks such as face recognition and image compression. In finance, PCA is used to analyze and reduce the complexity of market data, allowing analysts to understand key driving forces behind asset prices. In genetics, it aids in visualizing variations in gene expression patterns among different populations or conditions.
- To apply these insights in real-time environments, explore Stream Processing in Big Data a practical guide to handling continuous data flows using tools like Apache Storm and Kafka, enabling scalable, low-latency analytics across industries.
- Marketing professionals use PCA to segment customers based on purchasing behavior, simplifying complex behavioral data into core groups. In industrial settings, PCA assists in monitoring production processes by summarizing sensor data into key performance indicators. These diverse applications highlight PCA’s power to simplify complex problems and support informed decision-making.
- There are several dimensionality reduction techniques, each with its strengths and limitations. PCA is linear and unsupervised, making it fast and efficient for general-purpose applications. However, when the goal is to visualize complex clusters or capture nonlinear patterns, techniques like t-SNE and UMAP are better suited. These methods preserve local structures in the data and are particularly useful for visualizing high-dimensional biological or textual data.
- To understand how these techniques fit into broader analytics ecosystems, explore Guide To Big Data a beginner-friendly resource that introduces key concepts, tools, and trends shaping the future of data-driven decision-making.
- Another alternative is Linear Discriminant Analysis, which is supervised and takes class labels into account, making it more suitable for classification tasks. Autoencoders, a deep learning-based method, can also reduce dimensionality by learning a compressed representation of the input data through neural networks. Compared to these methods, PCA remains a simple, interpretable, and reliable starting point for many data science projects.
Gain Your Master’s Certification in Data Analyst Training by Enrolling in Our Data Analyst Master Program Training Course Now!
Real-World Applications of PCA
Are You Preparing for Data Analyst Jobs? Check Out ACTE’s Data Analyst Interview Questions and Answers to Boost Your Preparation!
Advantages and Limitations of PCA
Principal Component Analysis offers several compelling advantages. It effectively reduces the dimensionality of large datasets, making them easier to manage and analyze. It also improves the performance and speed of machine learning models by eliminating irrelevant or redundant features. To understand how these techniques integrate with scalable data ecosystems, explore Big Data and Hadoop a foundational guide to distributed storage, parallel processing, and the tools that power modern analytics infrastructure.
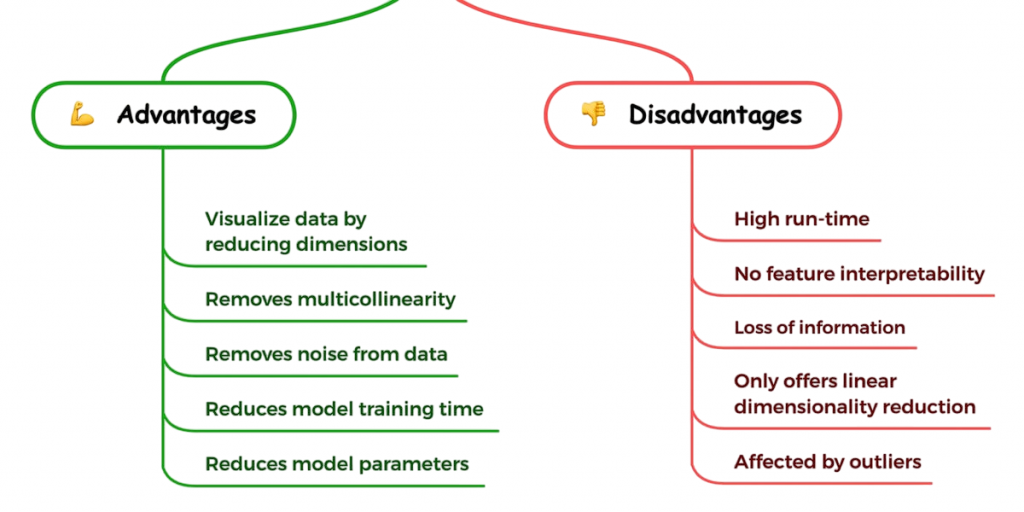
PCA enhances visualization by reducing high-dimensional data to two or three dimensions, which is particularly valuable for exploratory data analysis. However, PCA also has limitations. To master these techniques and apply them effectively, explore Data Analytics Training a practical course that equips learners to optimize model performance, interpret complex datasets, and make informed decisions using advanced analytical tools. One of the main drawbacks is the loss of interpretability. Principal components are linear combinations of original variables, which can make them hard to interpret in real-world terms.
When Not to Use PCA
While PCA is a powerful tool, it is not suitable for every situation. If the relationships in the data are nonlinear, PCA may fail to capture important patterns. In such cases, alternative methods like t-SNE or UMAP might be more appropriate. PCA also requires that data be numeric and continuous; it does not work directly with categorical variables unless they are encoded numerically. To apply such techniques within scalable data ecosystems, explore Online Hadoop Training a hands-on program designed to help professionals manage distributed datasets, implement parallel processing, and integrate advanced analytics into real-world big data workflows. Moreover, if interpretability is crucial for example, in fields like healthcare or law, where understanding the role of specific variables is important then using PCA can be counterproductive. Lastly, PCA is not ideal for sparse datasets or those with many missing values, as it can lead to misleading conclusions unless data preprocessing is handled with care.
PCA vs Other Dimensionality Reduction Techniques
Conclusion
Principal Component Analysis is an essential tool in the data scientist’s toolkit. It provides a structured way to simplify high-dimensional data while preserving its essential characteristics. From enhancing machine learning models to making large datasets easier to visualize and understand, PCA plays a critical role in modern data analysis. However, like all tools, it must be applied with care and in the appropriate context. To gain hands-on experience with PCA and other core techniques, explore Data Analytics Training a comprehensive course that helps learners master dimensionality reduction, optimize model performance, and interpret complex data with confidence. Understanding how PCA works, what it does well, and where it falls short enables practitioners to make informed decisions and extract maximum value from their data.