Last updated on 13th Oct 2025| 11123
- Introduction to Spotfire
- Key Features
- Data Visualization Capabilities
- Predictive Analytics in Spotfire
- Integration with R and Python
- Dashboard and Reports
- Spotfire Architecture
- Licensing and Pricing
- Industry Use Cases
- Learning Resources
- Spotfire vs Competitors
- Conclusion
Introduction to Spotfire
TIBCO Spotfire is a powerful data visualization and analytics platform widely used by data analysts, business intelligence professionals, and decision-makers. Designed to handle complex data from various sources, Spotfire enables users to gain valuable insights through interactive dashboards, real-time analytics, and advanced visualizations. Initially developed by a Swedish company and later Data Science Training acquired by TIBCO Software, Spotfire has emerged as one of the leading business intelligence tools, offering self-service analytics, data wrangling, and AI-powered recommendations. It empowers users across various industries to make data-driven decisions more quickly and with greater accuracy.
Key Features
Spotfire offers a broad range of features tailored to meet the demands of modern data analysis and visualization. One of its standout capabilities is the intuitive drag-and-drop interface, which enables users to quickly visualize data without requiring code Scala Certification The software supports in-memory data analysis, enabling real-time data processing and faster insights. Spotfire also includes built-in geo-analytics, enabling location-based insights through map visualizations.
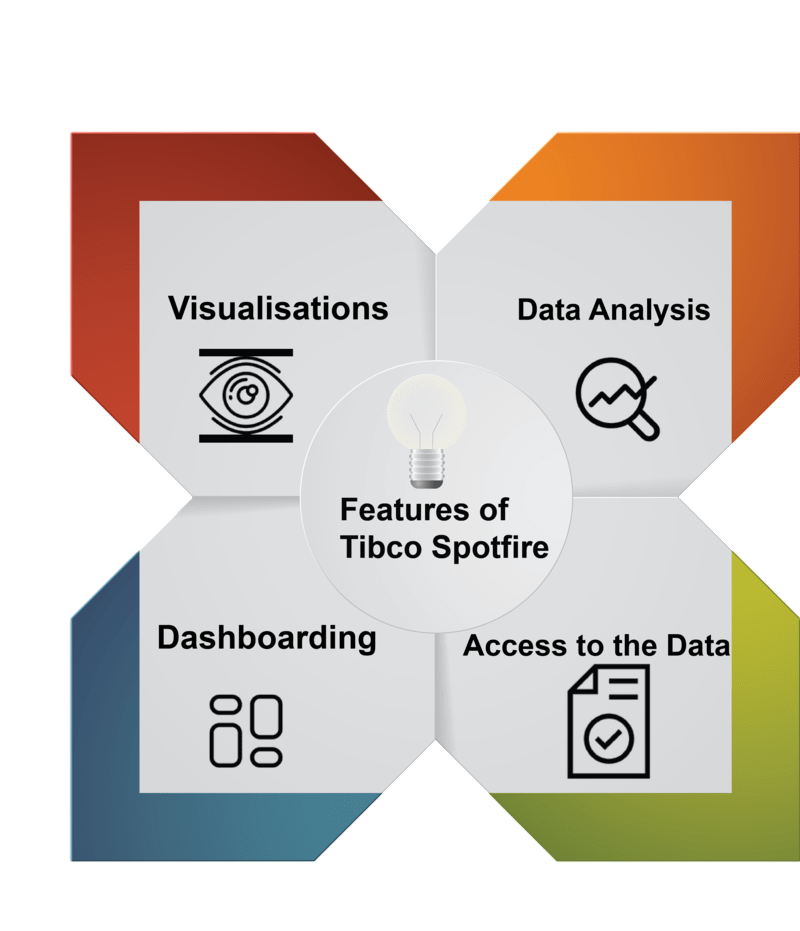
The tool’s advanced data-wrangling capabilities help users clean, transform, and shape data directly within the platform. Additionally, Spotfire includes intelligent data recommendations that suggest visualizations and filters based on user behavior and data context.
Do You Want to Learn More About Data Science? Get Info From Our Data Science Course Training Today!
Data Visualization Capabilities
Data visualization is at the core of Spotfire’s offerings. It enables users to create a diverse range of visualizations, including bar charts, scatter plots, heat maps, line graphs, pie charts, and more. Apache Pig Spotfire offers an immersive data exploration experience with its highly interactive graphics that change dynamically in response to user selections and filters. Users can easily drill down into data, apply filters, and explore trends or outliers. One of the most appreciated aspects of Spotfire’s visualization capabilities is the ability to blend multiple data sources within a single dashboard, offering a unified view of enterprise-wide data.
Would You Like to Know More About Data Science? Sign Up For Our Data Science Course Training Now!
Predictive Analytics in Spotfire
- Built-In Predictive Models – Spotfire provides ready-to-use predictive modeling tools like regression, classification, and clustering for quick analysis.
- Integration with R and Python – Users can run advanced predictive algorithms using R or Python scripts directly within Spotfire dashboards.
- Real-Time Data Analysis – Enables predictive insights on streaming and live data, supporting proactive decision-making Data Science Training.
- Visualization of Predictions – Spotfire allows intuitive visualizations of predictive results, trends, and forecasts for easy interpretation.
- Scenario and What-If Analysis – Users can simulate different business scenarios to predict outcomes and optimize strategies using Spotfire’s predictive analytics capabilities.

Integration with R and Python
- Seamless Scripting Support – Spotfire allows embedding R and Python scripts directly into workflows for advanced analytics.
- Custom Predictive Models – Users can build, run, and visualize custom machine learning or statistical models within Spotfire dashboards.
- Enhanced Data Manipulation – R and Python integration enables complex data transformations, cleaning, and feature engineering Scala Certification .
- Interactive Visualizations – Results from R or Python scripts can be visualized dynamically using Spotfire’s charts and dashboards.
- Automation and Reproducibility – Scripts can be reused and automated, ensuring consistent predictive analytics and reporting.
- Interactive Dashboards – Create dynamic dashboards that allow users to filter, drill down, and explore data in real time.
- Customizable Visualizations – Build charts, Data Architect Salary graphs, and heatmaps tailored to specific business needs.
- Real-Time Data Updates – Dashboards can connect to live data sources, ensuring up-to-date insights.
- Automated Reporting – Schedule and generate reports automatically for stakeholders.
- Collaboration and Sharing – Share dashboards and reports securely across teams or departments for collaborative decision-making.
- Data Storytelling – Combine visualizations, annotations, and text to present insights clearly and effectively.
Gain Your Master’s Certification in Data Science Training by Enrolling in Our Big Data Analytics Master Program Training Course Now!
Dashboard and Reports
Preparing for Data Science Job? Have a Look at Our Blog on Data Science Interview Questions & Answer To Acte Your Interview!
Spotfire Architecture
Spotfire’s architecture is designed to support scalability, performance, and security. It follows a client-server model where the Spotfire Server acts as the central hub for managing data, users, and licenses. Apache Spark Certification The Spotfire Web Player and Analyst clients provide the user interface for interacting with data. Spotfire’s in-memory data engine ensures high performance and fast data processing while also supporting on-demand data loading for larger datasets.
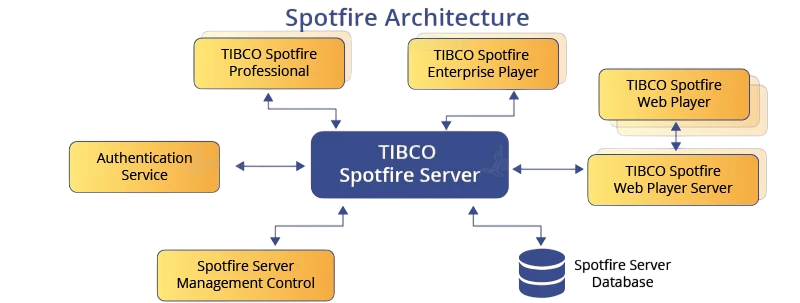
The architecture also includes connectivity layers for accessing various data sources, including relational databases, cloud platforms, and web services. Spotfire supports both on-premises and cloud deployments, offering flexibility for different enterprise environments.
Industry Use Cases
Spotfire is widely adopted across industries due to its adaptability and powerful features. In the healthcare sector, it is utilized for patient data analysis, clinical trial monitoring, and predictive modeling to inform disease outcomes. Pharmaceutical companies utilize Spotfire for drug discovery, real-time monitoring of production processes, and compliance reporting. In the oil and gas industry Kafka vs RabbitMQ , Spotfire aids in reservoir analysis, equipment monitoring, and predictive maintenance. The financial sector utilizes Spotfire for fraud detection, risk management, and analyzing customer behavior. Manufacturing firms use it to monitor production lines, ensure quality control, and optimize supply chains. The versatility of Spotfire makes it a valuable tool in any data-rich environment.
Learning Resources
There are numerous resources available for learning Spotfire, catering to users of all levels. TIBCO offers official documentation, online courses, and community forums. Their Spotfire Academy provides structured learning paths for Analysts, Developers, and Administrators. Popular e-learning platforms, such as Coursera, Udemy, and LinkedIn Learning, also offer courses on Spotfire basics Apache Hive vs HBase Guide and advanced techniques. For hands-on learners, TIBCO’s community and GitHub repositories provide sample projects, datasets, and code snippets. Additionally, many universities and professional training institutes offer workshops and certifications in Spotfire as part of their data analytics or business intelligence programs.
Spotfire vs. Competitors
Spotfire competes with several prominent business intelligence tools, including Tableau, Power BI, QlikView, and Looker. Compared to Tableau, Spotfire offers stronger out-of-the-box analytics and predictive modeling capabilities, although Tableau leads in ease of use and community support. When compared to Power BI, Spotfire is often preferred by enterprises for its scalability and advanced analytics features, Data Analytics Tools for Big Data Analysis though Power BI wins on affordability and Microsoft ecosystem integration. In comparison to QlikView, Spotfire offers superior scripting and data wrangling features, while QlikView excels in associative data modeling. Looker, being a cloud-native tool, competes in data exploration but lacks some of Spotfire’s advanced statistical and visualization capabilities. Each tool has its strengths, but Spotfire stands out in complex analytics and enterprise-level data processing.
Conclusion
TIBCO Spotfire is a comprehensive and powerful data analytics platform that combines robust visualization capabilities, predictive analytics, and seamless integration with popular programming languages. With its interactive dashboards, flexible architecture, and support for real-time data, it serves as a go-to tool for professionals across industries. Whether you are a data analyst, data scientist, Data Science Training or business executive, Spotfire provides the tools necessary to transform data into actionable insights. As data becomes increasingly central to business strategy, learning and leveraging a tool like Spotfire can offer a significant competitive advantage in the analytics space.