Last updated on 28th Oct 2025| 10586
- What Distinguishes Data Science from Business Intelligence?
- Definition of Business Intelligence
- Definition of Data Science
- Scope of Business Intelligence
- Scope of Data Science
- Tools for Business Intelligence
- Tools for Data Science
- Skills Required
- Applications in Industry
- Salary & Career Growth
- BI vs Data Science: Key Differences
- Conclusion
What Distinguishes Data Science from Business Intelligence?
Today’s data-driven business environment overwhelms organizations with vast amounts of information generated from transactions, clicks, and interactions. This data is crucial for business growth, efficiency, and decision-making. However, without proper analysis, it remains just digital noise. Business Intelligence (BI) and Data Science Training are two key fields in modern analytics that help organizations derive meaning and value from raw information. While both areas focus on data, they differ in purpose, methods, and results. Business intelligence analyzes historical and current data to support informed decisions. In contrast, data science employs statistical data models, machine learning, and artificial intelligence (AI) to predict future trends and automate decisions. Understanding the differences between BI and data science is important for students, professionals, and businesses that want to choose the right analytical approach or pursue rewarding careers in data. This guide covers the definitions, scopes, tools, required skills, applications, and career opportunities in both fields.
Definition of Business Intelligence
Business Intelligence (BI) refers to the technologies, processes, and tools that collect, analyze, and visualize data for informed decision-making. BI primarily focuses on structured data—information stored in databases, spreadsheets, or ERP systems—and answers critical business questions like “What happened?” and “Why did it happen?” BI is descriptive and diagnostic. It summarizes business performance through dashboards, charts, and reports that business users can easily understand.
Example:
A retail chain might use BI dashboards to analyze sales across regions and product categories for the past quarter. These insights help executives find underperforming areas and make strategic changes to inventory or pricing.
Definition of Data Science
Data Science is a multidisciplinary field that applies scientific methods, algorithms, and statistical data models to extract insights from structured and unstructured data, such as text, images, videos, and social media content. It combines computer science, mathematics, and domain knowledge to find patterns and predict outcomes. Unlike BI, Data science training focuses on predicting and recommending actions through machine learning and AI data models.
Example:
The same retail company could use Data Science to forecast next quarter’s sales, create personalized recommendation systems for online shoppers, or identify fraudulent transactions.
Scope of Business Intelligence
BI mainly involves reporting, monitoring, and decision support. It lays the groundwork for operational efficiency and performance management. Key areas include:
- Historical Analysis: BI tools help organizations review past performance by looking at sales trends, customer retention, and financial data.
- Data Visualization: BI transforms complex data into easy-to-understand dashboards and visual reports.
- Performance Tracking: Managers can track Key Performance Indicators (KPIs) to assess progress toward goals.
- Accessibility: Modern BI platforms allow even non-technical users to create reports through user-friendly interfaces.
BI’s role is largely focused on business, supporting decision-making across departments like marketing, finance, and operations.

Scope of Data Science
Data Science has a broader and more future-oriented scope. It explores predictive analytics, automation, and innovation through AI-driven technologies.
Interested in Obtaining Your Data Science Certificate? View The Data Science Online Training Offered By ACTE Right Now!
Key functions include:- Predictive Analytics: Using statistical data models and algorithms to forecast demand, customer behavior, or market changes.
- Prescriptive Analytics: Applying optimization and simulation to recommend actions that lead to desired outcomes.
- Handling Complex Data: Processing both structured and unstructured data, like tweets, images, or sensor readings.
AI & Machine Learning: Supporting innovations like recommendation systems, self-driving vehicles, and intelligent chatbots. In summary, Data Science drives digital transformation, promoting intelligent automation and predictive strategies.
Tools for Business Intelligence
BI tools simplify data exploration and visualization, making insights accessible to decision-makers. Popular tools include:
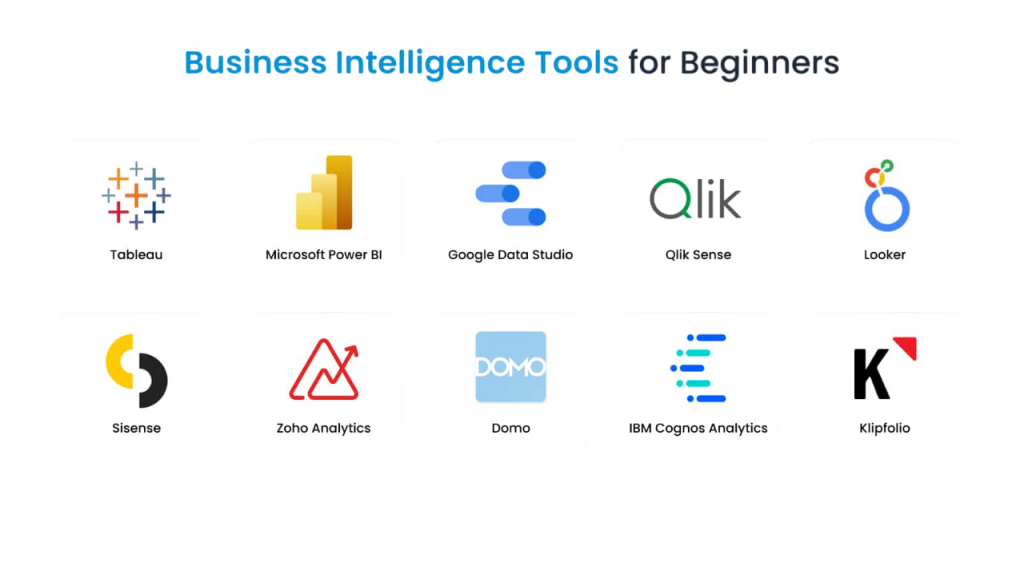
These tools are easy to use and are often employed by business analysts and managers without programming skills.
Tools for Data Science
Data Science requires technical tools for data cleaning, modeling, and large-scale computation. Key tools include:
- Python: The most-used programming language in Data Science, with libraries like Pandas, NumPy, Scikit-learn, TensorFlow, and PyTorch.
- R: Focused on statistical analysis, data visualization, and research.
- Jupyter Notebooks: An interactive environment for running code, creating visualizations, and documenting processes.
- Apache Spark & Hadoop: Frameworks for processing big data across distributed systems.
- SQL & NoSQL Databases: Essential for querying both structured and unstructured data.
- Matlab & SAS: Used for advanced statistical analysis and modeling in research settings.
Compared to BI tools, these require programming skills and a strong math background.
Skills Required
Skills for Business Intelligence:
- Data visualization and dashboard creation
- SQL and database querying
- Business knowledge and critical thinking
- Understanding of KPIs and organizational metrics
- Proficiency in BI tools (Power BI, Tableau, Qlik)
- Programming knowledge (Python, R, or Java)
- Strong foundation in statistics and linear algebra
- Machine learning and AI model development
- Data wrangling and preprocessing skills
- Experience with big data platforms (Spark, Hadoop)
- Ability to explain complex insights to non-technical stakeholders
- Retail: Monitor sales performance and customer segments.
- Banking: Generate compliance and risk management reports.
- Healthcare: Evaluate hospital efficiency and patient outcomes.
- Manufacturing: Analyze production metrics and supply chain performance.
- Education: Assess student performance and institutional KPIs.
- E-commerce: Create recommendation engines and predict customer churn.
- Finance: Identify fraud and improve algorithmic trading.
- Healthcare: Provide predictive diagnosis and tailored treatment.
- Transportation: Support self-driving vehicles and optimize routes.
- Entertainment: Offer personalized content suggestions, like those from Netflix or Spotify.
Skills for Data Science:
BI professionals act as interpreters for business leaders, while Data Scientists create predictive systems.
Are You Preparing for Data Science Jobs? Check Out ACTE’s Data Science Interview Questions and Answers to Boost Your Preparation!
Applications in Industry
Applications of Business Intelligence:
Applications of Data Science:
Salary & Career Growth
Careers in Business Intelligence:
Typical roles are BI Analyst, BI Developer, Data Analyst, and Reporting Analyst.
Average Salaries (India, 2025): ₹6–12 LPA Average Salaries (US, 2025): $70,000–$110,000
Career growth may lead to positions like BI Manager, Analytics Director, or Chief Data Officer (CDO). BI analyst careers provide stability and strong demand in traditional industries such as finance, retail, and government.
Careers in Data Science:
Roles include Data Scientist, Machine Learning Engineer, AI Engineer, and Data Engineer.
Average Salaries (India, 2025): ₹10–20 LPA
Average Salaries (US, 2025): $110,000–$150,000
Data Science jobs offer higher earnings and quick growth, particularly in fields like AI, robotics, and digital transformation. However, they require ongoing learning due to rapidly evolving technologies.
To Explore Data Science in Depth, Check Out Our Comprehensive Data Science Online Training To Gain Insights From Our Experts!
BI vs Data Science: Key Differences
| S.No | Feature | Data Analytics | Data Science |
|---|---|---|---|
| 1 | Focus | Descriptive & diagnostic | Predictive & prescriptive |
| 2 | Data Type | Structured | Structured + unstructured |
| 3 | Tools | Power BI, Tableau, Qlik | Python, R, Spark, TensorFlow |
| 4 | Users | Business Analysts, Managers | Data Scientists, ML Engineers |
| 5 | Skills Needed | SQL, Visualization, Business Knowledge | Programming, ML, Statistics |
| 6 | Output | Reports, Dashboards, KPIs | Predictive data models, Automation |
| 7 | Decision-Making | Operational & Tactical | Strategic & Innovative |
| 8 | career growth Focus | Stable and Business-Oriented | Dynamic and Tech-Focused |
Gain Your Master’s Certification in Data Science Training by Enrolling in Our Data Science Master Program Training Course Now!
Conclusion
In the changing world of analytics, Business Intelligence and Data Science are not rivals but partners. Each plays a unique role in the data analytics ecosystem. BI helps businesses understand their current and past performance for efficient decision-making. Data Science drives innovation by predicting future situations and automating decisions with advanced algorithms. From a career perspective, BI analyst suits those with a keen business mindset, while Data Science is better for those inclined towards programming, math, and AI. Today, organizations are increasingly blending both BI for operational insight and Data science training for strategic foresight. Professionals who can connect these two areas—combining business insight with data modeling—will be crucial in shaping the future of analytics.