Last updated on 31st Oct 2025| 10755
- Apache Zeppelin for Data Visualization
- What is Apache Zeppelin?
- Key Features of Apache Zeppelin
- Benefits of Using Zeppelin for Data Visualization
- How to Set Up Apache Zeppelin
- Creating Your First Visualization
- Extreme Flexibility
- Common Use Cases for Apache Zeppelin
- Conclusion
Apache Zeppelin for Data Visualization
In today’s quickly changing digital environment, showing data visually is very important. It helps us change basic information into useful understanding. Apache Zeppelin, which is a strong, free notebook, makes this easy to do. It lets people write code, ask questions, and see the results all in the same place. Zeppelin works with many coding languages such as Python, SQL, and Scala. To master tools like Zeppelin and apply them in real-world analytics workflows, explore Data Analytics Training a hands-on program that covers multi-language notebooks, data visualization, and collaborative analysis techniques essential for modern data teams. It fits well with big data tools like Apache Spark and Hive. This makes it flexible for different types of data work. Interactive dashboards and real-time teamwork features make Zeppelin great for groups working on data projects. Team members can observe and contribute simultaneously, which ensures seamless workflows and boosts productivity. Data scientists can use Zeppelin to make models and understand trends. Developers can use it to test code and create data pipelines. Business analysts can use it to make reports and dashboards. Apache Zeppelin assists anyone in learning about data visually and making better choices. It simplifies data exploration and promotes deeper insights across different roles and responsibilities.
What is Apache Zeppelin?
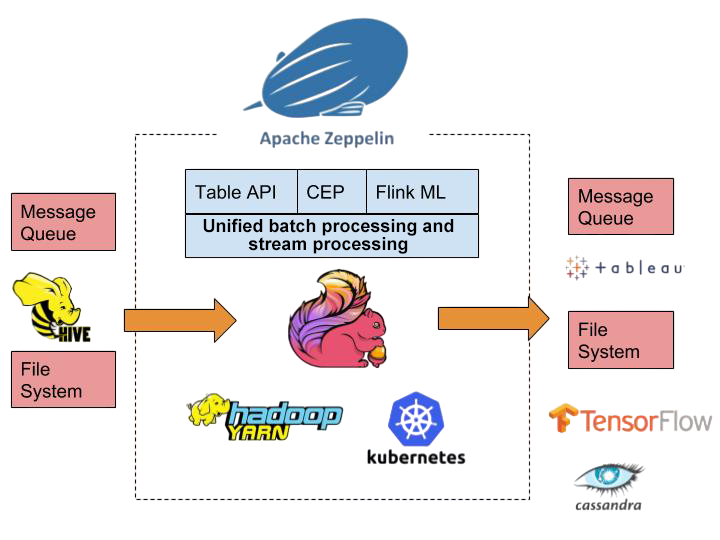
Apache Zeppelin is a versatile web-based notebook designed to empower users in the exploration and visualization of data. Its architecture supports a variety of programming languages and data sources through its implementation of multiple interpreters. This feature enables Zeppelin to seamlessly integrate with diverse data processing engines like Apache Spark, Apache Flink, and others. To understand how these integrations scale across distributed systems, explore Apache Hadoop a foundational guide that explains how Hadoop’s ecosystem supports large-scale data storage, parallel processing, and real-time analytics across enterprise environments. The notebook’s design is intentionally geared toward compatibility with big data platforms.
Such aptitude renders it exceptionally useful for large-scale data analysis projects where handling massive datasets is a routine requirement. Users can develop detailed narratives within Zeppelin notebooks, combining code snippets, interactive charts, and descriptive text annotations. This combined approach fosters collaborative data storytelling, allowing teams to share insights, methodologies, and results efficiently. The collaborative features of Zeppelin extend beyond simple sharing. Multiple users can work on the same notebook simultaneously, enabling real-time collaboration and knowledge sharing. Version control systems integration lets teams track changes and revert to earlier versions if needed. This collaborative aptitude makes Zeppelin suited for research teams, data science departments, and educational settings where collaborative learning is emphasized.
Interested in Obtaining Your Data Science Certificate? View The Data Science Online Training Offered By ACTE Right Now!
Key Features of Apache Zeppelin
- Multi-language Support: Run Python, SQL, Scala, and more in one notebook.
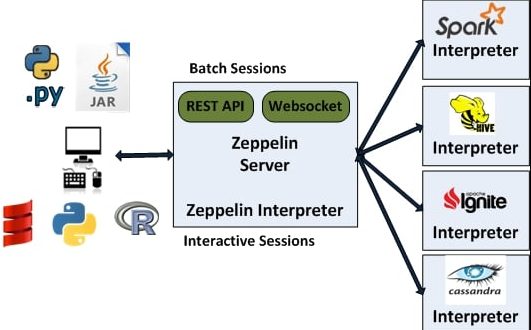
- Interpreter Integration: Connect to Spark, Hive, Elasticsearch, and other data engines.
- Interactive Dashboards: Build dynamic charts and graphs with real-time updates.
- Collaborative Editing: Share notebooks and work simultaneously with team members.
- Custom Visualizations: Tailor charts and layouts to match specific analytical needs.
- Simplifies Complex Data: Converts raw datasets into clear, visual formats.
- Boosts Productivity: Enables quick analysis without switching tools.
- Enhances Collaboration: Teams can co-edit and share insights instantly.
- Supports Big Data Workflows: Integrates with Hadoop, Spark, and more.
- Improves Decision-Making: Visual data leads to faster, smarter choices.
- Creating a New Notebook: Launch Apache Zeppelin and start a fresh notebook using the “Create new note” option.
- Selecting an Interpreter: Choose the appropriate interpreter like %sql, %python, or %spark based on your data source.
- Writing a Query: Enter a simple query to fetch or generate data from your connected source.
- Running the Code: Execute the query by clicking the play button or pressing Shift + Enter.
- Viewing the Output: Review the tabular result displayed directly below your code block.
- Choosing a Chart Type: Click the chart icon to select from bar, pie, line, scatter, or area charts.
- Customizing the Chart: Adjust axes, labels, colors, and legends to enhance clarity and visual appeal.
- Saving the Visualization: Save your notebook to preserve the visualization and share it with collaborators.
- Business Intelligence Dashboards: Build interactive dashboards to monitor KPIs, trends, and performance metrics in real time. These dashboards empower teams to make data-driven decisions and respond quickly to changing business conditions.
- To master this capability across large-scale datasets, explore Gleam of Analytics Using Apache Spark a specialized course that teaches real-time data processing, visualization techniques, and Spark-powered analytics for enterprise-grade performance tracking.
- Data Science Experimentation: Run exploratory data analysis, model training, and result visualization in a single notebook.
- ETL Process Visualization: Track and visualize extract-transform-load workflows across multiple data sources and stages.
- Real-Time Monitoring Systems: Display live metrics and alerts using streaming data integrations with Spark or Flink.
- Collaborative Reporting Tools: Share notebooks with teams for joint analysis, annotations, and decision-making.
To Explore Data Science in Depth, Check Out Our Comprehensive Data Science Online Training To Gain Insights From Our Experts!
Benefits of Using Zeppelin for Data Visualization

How to Set Up Apache Zeppelin
Apache Zeppelin is designed as a web-based notebook to support users in their data exploration and visualization activities. It makes it easy to handle different programming languages and data sources via its interpreter system. With its design geared toward compatibility with big data platforms, Zeppelin serves as a tool for conducting data analysis at scale. To build expertise in scalable analytics workflows using tools like Zeppelin, explore Data Analytics Training a comprehensive course that covers multi-source integration, big data compatibility, and real-time analysis techniques for enterprise-grade insights. Within Zeppelin, it’s simple to create notebooks that integrate code, charts, and descriptive text, which helps teams work together to communicate data findings.
To get Apache Zeppelin up and running, begin by downloading the latest version from the official website. After downloading, finish the installation process and start the Zeppelin server. You can then reach the notebook interface through your web browser. This is where you set up interpreters that match your data sources, such as Spark, Hive, or MySQL. After the set-up is done, start creating notebooks, writing queries, and designing visualizations. To enhance these workflows with powerful search and indexing capabilities, explore What is Apache Solr a detailed guide that explains how Solr integrates with data platforms to deliver fast, scalable search experiences across structured and unstructured datasets. Before you begin, confirm that all connections are working correctly and that your data is validated; these prior steps are important before using Zeppelin to implement dashboards.
Creating Your First Visualization
To create a visualization in Zeppelin, follow these steps: write your query using supported languages, format the output using built-in chart types, and customize the layout for clarity. For deeper integration with distributed data processing, explore Learn Apache Spark and Its Capabilities a practical guide that shows how Spark works with Zeppelin to deliver scalable analytics, real-time insights, and interactive visualizations across large datasets.
Gain Your Master’s Certification in Data Science Training by Enrolling in Our Data Science Master Program Training Course Now!
Extreme Flexibility
Apache Zeppelin’s extensibility is something people love most about it. You’re not stuck with just the chart types it comes with or only certain data sources. Developers and analysts have the freedom to make their own visuals, combine different languages such as Python, SQL, and Scala, and link up to various data platforms like Spark, Hive, and Elasticsearch. To understand how structured data moves between these platforms and relational databases, explore What Is Apache Sqoop a focused guide that explains Sqoop’s role in data import/export, its integration with Hadoop ecosystems, and how it streamlines big data workflows. This adaptability means you can adjust your notebooks to fit your particular analytical needs. You can put together interactive dashboards and even create your own interpreters. Whether you’re showing real-time data or looking into past patterns, Zeppelin changes to match how you work, making it a helpful tool for telling data stories in a personal and scalable way.
Are You Preparing for Data Science Jobs? Check Out ACTE’s Data Science Interview Questions and Answers to Boost Your Preparation!
Common Use Cases for Apache Zeppelin
Conclusion
Apache Zeppelin is a game-changer in the world of data visualization. Its interactive notebooks, multi-language support, and real-time collaboration features make it a top choice for data professionals. To harness its full potential in enterprise analytics workflows, explore Data Analytics Training a skill-building program that covers Zeppelin’s core features, integration with big data platforms, and collaborative techniques for scalable data exploration. Whether you’re analyzing big data, building dashboards, or sharing insights with your team, Zeppelin simplifies the process and enhances the impact of your work. Start using Apache Zeppelin today to unlock the full potential of your data.