Last updated on 14th Oct 2025| 10485
- Introduction to Data Analytics in Excel
- Why Excel is Still a Leading Tool for Data Analytics
- Understanding Excel’s Core Features for Data Analysis
- Advanced Excel Functions for Data Analytics
- Visualizing Data with Charts and Graphs in Excel
- Excel Power Query and Power Pivot for Enhanced Data Handling
- Automating Data Analysis with Excel Macros and VBA
- Best Practices for Effective Data Analysis in Excel
- Conclusion
Introduction to Data Analytics in Excel
Data analytics has become an essential part of decision-making in today’s business environment. Organizations rely on data-driven insights to stay competitive, streamline operations, and optimize performance. While there are several specialized tools for data analytics, Microsoft Excel remains one of the most popular and widely-used platforms for analyzing and visualizing data. Excel, traditionally known for its spreadsheet functionalities, offers powerful data analytics features that make it a versatile Data Analytics Training tool for handling complex datasets. Whether you are a beginner looking to understand the basics or an advanced user aiming to perform sophisticated data analysis, mastering Excel’s capabilities will empower you to extract meaningful insights from your data. In this blog, we will explore how to harness Excel’s full potential for data analytics, from the core features to advanced techniques and tools.
Why Excel is Still a Leading Tool for Data Analytics
Despite the emergence of more specialized BI tools, Excel continues to be a cornerstone for data analysts and businesses. But what makes Excel so enduring in the world of data analytics?
Key Reasons Excel Stands Out:
- Widespread Adoption: Excel is ubiquitous across industries and organizations. Its familiarity and easy accessibility make it an essential Big Data is Transforming Retail Industry tool for data analysis in both small businesses and large enterprises.
- Versatility: Excel is not limited to basic functions. It offers a robust set of tools, from basic data manipulation to complex statistical analysis and predictive modeling.
- Integration with Other Tools: Excel integrates well with other data management tools like SQL Server, Power BI, and external data sources, making it a bridge between various data platforms.
- Affordability: Compared to expensive BI tools, Excel is an affordable option for both individuals and businesses, especially when combined with Microsoft Office 365.
Interested in Obtaining Your Data Analyst Certificate? View The Data Analytics Online Training Offered By ACTE Right Now!
Understanding Excel’s Core Features for Data Analysis
Excel offers several features that serve as the foundation for data analytics. Here are the core features you should familiarize yourself with:
- Data Entry and Organization: Start by importing and organizing your data efficiently. Use Excel’s grid-like structure for creating tables, defining columns, and organizing rows.
- Sorting and Filtering: Sorting helps in organizing data in ascending or descending order, while filtering allows you to focus on specific subsets of your data Big Data Can Help You Do Wonders .
- Pivot Tables: Pivot Tables are a powerful feature for summarizing large datasets. They help you aggregate, analyze, and present data in a concise format.
- Formulas and Functions: Excel provides a variety of built-in functions like SUM, AVERAGE, VLOOKUP, and COUNTIF, which help you perform basic and advanced calculations on your data.
To Explore Data Analyst in Depth, Check Out Our Comprehensive Data Analytics Online Training To Gain Insights From Our Experts!
Advanced Excel Functions for Data Analytics
Once you have mastered the basic features, Excel offers more advanced functions that can help you perform sophisticated data analysis.
Key Advanced Functions:
- VLOOKUP and INDEX-MATCH: These functions help you retrieve data from different tables or datasets based on a common identifier.
- IF Statements: Conditional statements, such as the IF function, Become a Big Data Analyst allow you to create logic-based outputs depending on specific criteria.
- Data Analysis Toolpak: A collection of statistical analysis tools, including regression analysis, ANOVA, and histograms, which can help you with in-depth data exploration.
- Array Formulas: Array formulas let you perform complex calculations over multiple cells or arrays of data, offering more flexibility than regular formulas.

Excel Power Query and Power Pivot for Enhanced Data Handling
Excel Power Query and Power Pivot are powerful tools that revolutionize the way data is managed, transformed, Core Features for Data Analysis and analyzed. Power Query enables users to easily import, clean, and combine data from multiple sources without complex coding, ensuring accuracy and efficiency. Power Pivot, on the other hand, allows for advanced data modeling, creating relationships between large datasets, Data Analytics Training and performing sophisticated calculations using Data Analysis Expressions (DAX). Together, these tools empower users to handle vast amounts of data, build insightful dashboards, and make data-driven decisions with greater speed and precision.
Gain Your Master’s Certification in Data Analyst Training by Enrolling in Our Data Analyst Master Program Training Course Now!
Visualizing Data with Charts and Graphs in Excel
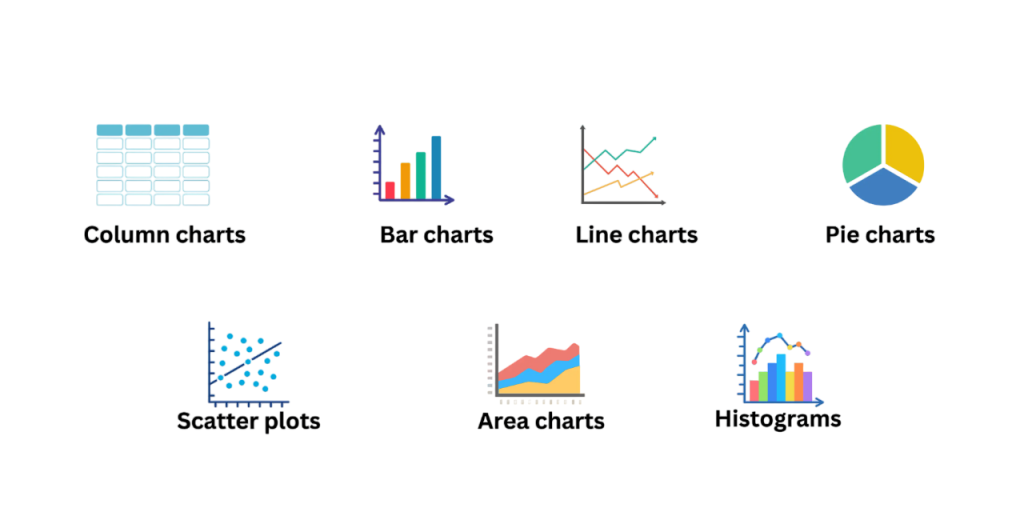
Data visualization is a key aspect of data analysis. Excel offers a range An ETL Audit Process of tools for transforming raw data into informative charts and graphs that can help you communicate insights more effectively.
Key Excel Visualization Tools:
- Bar and Column Charts: Ideal for comparing data across categories, such as sales performance by region.
- Line and Area Charts: Great for tracking trends over time, such as revenue growth over the last few years.
- Pie Charts: Useful for illustrating proportions, such as market share distribution among competitors.
- Scatter Plots: Best for showing correlations between two variables, such as customer satisfaction vs. purchase frequency.
Are You Preparing for Data Analyst Jobs? Check Out ACTE’s Data Analyst Interview Questions and Answers to Boost Your Preparation!
Automating Data Analysis with Excel Macros and VBA
For recurring data analysis tasks, Excel Macros and Visual Basic for Applications (VBA) can help you automate and streamline your workflow. Macros record your actions and allow you to replay them, while VBA offers a programming language for creating more complex automation routines. Excel Macros and VBA (Visual Basic for Applications) provide a powerful way to automate repetitive tasks and streamline Cassandra Keyspace data analysis. With Macros, users can record sequences of actions to be executed with a single click, saving time and reducing manual errors. VBA takes automation further by allowing custom scripts, advanced logic, and integration with other applications, enabling complex data manipulations and reporting. By leveraging these tools, analysts can increase efficiency, maintain consistency, and focus on extracting actionable insights rather than performing routine operations.
Best Practices for Effective Data Analysis in Excel
Effective data analysis in Excel requires a combination of structured approaches, proper planning, and the right tools. Start by organizing your data with clear headings, consistent formats, and proper data types to ensure accuracy. Utilize Excel’s built-in functions, tables, and conditional formatting to summarize and visualize data efficiently. Leveraging features like PivotTables, Data Architect Salary Power Query, and charts helps uncover patterns and insights quickly. Additionally, documenting your steps, validating results, and applying error checks ensures reliability and reproducibility. Following these best practices allows analysts to make data-driven decisions confidently and efficiently.
Conclusion
Microsoft Excel remains an indispensable tool for data analytics, offering a rich set of features that cater to both beginners and advanced users. From basic functions to advanced techniques like Power Query, Power Pivot, and VBA, Excel provides everything you need Data Analytics Training to conduct thorough data analysis and generate meaningful insights. By mastering these tools and best practices, you can harness the full power of Excel Power Query for data analytics and enhance your decision-making processes, Core Features for Data Analysis making it a powerful asset in your data analysis toolkit.