Last updated on 01st May 2025| 10715
- Introduction to Gantt Charts
- What is a Gantt Chart?
- Key Components of a Gantt Chart
- How to Create a Gantt Chart
- How to Use Gantt Charts in Project Management
- Benefits of Using Gantt Charts
- Common Mistakes to Avoid When Using Gantt Charts
- Advanced Features in Gantt Charts
- Best Practices for Managing Gantt Charts
- Gantt Chart Tools and Software
- Case Study: How Gantt Charts Improved Project Delivery
- Conclusion
Introduction to Gantt Charts
The Gantt chart is named after its inventor, Henry L. Gantt, who first introduced it in the 1910s. Initially, Gantt charts were used in industrial production projects, but over time, they evolved to become a standard tool in project management, suitable for any project. The chart helps project managers and teams understand the sequence of tasks, deadlines, and the dependencies between tasks, which is crucial for smooth project execution. For those looking to deepen their knowledge of project management, PMP Training offers valuable insights. Gantt charts allow for a visual timeline, enabling easier communication, project tracking, and decision-making.
What is a Gantt Chart?
A Gantt chart is a bar chart that represents a project schedule over time. It visually displays tasks along a timeline, showing when each task starts, how long it will take, and when it finishes. Each task is represented as a horizontal bar, with the length and position of the bar corresponding to the task’s duration and start and end dates. Milestones, dependencies, and other project elements may also be shown on the Gantt chart for further clarity. Unlike other project management tools, which may rely heavily on lists and numbers, Gantt charts are especially effective because they present information visually. This makes it easy to grasp how various tasks are related to one another and to see the overall progression of the project. For a deeper understanding of how to use Gantt charts effectively, a Gantt Chart Tool Tutorial can help guide you through the process.
Become a Project Management expert by enrolling in this PMP Training Online Course today.
Key Components of a Gantt Chart
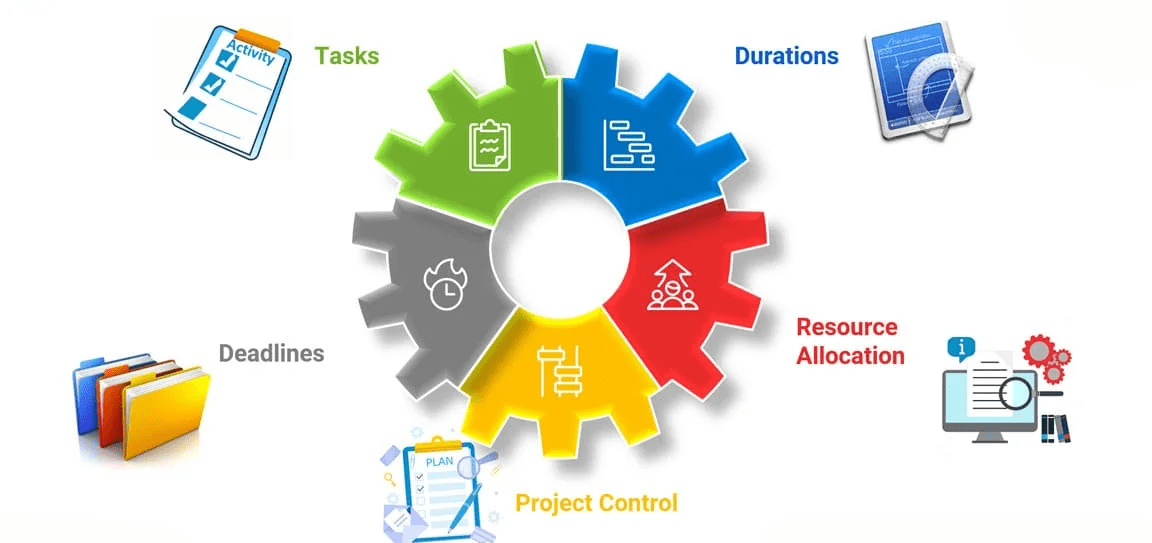
A Gantt chart consists of several key components that work together to provide a comprehensive overview of a project’s timeline:
3.1. TasksTasks (or activities) are the individual units of work that need to be completed within the project. Each task is listed on the chart’s vertical axis, with its start and end dates indicated by horizontal bars that span the timeline.
3.2. Time AxisThe time axis runs along the top of the Gantt chart and represents the project’s timeline. Depending on the project’s scale and duration, it can display time in various units, such as days, weeks, months, or even years.
3.3. MilestonesMilestones are significant events or achievements within the project, such as completing a primary task or phase. Milestones are typically represented as small diamond-shaped symbols on the Gantt chart.
3.4. DependenciesDependencies show how tasks are connected. For example, Task B may depend on the completion of Task A before it can begin. Arrows connecting the functions on the chart depict these relationships.
Advance your Project Management career by joining this PMP Training Online Course now.
How to Create a Gantt Chart
Creating a Gantt chart can be done manually or using specialized software. Let’s explore both approaches:
4.1. Manual CreationTo create a Gantt chart manually, you can follow these steps:
- List all tasks: Write down all the tasks and sub-tasks that must be completed for the project.
- Determine task durations: Estimate the start and end dates for each task.
- Plot the tasks on a timeline: Create a horizontal axis representing the project’s timeline. For each task, draw a bar that starts at the task’s start date and ends at its completion date.
- Identify dependencies: Use arrows or lines to show dependencies between tasks.
- Update the chart regularly: As tasks progress, update the chart to reflect any changes in deadlines or task statuses. 4.2. Using Gantt Chart Software
- Input tasks and deadlines quickly
- Automatically generate the Gantt chart
- Easily modify task durations or dependencies
- Collaborate with your team and update the chart together
- Overloading the chart: Too many tasks and details on a single chart can become overwhelming. Stick to high-level tasks and milestones for clarity.
- Ignoring dependencies: Failing to set dependencies properly can confuse task relationships and delays.
- Neglecting to update the chart: A Gantt chart is a living document. If it’s not updated regularly, it can quickly become obsolete and inaccurate.
- Over-complicating the timeline: Keep the timeline simple, especially for smaller projects. Avoid adding excessive layers of detail or complexity that could hinder understanding.For those looking to deepen their project management knowledge, PMP Training can provide valuable guidance.
- Microsoft Project: A robust tool for larger projects, Microsoft Project allows for detailed Gantt chart creation, resource allocation, and progress tracking.
- Trello: Trello is a user-friendly tool that integrates Gantt charts through third-party integrations like Planyway and TeamGantt.
- Asana: Asana offers a Timeline feature that allows users to create Gantt-style charts to manage project schedules and dependencies.
- Monday.com: Monday.com provides a visual timeline that offers Gantt chart functionality and customizable project management workflows.
- Smartsheet: Smartsheet is another excellent tool for creating Gantt charts. It has collaborative features and powerful project management capabilities.
While manual Gantt charts can be effective for small projects, project management software is usually more efficient, especially for larger or more complex projects. Tools like Microsoft Project, Smartsheet, and Trello offer user-friendly platforms for real-time creation, tracking, and modifying Gantt charts.To learn more about performance standards, understanding What is Benchmarking can provide valuable insights.
Most software options allow you to:
How to Use Gantt Charts in Project Management
Gantt charts can be used throughout the project lifecycle to help plan, track, and manage tasks.
5.1. Task Tracking and ManagementGantt charts help project managers keep track of task progress, ensuring that everything is on schedule. They allow for easy identification of which tasks are behind or ahead of schedule.
5.2. Resource AllocationGantt charts help ensure efficient resource allocation by displaying all tasks along with their timelines. You can see if any resources are being overburdened or underutilized and make adjustments accordingly.
5.3. Milestone TrackingMilestones are essential in tracking a project’s progress. Gantt charts help project managers visualize these milestones and assess the project’s progress toward completion.
5.4. Identifying Project DelaysGantt charts highlight delays by visually showing when tasks are not completed on time. This allows managers to take corrective actions, such as reallocating resources or adjusting the project schedule.

Benefits of Using Gantt Charts
6.1. Clear VisualizationGantt charts provide a simple yet effective way to visualize the entire project timeline, allowing all team members to understand the scope and deadlines at a glance.
6.2. Enhanced CommunicationA visual timeline improves communication between team members and stakeholders. Everyone can see which tasks are in progress, which are completed, and where the project stands.To gain a deeper understanding of how these processes relate to project management, learning about Supply Chain Management can be highly beneficial.
6.3. Better Resource ManagementGantt charts display tasks and their timelines, allowing project managers to see when and where resources are needed, helping to avoid bottlenecks and resource conflicts.
6.4. Improved AccountabilityThe Gantt chart tracks tasks and deadlines, enhancing accountability. Team members can easily see what tasks they are responsible for and when they are expected to complete them.
Common Mistakes to Avoid When Using Gantt Charts
While Gantt charts are powerful, improper use can lead to confusion or inefficiencies. Here are some common mistakes to avoid:
Are you getting ready for your PMP interview? Check out our blog on PMP Interview Questions and Answers!
Advanced Features in Gantt Charts
Many advanced Gantt chart features offer enhanced functionality for managing more complex projects.
8.1. Task Dependencies and PredecessorsLinking tasks with dependencies can create a clear, organized flow of project activities. For example, Task B cannot begin until Task A is completed. Gantt charts allow you to specify these relationships easily.
8.2. Critical Path Method (CPM)The Critical Path Method identifies the dependent task sequence that determines the minimum project duration. The critical path is the longest path through the project, and any delays in critical tasks will delay the entire project.
8.3. Resource Management and AllocationAdvanced Gantt charts allow you to allocate resources (human or material) to specific tasks, helping you monitor workloads and resource constraints.
8.4. Progress TrackingMany Gantt chart tools allow you to track the progress of individual tasks. By shading or color-coding the task bars, you can quickly identify how much work has been completed and what remains to be done.
Best Practices for Managing Gantt Charts
To get the most out of your Gantt chart, follow these best practices:
9.1. Keep it SimpleDon’t overcomplicate your Gantt chart with too many tasks or details. Focus on the major tasks and milestones that will help drive the project forward.
9.2. Update RegularlyA Gantt chart is only useful if it reflects the project’s current status. Regularly update the chart to reflect changes in timelines, resources, or task progress. For further guidance, check out PMP & Tutorial to enhance your project management skills.
9.3. Focus on Key MilestonesWhile tasks are essential, milestones are key indicators of project success. To track major achievements, emphasize milestones in your Gantt chart.
9.4. Collaborate with Your TeamUse the Gantt chart to facilitate communication within your team. Regularly check in with team members to discuss task progress and ensure that deadlines are being met.
Gantt Chart Tools and Software
Several tools and software, from simple templates to sophisticated project management platforms, are available to help you create and manage Gantt charts.
Case Study: How Gantt Charts Improved Project Delivery
One real-world example of a project that benefited from using a Gantt chart is constructing a commercial building. The project manager, tasked with overseeing various stages of the build, used a Gantt chart to map out all tasks, from foundation work to final inspections. The project manager could track progress visually by breaking the project into smaller tasks and setting deadlines for each phase, ensuring that each task was completed on schedule. The Gantt chart helped identify dependencies between tasks, such as when the foundation needed to be completed before framing could begin, allowing for better planning and resource allocation. If any task was delayed, the Gantt chart provided immediate insight into how this would affect the rest of the project, enabling the manager to make adjustments, such as reallocating resources or rescheduling non-dependent tasks to prevent further delays. As a result, the project was completed on time, within budget, and met the quality standards, demonstrating the power of a Gantt chart in keeping complex projects on track.For more on how Gantt charts differ from Traditional Project Management, check out this resource.
Conclusion
Gantt charts are an essential tool for project managers, providing an intuitive, visual way to plan, track, and manage projects. These charts help organize tasks, monitor deadlines, and allocate resources efficiently. Gantt charts make it easier to understand how each part of a project contributes to the overall timeline by visually representing tasks, durations, and dependencies. Whether managing a small team or overseeing a complex, multi-phase project, mastering Gantt charts helps you stay organized, avoid delays, and keep the project on track. For those looking to enhance their project management skills, PMP Training offers an excellent opportunity to gain expertise. Gantt charts also serve as a powerful communication tool, enabling project managers to update stakeholders on progress and adjust plans as needed. By understanding the key components of Gantt charts, such as task lists, timelines, and dependencies, and learning how to create and manage them effectively, you’ll be equipped to improve your project management skills, ensuring that your projects are completed successfully and on time.