
Last updated on 31st Jul 2025| 11692
- Financial Statement Analysis
- Components of Financial Statements
- Ratio Analysis
- Cash Flow Analysis
- Profitability Ratios
- Liquidity Ratios
- Solvency Ratios
- Dupont Analysis
- Limitations and Red Flags
- Conclusion
Financial Statement Analysis
Financial Statement Analysis is a crucial process by which stakeholders evaluate a company’s financial health, operational performance, and future prospects. It involves examining and interpreting financial reports to make informed decisions related to investment, lending, management, and strategic planning. Financial statement analysis is a key tool for understanding a company’s financial situation. It offers valuable insights that help various stakeholders make smart decisions. By evaluating profitability, liquidity, solvency, and cash flow, this process allows investors, creditors, management, and regulators to assess an organization’s financial health in detail. This varied approach helps stakeholders gauge investment potential and lending risks. It also aids in planning, following regulations, and improving performance. By carefully examining financial metrics, organizations can identify strengths, reduce risks, compare performance against industry standards, and allocate resources more efficiently. This thorough analysis boosts investor confidence by ensuring transparency, spotting financial irregularities, and giving a clear, objective view of a company’s financial position. In the end, financial statement analysis turns complex numbers into useful information that guides important business choices and supports long-term success.
Do You Want to Learn More About Database? Get Info From Our Database Online Training Today!
Components of Financial Statements
Components of financial statements are important tools that offer key insights into a company’s financial health and performance. The Balance Sheet provides a summary of the organization’s financial status, detailing assets, liabilities, and shareholders’ equity using the basic formula of Assets = Liabilities + Equity. The Income Statement shows the company’s performance by tracking revenues and expenses, which leads to the calculation of net income. This figure reflects the organization’s profitability over a set period.
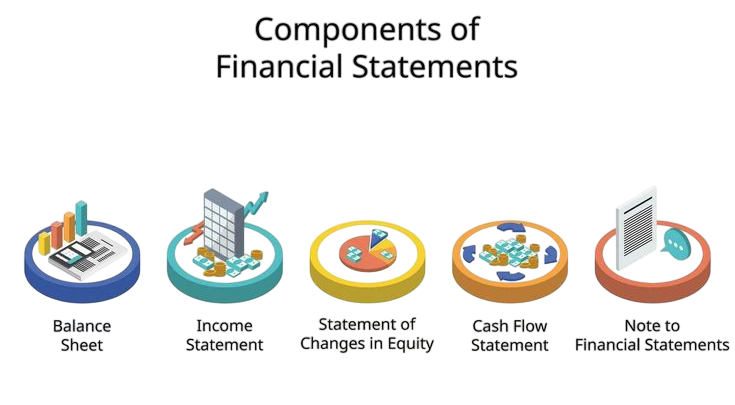
The Cash Flow Statement improves financial transparency by classifying cash flows from operating, investing, and financing activities. Meanwhile, the Statement of Changes in Equity highlights changes in ownership interests due to actions like dividend payments, new share issuances, or buybacks. Together, these related financial documents give stakeholders a clear view of the company’s financial situation, which helps them make informed decisions and plan strategically.
Ratio Analysis
Ratio analysis is a fundamental technique that transforms raw financial data into meaningful indicators of performance and financial health. Ratios are expressed as percentages, decimals, or multiples and categorized into:
- Profitability Ratios
- Liquidity Ratios
- Solvency Ratios
- Efficiency Ratios
- Market Ratios
Ratio analysis helps in benchmarking against historical data, competitors, or industry standards.
Would You Like to Know More About Database? Sign Up For Our Database Online Training Now!
Cash Flow Analysis
Cash flow analysis evaluates the company’s ability to generate cash, which is critical for meeting obligations, investing, and sustaining operations.
Components:
- Operating Cash Flow: Core business-generated cash; positive cash flow indicates healthy operations.
- Investing Cash Flow: Cash used for buying/selling fixed assets, investments.
- Financing Cash Flow: Cash received from or paid to shareholders and creditors.
Importance:
Cash flow analysis is an essential tool for understanding finances. It helps organizations spot potential cash flow issues and gauge their true financial health. By closely looking at the connection between reported profits and actual cash flow, this method offers important insights into a company’s financial flexibility and operational stability. It also shows how much an organization depends on outside funding, giving a clear picture of its cash management and financial strength. With this detailed evaluation, businesses can identify and tackle potential financial problems early, leading to stronger and more strategic financial planning.

Profitability Ratios
Measure the ability to generate profits relative to sales, assets, or equity.
- Gross Profit Margin: $$\text{Gross Profit Margin} = \frac{\text{Gross Profit}}{\text{Sales}} \times 100$$ Indicates production efficiency.
- Operating Profit Margin: $$\frac{\text{Operating Income}}{\text{Sales}} \times 100$$ Measures operational efficiency.
- Net Profit Margin: $$\frac{\text{Net Income}}{\text{Sales}} \times 100$$ Indicates overall profitability.
- Return on Assets (ROA): $$\frac{\text{Net Income}}{\text{Total Assets}} \times 100$$ Measures asset utilization.
- Return on Equity (ROE): $$\frac{\text{Net Income}}{\text{Shareholders’ Equity}} \times 100$$ Shows return to equity investors.
To Earn Your Database Certification, Gain Insights From Leading Blockchain Experts And Advance Your Career With ACTE’s Database Online Training Today!
Liquidity Ratios
Liquidity ratios assess a company’s capacity to meet short-term liabilities.
- Current Ratio: $$\frac{\text{Current Assets}}{\text{Current Liabilities}}$$ Measures short-term solvency; ideally above
- Quick Ratio (Acid-Test): $$\frac{\text{Current Assets} – \text{Inventory}}{\text{Current Liabilities}}$$ More stringent; excludes inventory.
- Cash Ratio: $$\frac{\text{Cash and Cash Equivalents}}{\text{Current Liabilities}}$$ Strictest liquidity test.
Solvency Ratios
Solvency ratios evaluate the long-term financial stability and debt-paying ability.
- Debt to Equity Ratio: $$\frac{\text{Total Debt}}{\text{Shareholders’ Equity}}$$ Indicates financial leverage.
- Debt Ratio: $$\frac{\text{Total Debt}}{\text{Total Assets}}$$ Measures proportion of assets financed by debt.
- Interest Coverage Ratio: $$\frac{\text{EBIT}}{\text{Interest Expense}}$$ Ability to pay interest on debt.
Preparing for a Database Job? Have a Look at Our Blog on Database Interview Questions and Answers To Ace Your Interview!
Dupont Analysis
DuPont Analysis decomposes ROE into three components for deeper insight:
ROE=Net Profit Margin×Asset Turnover×Equity MultiplierROE = \text{Net Profit Margin} \times \text{Asset Turnover} \times \text{Equity Multiplier}ROE=Net Profit Margin×Asset Turnover×Equity Multiplier
- Net Profit Margin (Efficiency): Net Income / Sales
- Asset Turnover (Activity): Sales / Total Assets
- Equity Multiplier (Leverage): Total Assets / Equity
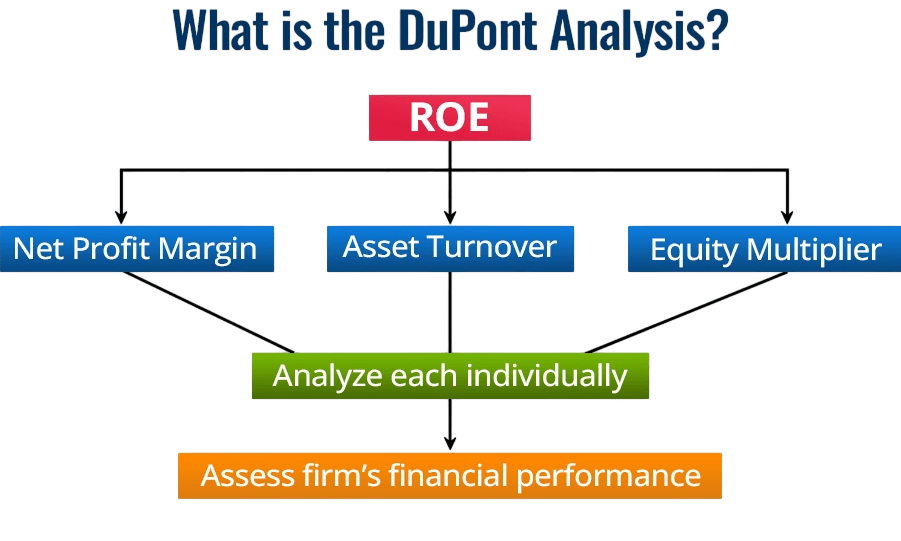
This breakdown helps identify whether profitability, asset efficiency, or leverage drives ROE.
Limitations and Red Flags
Limitations of Financial Statement Analysis:
- Historical Data: Based on past data, may not reflect future conditions.
- Accounting Policies: Different accounting methods affect comparability.
- Window Dressing: Companies may manipulate figures around reporting dates.
- Non-financial Factors: Ignore qualitative aspects like brand value or market trends.
- Inflation: May distort historical cost figures.
- Sector Differences: Ratios vary widely across industries.
Red Flags:
- Declining Cash Flows: Despite positive earnings.
- High Debt Levels: Increasing risk of insolvency.
- Rapid Sales Growth Without Profit: Possible revenue recognition issues.
- Excessive Inventory: Potential obsolescence or sales problems.
- Unusual Expense Fluctuations: May indicate earnings management.
Conclusion
Financial statement analysis is an indispensable tool for evaluating the health and prospects of a company. By understanding the components of financial statements and applying analytical techniques like ratio, horizontal, vertical, and cash flow analysis, stakeholders can make informed decisions. Despite limitations, thorough and contextual analysis helps uncover underlying trends, risks, and opportunities. Real-world applications, such as the analysis of Apple Inc., highlight the practical utility of these methods in assessing corporate performance and guiding strategic actions. To truly understand these reports, we use specific methods. Ratio analysis is one key technique. It compares different numbers within the statements. For instance, the current ratio looks at a company’s ability to pay short-term debts. Horizontal analysis looks at changes over time. It tracks trends from one period to the next. Vertical analysis examines each line item as a percentage. This shows the relative importance of each item. Cash flow analysis is also crucial. It reveals how a company generates and uses cash.