- What are Chart Patterns?
- Why Traders Use Patterns
- Continuation Patterns
- Reversal Patterns
- Cup and Handle
- Double Tops and Bottoms
- Flags and Pennants
- Triangle Patterns
- Candlestick Patterns Overview
- Real Market Examples
- Limitations of Chart Patterns
- Conclusion
What are Chart Patterns?
Technical analysis is a cornerstone of successful trading, and one of its most powerful tools is chart patterns. Chart patterns are visual representations of price movements that help traders forecast future price behavior based on historical performance. These patterns repeat themselves over time and are essential for identifying market trends, reversals, and potential breakout or breakdown points. Whether you’re a novice learning the ropes or an experienced trader refining your strategies, understanding chart patterns can significantly improve your decision-making and profitability. Chart patterns are formations created by the price movements of a security over time. These patterns appear on price charts and can be used to predict future market movements. They reflect the psychology and emotions of market participants fear, greed, indecision, and optimism all encapsulated in visual form. Patterns can form over various timeframes, from minutes to years, and are used across markets stocks, forex, commodities, and cryptocurrencies. Broadly, chart patterns fall into three categories: In technical analysis, traders depend on three main chart patterns to predict possible market movements. Continuity patterns show that the current trend will likely continue, giving traders confidence in the market’s direction. Inverted patterns, on the other hand, suggest a possible change in momentum, prompting investors to watch for shifts that could significantly impact trading strategies. Bilateral patterns add complexity, indicating that a market breakout can occur in any direction. This means traders must stay flexible and ready for various scenarios. These patterns are crucial tools for understanding the dynamics of the market, leading to more informed and strategic investment decisions.
Do You Want to Learn More About Database? Get Info From Our Database Online Training Today!
Why Traders Use Patterns
Chart patterns are important tools that act as guides for traders and offer a clear approach to market analysis. These visual representations help simplify complex price movements and allow for quick decision-making by showing likely future price changes based on past behavior. Traders use chart patterns to determine the best entry, stop-loss, and target levels, making them useful across different markets and time frames. When used wisely, these patterns serve as strong risk management tools that can greatly improve the risk-reward ratio and lower potential trading losses. By turning complicated market data into straightforward visual signals, chart patterns help traders navigate financial markets with more confidence and better understanding.
Continuation Patterns
Continuation patterns suggest that the existing trend will resume after a brief pause or consolidation. Common continuation patterns include:
- Continuation Patterns: Continuation patterns suggest that the existing trend will resume after a brief pause or consolidation. Common continuation patterns include:
- Flags: Flags form after a sharp price move (flagpole), followed by a consolidation that resembles a parallelogram or rectangle. When the pattern completes, the price continues in the direction of the initial move.
- Pennants: Similar to flags but with converging trend lines, creating a small symmetrical triangle. Pennants indicate a short-term consolidation before a breakout in the direction of the previous trend.
- Rectangles: A rectangle forms when price oscillates between two horizontal support and resistance levels. A breakout from this range suggests the continuation of the trend.
These patterns help traders anticipate potential trend resumption and can be valuable components in technical analysis strategies.
Reversal Patterns
Reversal patterns signal a change in the trend’s direction. These patterns are crucial for catching tops and bottoms and are ideal for swing or position traders.
- Head and Shoulders Pattern: The head and shoulders pattern pattern is a classic technical analysis formation that signals a potential trend reversal from bullish to bearish. Characterized by three distinct peaks, this pattern begins with the left shoulder, which represents an initial price peak followed by a decline.
- Inverse Head and Shoulders Pattern: This is the bullish version, indicating a reversal from a downtrend to an uptrend. The pattern mirrors the standard head and shoulders pattern.
- Flags: In technical chart analysis, pennant patterns are characterized by their distinctive sloped rectangular or parallelogram shape, typically emerging as brief consolidation formations that span a few days to weeks. These patterns are particularly notable for their tendency to develop in the direction of the preceding market trend, signaling a potential continuation of the existing price movement.
- Pennants: The triangular chart pattern is characterized by small, symmetrical triangles with converging trendlines, signaling a potential market transition. As the pattern develops, trading volume typically declines, reflecting reduced market momentum during the formation. However, upon a confirmed breakout, volume dramatically increases, indicating heightened investor interest and potential significant price movement.
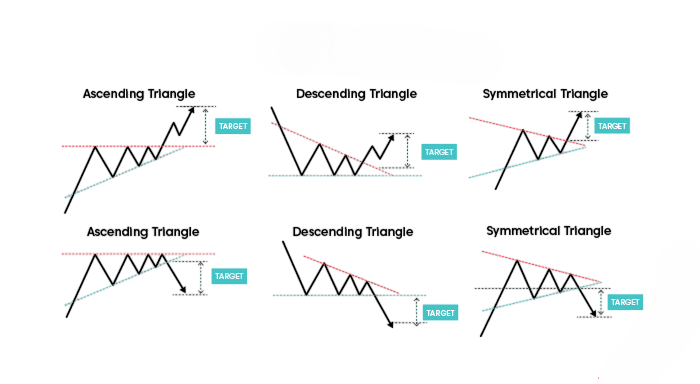
- Triangles Overview: Triangles are powerful patterns that can signal both continuation and reversal. They are formed by drawing trendlines along converging price highs and lows.
- Ascending Triangle: A bullish chart pattern characterized by a flat upper resistance line and a rising lower support line, signaling potential upward price momentum and continued trend strength.
- Descending Triangle: A bearish chart pattern featuring a flat lower support line and a descending upper resistance line, indicating potential downward price movement and trend continuation.
- Symmetrical Triangle: A neutral chart pattern with converging trendlines that suggest market indecision, with the potential for a breakout in either an upward or downward direction.
- Doji Candlestick: A critical signal of market uncertainty, often preceding potential trend reversals and serving as a warning sign for traders to prepare for possible directional shifts in market momentum.
- Engulfing Patterns: Powerful reversal indicators where a larger candle completely “engulfs” the previous candle’s body, with bullish (green over red) and bearish (red over green) variations signaling potential trend changes in market sentiment.
- Hammer and Hanging Man Patterns: Strategic reversal indicators that highlight potential market turning points – Hammer suggests bullish momentum at a downtrend’s bottom, while Hanging Man indicates bearish potential at an uptrend’s peak, providing traders with valuable entry and exit signals.
- Subjectivity: Pattern recognition is not always straightforward. What looks like a cup and handle to one trader may appear as a triangle to another.
- False Breakouts: Not all breakouts lead to a trend continuation. Some can be fake, trapping traders in the wrong direction.
- Lagging Nature: Chart patterns are formed after the price has already made significant moves. This lag can sometimes limit potential profits.
- Dependency on Volume: Volume confirmation is essential for validating patterns, but volume data can be inconsistent, especially in illiquid markets.
- No Guarantee of Accuracy: Chart patterns are probabilistic, not predictive. They increase the odds of success but do not guarantee outcomes.
Would You Like to Know More About Database? Sign Up For Our Database Online Training Now!
Cup and Handle
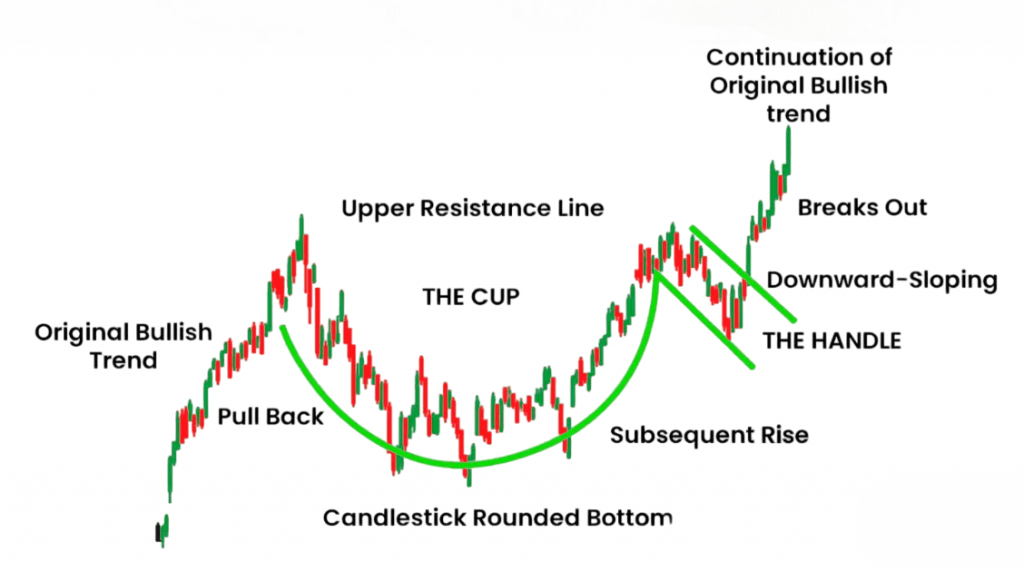
The cup and handle technical analysis shows a clear and quick continuity pattern. It is marked by a distinct teacup-like shape. This pattern starts at a rounded bottom, signaling a gradual recovery after a downtrend.

The “cup” illustrates the length of market consolidation and potential reversal. After the cup forms, there is a slight drop, called the “handle.” This represents a final consolidation phase before a possible breakout. Traders and investors view this pattern as very reliable, especially when trading volume increases during breakouts. This increase indicates a return of market trends. The cup and handle pattern offers important insight into market sentiment and potential speed of value, making it a key tool for technical analysts seeking to spot promising investment opportunities.
Double Tops and Bottoms
Technical chart analysis shows two significant trends that traders closely watch: double top and double bottom formations. A double top pattern occurs when two consecutive peaks form at nearly the same value, with a trough in between. This indicates strong resistance and may signal a shift from an uptrend to a downtrend. On the other hand, the double bottom pattern features two identical troughs separated by a peak, suggesting strong support. This pattern indicates that the price is likely to reverse. In critical situations, volume plays a key role in confirming these patterns. High trading volumes during a breakout enhance their reliability and improve future predictions for market participants seeking to estimate potential trend changes.
To Earn Your Database Certification, Gain Insights From Leading Blockchain Experts And Advance Your Career With ACTE’s Database Online Training Today!
Flags and Pennants
These patterns are often seen in high-volatility stocks and news-driven price movements.
Triangle Patterns
Triangles are powerful patterns that can signal both continuation and reversal. They are formed by drawing trendlines along converging price highs and lows.

Triangles are especially helpful in setting price targets by measuring the height of the triangle and projecting it from the breakout point.
Preparing for a Database Job? Have a Look at Our Blog on Database Interview Questions and Answers To Ace Your Interview!
Candlestick Patterns Overview
While chart patterns show macro-level trends, candlestick patterns offer micro-level price behavior that complements the larger patterns.
Candlestick analysis is often used in combination with chart patterns to confirm entry and exit points.
Real Market Examples
Chart patterns offer valuable insight into potential market movements, as shown by real-world examples in major Indian stocks. In early 2023, Reliance Industries followed the head and shoulders pattern. The decisive break of the neckline, along with high volumes, led to a 12% price increase. Similarly, TCS showed the effectiveness of the cup pattern in mid-2021 and saw a significant 25% rally after a long period of consolidation. HDFC Bank highlighted the effectiveness of technical analysis by forming an ascending triangle in 2020, signaling strong momentum and pushing the stock to a new level. These striking examples demonstrate how traders and investors who analyze chart patterns can gain useful insights, enabling them to make more informed decisions in a fast-paced market.
Limitations of Chart Patterns
Despite their usefulness, chart patterns have certain limitations:
To mitigate these limitations, traders often use chart patterns alongside other technical indicators like RSI, MACD, and moving averages.
Conclusion
Chart patterns are an essential tool in a trader’s arsenal. They provide a structured way to analyze price action, identify opportunities, and manage risks. By understanding how to read patterns like head and shoulders pattern, cup and handle, double tops, triangles, and flags, traders can make informed decisions based on market psychology and historical behavior. However, no trading strategy is foolproof. Combining chart patterns with solid risk management, volume analysis, and other indicators can increase the probability of success. Whether you’re day trading, swing trading, or investing for the long term, mastering chart patterns can be a game-changer in your financial journey.


