Last updated on 04th Oct 2025| 10428
- Introduction to R Programming
- The History and Popularity of R
- R’s Role in Data Science
- Open Source and Community Support
- Powerful Data Visualization Capabilities
- Rich Statistical and Analytical Packages
- Integration with Other Technologies
- Career Opportunities for R Programmers
- Conclusion
Introduction to R Programming
R is a powerful programming language and environment specifically built for statistical computing, data analysis, and graphical representation. Initially developed by statisticians for statisticians, it has since grown into a full-fledged platform used by data scientists, researchers, and analysts worldwide. While many programming languages support data manipulation to some degree, R stands out due to its purpose-built design for handling, Data Science Training processing, and visualizing data. Whether you are a student, a budding data analyst, or an experienced professional in a technical field, R offers you the tools to extract meaningful insights from raw data efficiently. R programming is a powerful language and environment specifically designed for statistical computing and data analysis. Widely used among statisticians, data analysts, and researchers, R provides a wide range of tools for data manipulation, calculation, and graphical display. It is open-source and freely available, making it accessible to users across various disciplines. One of R’s key strengths lies in its extensive package ecosystem, which allows users to perform specialized statistical techniques and create high-quality data visualizations with ease Data Analytics Tools for Big Data Analysis . The language supports procedural programming with functions and also allows object-oriented programming. R is particularly strong in statistical modeling, time-series analysis, and machine learning applications.
The History and Popularity of R
R was created in the early 1990s by Ross Ihaka and Robert Gentleman at the University of Auckland in New Zealand. It was intended as a free and open-source implementation of the S programming language. Over time, R gained significant traction among statisticians and academics, eventually becoming one of the most popular tools in the field of data science. Today, R is widely adopted in sectors ranging from healthcare and finance to marketing and academia. Organizations such as Google, Facebook, Bank of America, and The New York Times utilize R for statistical modeling, predictive analytics, and visualization Apache Hive vs HBase Guide . Its presence in the TIOBE and Stack Overflow Developer Surveys, along with its recognition in KDnuggets and Kaggle competitions, reflects its continued relevance and growing popularity. R originated in the early 1990s as an open-source implementation of the S programming language, developed at Bell Laboratories by John Chambers and his colleagues. R was created by Ross Ihaka and Robert Gentleman at the University of Auckland in New Zealand. It was officially released in 1995 and has since grown rapidly in popularity due to its flexibility, extensibility, and strong statistical capabilities. R gained momentum in academic and research communities because it offered a free alternative to expensive proprietary software like SAS and SPSS.
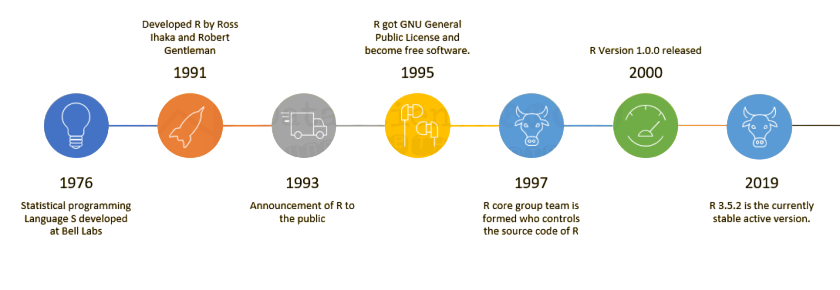
Its active community of users and developers has contributed thousands of packages, greatly expanding its functionality in areas like data science, bioinformatics, and machine learning. Today, R is widely used in academia, government, and industry. The rise of big data and data science has further boosted its popularity, especially among statisticians and data analysts. Tools like RStudio have made it more user-friendly, supporting its continued growth.
Do You Want to Learn More About Data Science? Get Info From Our Data Science Course Training Today!
R’s Role in Data Science
In the realm of data science, R is not just a programming language but a comprehensive ecosystem. It excels at:
- Data Cleaning: Packages like dplyr and tidyr simplify data wrangling.
- Exploratory Data Analysis: Quick summaries and visualizations make pattern recognition easier.
- Statistical Analysis: Advanced capabilities for regression, Big Data Analytics clustering, and hypothesis testing.
- Machine Learning: Libraries such as caret, mlr, and randomForest support robust machine learning workflows.
- Reporting: RMarkdown and Shiny allow analysts to turn code and analysis into interactive dashboards and reports.
Whether you’re building a predictive model or preparing a report for stakeholders, R has all the essential tools for a complete data science workflow.
Would You Like to Know More About Data Science? Sign Up For Our Data Science Course Training Now!
Open Source and Community Support
Free and Open Source: R is licensed under the GNU General Public License, making it freely available for anyone to use, modify, and distribute.
- Large User Community: A global community of statisticians, data scientists, and programmers actively contribute to R’s development and support.
- Thousands of Packages: The Comprehensive R Archive Network (CRAN) hosts over 18,000 packages, extending R’s capabilities in various domains like finance, genetics, and machine learning.
- Active Online Forums: Communities like Stack Overflow, RStudio Community, and Reddit provide fast, practical help and advice Data Science Training.
- Regular Updates and Improvements: R benefits from continuous development, with frequent updates to improve functionality, fix bugs, and add new features.
- Educational Resources: Extensive documentation, tutorials, blogs, and MOOCs (e.g., on Coursera or edX) make learning and mastering R accessible to all skill levels.
- Collaborative Development: Open-source nature allows for peer-reviewed code contributions, ensuring quality and innovation.

Powerful Data Visualization Capabilities
R offers powerful data visualization capabilities that make it a favorite among data analysts and statisticians. It includes a wide variety of built-in plotting functions for creating basic charts such as histograms, bar plots, scatter plots, and boxplots. One of the most popular tools in R for visualization is the ggplot2 package, which allows users to create elegant and highly customizable graphics using a layered grammar of graphics approach. Beyond static plots, R supports advanced visualizations including heatmaps, 3D plots, and geographic maps.
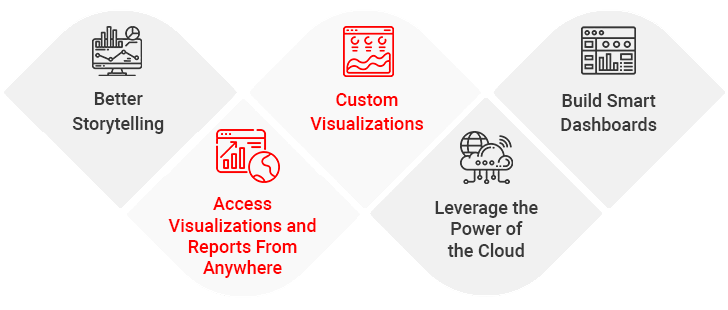
Interactive visualization packages like plotly and shiny enable dynamic, Data Cleaning, web-based charts that allow users to explore data in real time. With precise control over colors, themes, labels, and annotations, R’s visualization tools help users clearly communicate insights Big Data Drives Small and Medium . Additionally, integration with spatial visualization libraries such as leaflet broadens its application for mapping and geographic data analysis. This rich ecosystem makes R an essential tool for effective data storytelling. From simple histograms to advanced multi-dimensional visualizations, R provides unmatched flexibility and power. Visualization isn’t just about aesthetics; it’s about making data-driven stories clearer and more convincing.
Gain Your Master’s Certification in Data Science Training by Enrolling in Our Big Data Analytics Master Program Training Course Now!
Rich Statistical and Analytical Packages
At its core, R was designed by statisticians for performing advanced Rich Statistical and Analytical . Therefore, its statistical capabilities go far beyond the basics. Common Statistical Capabilities:
- Descriptive statistics: Mean, median, standard deviation, variance, etc.
- Inferential statistics: t-tests, chi-square tests, ANOVA, etc.
- Regression models: Linear, logistic, multinomial, Poisson, etc.
- Time-series analysis: ARIMA, exponential smoothing, forecasting models.
- Multivariate analysis: PCA, factor analysis, clustering, and more.
Many of these models are already implemented in reliable, well-documented packages. This means analysts can focus on solving business problems instead of worrying about building models from scratch Scala Certification .
Preparing for Data Science Job? Have a Look at Our Blog on Data Science Interview Questions & Answer To Acte Your Interview!
Integration with Other Technologies
R is not a standalone ecosystem. It integrates smoothly with a wide range of technologies, making it versatile for enterprise applications.
Integration Capabilities:
- Databases: RMySQL, RODBC, DBI allow R to connect to MySQL, PostgreSQL, Oracle, and more.
- Big Data: Spark SQL Interfaces such as sparklyr connect R to Apache Spark for distributed computing.
- Web Applications: With Shiny, you can build interactive web apps directly from R scripts.
- Python Interoperability: Packages like reticulate allow seamless integration between R and Python.
- Excel and CSV Support: readxl, writexl, and readr make importing and exporting data extremely convenient.
This interoperability makes R suitable for real-world production environments, not just academic or experimental work.
Career Opportunities for R Programmers
Career opportunities for R programmers are abundant and diverse, driven by the growing importance of data analysis across industries. R skills are highly sought after in fields such as data science, statistics, finance, healthcare, and academia. Data analysts and statisticians use R to clean, analyze, and visualize complex datasets, helping organizations make data-driven decisions Apache Pig . In the finance sector, R is employed for risk analysis, portfolio management, and quantitative modeling. Healthcare professionals utilize R for bioinformatics, clinical trial analysis, and epidemiology research. Additionally, many companies rely on R programmers for machine learning and predictive analytics projects. The rise of big data has further increased demand for experts proficient in R, especially those who can integrate R with other technologies like Python or SQL. Career roles include data scientist, statistician,Data Cleaning, research analyst, and quantitative analyst, often with competitive salaries. Continuous learning and contributing to R’s open-source community can enhance job prospects and career growth in this dynamic field.
Conclusion
Learning R is a smart investment if you aim to build a career in data analysis, statistics, or data science. With its rich library ecosystem, advanced analytics capabilities, and powerful visualization tools, R offers everything you need to derive actionable insights from data. Whether you are a beginner exploring the field of analytics or an experienced professional looking to deepen your statistical toolkit Data Science Training, R can give you a solid edge in a competitive job market. Moreover, the language continues to evolve with contributions from a passionate global community. So if you’re serious about turning raw data into meaningful insights R might just be the right tool for you.