Last updated on 06th Nov 2025| 10441
- Tableau Software
- What’s Tableau Software
- Why Learn Tableau Software
- What Made Tableau Popular?
- From the IPO Release
- Tableau Advantages and Disadvantages
- Why Tableau Skills Remain in Demand
- Conclusion
Tableau Software
Until the early 21st century, databases mainly provided numbers and information. IT specialists analyzed this data and created reports and dashboards. Tableau changed this by adding data visualization features to databases. This made data interactive and easier to understand than ever before. Tableau started during a time when companies like Cognos, Business Objects, and Microsoft Excel were already successful. Despite beginning in a small office in Seattle, it grew significantly and reached a $3.8 billion market cap. To explore how intelligent analytics frameworks and visualization tools like Tableau integrate with predictive modeling, machine learning, and real-world business applications, explore Data Science Training a hands-on course that covers Tableau, advanced analytics, and data-driven decision-making for career growth. Tableau is a leading data visualization and business intelligence (BI) software that helps individuals and organizations analyze, visualize, and understand data. It allows users to create interactive charts, graphs, maps, and dashboards from various data sources easily with a simple drag-and-drop interface. Tableau turns raw data into meaningful insights without requiring extensive programming knowledge, making it accessible to both technical and non-technical users. Originally developed at Stanford University and now owned by Salesforce, Tableau connects to numerous data sources, including Excel, SQL databases, cloud services, and big data platforms. It is widely used across industries like finance, healthcare, retail, and education to support decision-making and strategy using data.
What’s Tableau Software
Tableau Software is a powerful data visualization and business intelligence tool that allows users to understand and analyze data through interactive and shareable dashboards. It connects with various data sources, including spreadsheets, databases, cloud services, and big data platforms, transforming raw data into meaningful insights without needing advanced technical skills. To explore how certification validates these skills and prepares professionals to harness Tableau for data visualization and business intelligence, explore Tableau Associate Exam a complete guide that covers exam structure, preparation strategies, and practical applications for modern enterprises. With its intuitive drag-and-drop interface, Tableau enables users to create charts, graphs, and reports that highlight trends, patterns, and outliers. Companies across all industries use Tableau for decision-making, performance tracking, and strategic planning. Tableau also supports real-time data analysis, making it valuable for both analysts and executives.
Interested in Obtaining Your Data Science Certificate? View The Data Science Online Training Offered By ACTE Right Now!
Why Learn Tableau Software
Key Attributes and Benefits of Learning Tableau Software, To explore how this powerful platform enables professionals to visualize data, uncover insights, and drive smarter decisions, explore Tableau Software a success story that highlights its key attributes, practical benefits, and real-world applications across industries.
- Data Visualization and Insights: Tableau turns raw data into clear, actionable insights. This helps users find trends, patterns, and relationships. It allows organizations to make effective decisions based on data.
- User-Friendly Interface: The platform is easy to use. Even non-technical users can create interactive dashboards and reports simply by dragging and dropping.
- Professional Value: Tableau skills are highly sought after in many fields. This is especially true for jobs related to data analysis, business intelligence, and strategic planning. Knowing Tableau can boost your resume and open up more career opportunities.
- Integration and Community Support: Tableau works well with other data tools. It also has a strong global community that provides resources, forums, and shared solutions to increase productivity.
- Visual Appeal and Clarity: Tableau presents complex datasets in visually engaging and interactive formats. This makes it easier to understand and share information.
- Career Advancement: Being skilled in Tableau can lead to higher-paying jobs and more opportunities for professional growth. Organizations are looking for professionals who can transform data into strategy.
- Powered by VizQL, allowing it to pull data from any source.
- Offering a wide range of visualization tools for users to customize Tableau reports.
- Complex graphs and maps can be created using drag-and-drop, with no coding required.
- Tableau visualizations can be embedded across various platforms.
- Capable of analyzing and displaying data in real-time.
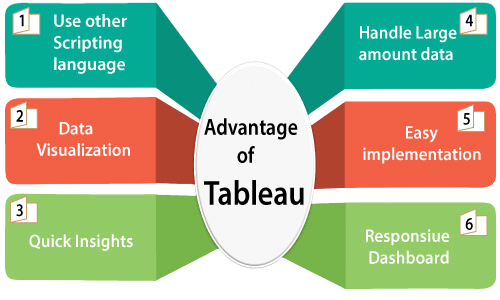
- User-Friendly Interface: Tableau’s drag-and-drop feature makes it easy for users to create dashboards and visualizations without needing to write code.
- Powerful Data Visualization: It offers a wide range of charts, graphs, and formatting tools that make data easy to understand and visually appealing.
- Fast Performance: Tableau efficiently handles large volumes of data and allows users to perform real-time analysis.
- Data Connectivity: Tableau can connect to multiple data sources, such as Excel, SQL databases, cloud services (including Google Cloud and AWS), and big data platforms.
- Interactive Dashboards: Users can build highly interactive dashboards that respond dynamically to user inputs.
- Strong Community and Support: Tableau has a large and active user community, providing extensive documentation, training, and forums for support.
To Explore Data Science in Depth, Check Out Our Comprehensive Data Science Online Training To Gain Insights From Our Experts!
What Made Tableau Popular?
In competition with giants like IBM, Oracle, and Microsoft, a small startup like Tableau managed to capture the market by creating a simple and user-friendly tool that could help users create graphs, charts, maps, and reports while also supporting advanced concepts like predictive and prescriptive analysis. To explore how intelligent analytics frameworks and visualization tools like Tableau integrate with predictive modeling, prescriptive analysis, and real-world business applications, explore Data Science Training a hands-on course that covers Tableau, machine learning, and advanced data-driven decision-making for career success. The main features that contributed to Tableau Software’s success include:
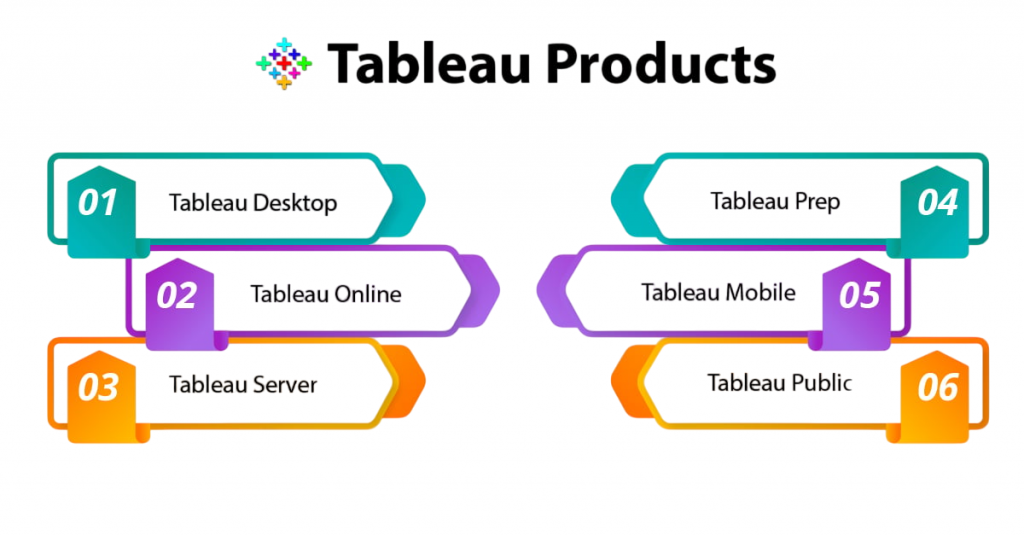
Tableau became popular due to its user-friendly interface, powerful data visualization capabilities, and versatility in handling different data sources. Unlike traditional BI tools, Tableau allows users, including those without technical or programming skills, to quickly create interactive and visually appealing dashboards using a straightforward drag-and-drop process. This democratized data analysis, making it available to business users, not just IT departments.

From the IPO Release
When it launched, Tableau was not well-received by IT professionals, who did not see its worth. However, it quickly gained traction when business analysts and entrepreneurs recognized its utility for business intelligence. The company held its first initial public offering (IPO) in 2013, raising $250 million and never looking back. In the past four years, Tableau has been positioned as a leader in Gartner’s Magic Quadrant for business intelligence and analytics, operating in about 150 countries and generating 25% of overall revenue. Comparative Analysis: Fundamental and An Effective Beginner’s Guide. To explore how this method helps businesses evaluate alternatives, identify strengths and weaknesses, and make informed decisions, explore Comparative Analysis a practical guide that explains its fundamentals, step-by-step approach, and real-world applications for beginners and professionals alike. The company, once considered for sale in 2010, has grown significantly, acquiring a customer base of over 60,000 and showing potential for future expansion. The organization raised over $250 million, which it used to grow operations, invest in product development, and broaden its global user base. The IPO also helped Tableau gain visibility and credibility in the business intelligence space, attracting more corporate clients and partnerships. The company continued to expand rapidly in the years following the IPO.
Gain Your Master’s Certification in Data Science Training by Enrolling in Our Data Science Master Program Training Course Now!
Tableau Advantages and Disadvantages
Advantages of Tableau:
Disadvantages of Tableau:
While Tableau has many strengths, it also faces challenges. Some users argue that Tableau can be costly for smaller organizations. To explore how businesses are adapting to these challenges and why leveraging analytics has become essential for survival in today’s competitive landscape, explore The Rise of Data-Driven a detailed guide that highlights the growing importance of data-driven strategies, industry transformations, and the future of business intelligence. Additionally, despite its user-friendly design, there is still a learning curve, particularly for advanced features.
Are You Preparing for Data Science Jobs? Check Out ACTE’s Data Science Interview Questions and Answers to Boost Your Preparation!
Why Tableau Skills Remain in Demand
Tableau is a leading data visualization and business intelligence tool that empowers users to understand and analyze data through interactive and visually appealing dashboards. Its user-friendly interface, robust data connectivity, and powerful analytical capabilities make it a popular choice across various industries. To explore how this technique uncovers hidden patterns in purchasing behavior, enabling businesses to optimize product placement, cross-selling, and customer engagement, explore Market Basket Analysis a practical guide that explains its fundamentals, applications, and real-world benefits for modern enterprises. Whether you are a business analyst, data scientist, or manager, Tableau helps you turn complex data into clear insights for better decision-making. With the growing demand for data-driven strategies in today’s workplace, learning Tableau is a smart investment for anyone pursuing a career in analytics or business intelligence. Despite some drawbacks, such as cost and the learning curve, Tableau’s strengths in visualization, performance, and community support make it a valuable and future-ready tool in the world of data analytics.
Conclusion
Tableau is a leading data visualization and business intelligence tool that empowers users to understand and analyze data through interactive and visually appealing dashboards. Its user-friendly interface, robust data connectivity, and powerful analytical capabilities make it a popular choice across various industries. To explore how intelligent analytics frameworks and visualization tools like Tableau strengthen industry adoption through predictive modeling, prescriptive analysis, and real-world business applications, explore Data Science Training a hands-on course that covers Tableau, machine learning, and advanced data-driven decision-making for career success. Whether you are a business analyst, data scientist, or manager, Tableau helps you turn complex data into clear insights for better decision-making. With the growing demand for data-driven strategies in today’s workplace, learning Tableau is a smart investment for anyone pursuing a career in analytics or business intelligence. Despite some drawbacks, such as cost and the learning curve, Tableau’s strengths in visualization, performance, and community support make it a valuable and future-ready tool in the world of data analytics.