Last updated on 09th May 2026| 6416
Preparing for an Accenture Data Scientist interview requires strong knowledge of programming, statistics, machine learning, data analysis, and problem-solving skills. Candidates are usually tested on Python, SQL, machine learning algorithms, data visualization, and real-world business scenarios. The interview process may include technical rounds, coding assessments, case studies, and HR discussions. Freshers and experienced professionals should focus on explaining concepts clearly with practical examples. Understanding data preprocessing, model evaluation, and predictive analytics is also important. Good communication skills and logical thinking help candidates perform well during interviews
1. Why does want to join Accenture?
Ans:
Accenture is a reputed IT company known for innovation. It provides great learning opportunities. It supports employee growth. It has global exposure. want to build my career in such an environment. Impressed by its strong values and work culture. Believe it offers a platform to enhance my skills. To contribute to the company’s success and growth..
2. What is Data Science?
Ans:
Data Science is the process of collecting, analyzing, and interpreting large amounts of data to extract meaningful insights. It combines statistics, programming, machine learning, and domain knowledge. Data science helps organizations make better business decisions using data-driven approaches. It includes tasks such as data cleaning, visualization, prediction, and model building. Data scientists use tools like Python, SQL, and Tableau for analysis. It is widely used in industries like healthcare, finance, and retail. Data science improves efficiency, accuracy, and decision-making.
3. Why does want to join Accenture as a Data Scientist?
Ans:
Accenture is a globally recognized company known for innovation and technology solutions. The organization provides opportunities to work on real-world projects across multiple industries. The company’s focus on digital transformation and data-driven solutions is highly admired. Working at Accenture offers excellent opportunities to enhance technical and professional skills. The collaborative work environment and continuous learning culture make it an attractive workplace. Strong commitment to employee growth, diversity, and career development further adds to its appeal
4. What are the main steps in a Data Science project?
Ans:
- A data science project usually starts with problem understanding and data collection. The next step is data cleaning and preprocessing to remove errors and inconsistencies.
- After that, exploratory data analysis is performed to identify patterns and trends. Feature engineering is used to improve model performance.
- Then machine learning models are trained and evaluated using suitable metrics. Once the best model is selected, it is deployed into production.
- Finally, the model is monitored and updated regularly for better performance
5. What is Machine Learning?
Ans:
Machine learning is a branch of artificial intelligence that enables systems to learn from data without explicit programming. It uses algorithms to identify patterns and make predictions or decisions. Machine learning models improve their accuracy through experience and training data. It is classified into supervised, unsupervised, and reinforcement learning. Applications include recommendation systems, fraud detection, and image recognition. Popular machine learning algorithms include decision trees, linear regression, and random forests. Machine learning helps automate tasks and improve business outcomes.
6. What is the difference between supervised and unsupervised learning?
Ans:
| FEATURE | SUPERVISED LEARNING | UNSUPERVISED LEARNING |
|---|---|---|
| DEFINITION | Uses labeled data for training. | Uses unlabeled data for training. |
| OUTPUT | Produces predicted output values | Finds hidden patterns or groups. |
| DATA TYPE | Requires input and correct output. | Requires only input data. |
| GOAL | Predicts results accurately | Discovers relationships in data. |
7. What is overfitting in machine learning?
Ans:
Overfitting occurs when a machine learning model learns the training data too well, including noise and unnecessary details. As a result, the model performs well on training data but poorly on unseen data. It reduces the model’s ability to generalize to new situations. Overfitting usually happens when the model is too complex. Techniques like cross-validation, pruning, and regularization can help prevent it. Using more training data also reduces overfitting. A balanced model should perform well on both training and testing datasets
8. What is underfitting?
Ans:
- Underfitting happens when a machine learning model is too simple to capture the underlying patterns in the data. It performs poorly on both training and testing datasets.
- This occurs when the model lacks sufficient complexity or training. Underfitting can result from insufficient features or improper algorithm selection
- Increasing model complexity or training time can improve performance. Feature engineering and selecting better algorithms also help solve underfitting. A good model should avoid both underfitting and overfitting.
9.What is regression analysis?
Ans:
Regression analysis is a statistical technique used to study the relationship between dependent and independent variables. It helps predict continuous numerical values based on input features. Linear regression is one of the most common regression techniques. Regression is widely used in forecasting sales, stock prices, and business trends. It helps organizations make informed decisions using data analysis. The model identifies how changes in variables affect the output. Regression analysis is simple, interpretable, and useful in many industries.
10. What is classification in machine learning?
Ans:
Classification is a supervised learning technique used to predict categorical outcomes. The model assigns input data into predefined classes or labels. Examples include spam detection, disease prediction, and sentiment analysis. Classification algorithms include logistic regression, decision trees, and support vector machines. The model learns from labeled training data to classify new observations. Evaluation metrics such as accuracy, precision, and recall are commonly used. Classification helps automate decision-making processes efficiently.
11. What is a decision tree?
Ans:
A decision tree is a supervised learning algorithm used for classification and regression tasks. It represents decisions and their possible outcomes in a tree-like structure. Each internal node represents a condition, and branches represent possible results. Decision trees are easy to understand and interpret. They work well with both numerical and categorical data. However, deep trees may lead to overfitting if not controlled properly. Techniques like pruning are used to improve model performance.
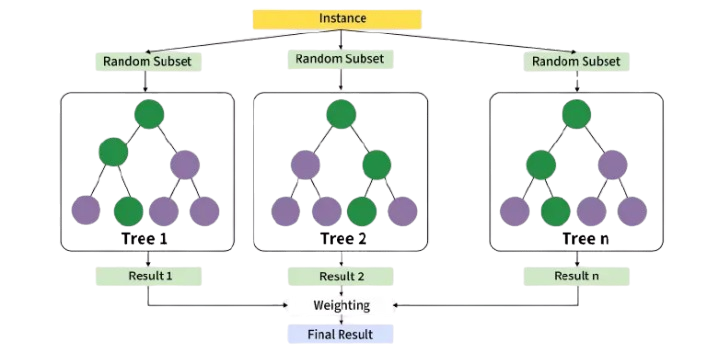
12. What is random forest?
Ans:
- Random forest is an ensemble machine learning algorithm that combines multiple decision trees. It improves prediction accuracy and reduces overfitting. Each tree is trained on a random subset of data and features.
- The final prediction is based on majority voting or averaging. Random forest performs well on large datasets and complex problems.
- It is widely used in classification and regression tasks. The algorithm is reliable, flexible, and easy to use.
13. What is logistic regression?
Ans:
Logistic regression is a supervised learning algorithm mainly used for classification problems. It predicts the probability of a categorical outcome such as yes or no. The algorithm uses a sigmoid function to produce outputs between 0 and 1. Logistic regression is simple, fast, and easy to interpret. It works well when the relationship between variables is linear. It is commonly used in fraud detection and medical diagnosis. Despite its name, logistic regression is mainly used for classification tasks.
14. What is clustering?
Ans:
Clustering is an unsupervised learning technique used to group similar data points together. The model identifies patterns without using labeled data. K-means is one of the most popular clustering algorithms. Clustering is commonly used in customer segmentation and recommendation systems. It helps organizations understand hidden structures in data. The algorithm groups data based on similarity and distance measures. Clustering improves business analysis and decision-making.
15. What is K-means clustering?
Ans:
- K-means clustering is an unsupervised machine learning algorithm used to divide data into clusters. The algorithm groups similar data points based on distance from cluster centroids.
- The number of clusters is represented by K. The algorithm iteratively updates cluster centers until convergence. K-means is simple, fast, and efficient for large datasets.
- However, it requires selecting the correct number of clusters in advance. It is widely used in customer analysis and image segmentation.
16. What is feature engineering?
Ans:
- Feature engineering is the process of selecting, transforming, and creating variables to improve machine learning models. Good features help models learn patterns more effectively.
- It involves handling missing values, encoding categorical data, and scaling features. Feature engineering improves model accuracy and efficiency. Domain knowledge plays an important role in creating meaningful features.
- It is considered one of the most important steps in data science. Better features often produce better predictive models.
17. What is data preprocessing?
Ans:
- Data preprocessing is the process of cleaning and preparing raw data before analysis. It includes handling missing values, removing duplicates, and correcting inconsistencies.
- Data preprocessing improves data quality and model performance. It may also involve normalization, scaling, and encoding categorical variables.
- Poor-quality data can lead to inaccurate predictions. Proper preprocessing ensures reliable and meaningful analysis. It is an essential step in any data science project.
18. What is normalization?
Ans:
Normalization is a technique used to scale numerical data into a fixed range, usually between 0 and 1. It helps machine learning algorithms perform better by ensuring all features contribute equally. Normalization is important when features have different scales. It prevents larger values from dominating smaller ones. Algorithms like KNN and gradient descent benefit greatly from normalization. It improves convergence speed and model accuracy. Common methods include Min-Max scaling and Z-score normalization.
19. What is cross-validation?
Ans:
Cross-validation is a technique used to evaluate machine learning models more reliably. The dataset is divided into multiple subsets called folds. The model is trained on some folds and tested on the remaining fold. This process repeats multiple times to reduce bias. Cross-validation helps estimate how well the model performs on unseen data. It also reduces the risk of overfitting. K-fold cross-validation is one of the most commonly used methods.
20. What is bias and variance?
Ans:
Bias refers to errors caused by overly simple assumptions in a model. High bias can lead to underfitting and poor performance. Variance refers to the model’s sensitivity to small changes in training data. High variance can cause overfitting and unstable predictions. A good machine learning model balances both bias and variance. Techniques like regularization and cross-validation help achieve this balance. Understanding bias and variance is important for building accurate models.
21. What is Python used for in Data Science?
Ans:
Python is one of the most popular programming languages used in data science. It provides powerful libraries such as NumPy, Pandas, Matplotlib, and Scikit-learn. Python is easy to learn and supports rapid development. It is widely used for data analysis, machine learning, and visualization. Python also supports automation and deep learning applications. Its large community and extensive documentation make development easier. Data scientists prefer Python because of its flexibility and efficiency.
22. What is Pandas?
Ans:
Pandas is a Python library used for data manipulation and analysis. It provides data structures like DataFrames and Series for handling structured data. Pandas allows users to clean, filter, and transform data easily. It supports operations such as grouping, merging, and aggregation. The library is highly efficient for handling large datasets. Pandas integrates well with other data science libraries. It is one of the most commonly used tools in data analysis.
23. What is NumPy?
Ans:
NumPy is a Python library used for numerical computing and mathematical operations. It provides support for arrays, matrices, and high-performance calculations. NumPy is faster and more efficient than traditional Python lists. It is widely used in machine learning and scientific computing. Many data science libraries depend on NumPy for core operations. It also supports functions for linear algebra and statistics. NumPy helps improve computational efficiency in data analysis.
24. What is data visualization?
Ans:
- Data visualization is the graphical representation of data using charts, graphs, and dashboards. It helps people understand patterns, trends, and relationships in data easily.
- Visualization tools include Matplotlib, Seaborn, Tableau, and Power BI. Effective visualization improves communication and decision-making.
- It simplifies complex information for technical and non-technical audiences. Data visualization is important in exploratory data analysis. Clear visualizations help organizations identify business insights quickly.
25. What is SQL?
Ans:
- SQL stands for Structured Query Language and is used to manage relational databases. It helps retrieve, insert, update, and delete data efficiently.
- SQL is essential for data scientists because most business data is stored in databases. Common SQL operations include joins, filtering, and aggregation.
- SQL allows users to analyze large datasets quickly. It works with databases like MySQL, PostgreSQL, and SQL Server. Strong SQL knowledge is important for data analysis roles.
26. What is deep learning?
Ans:
Deep learning is a subset of machine learning based on artificial neural networks. It uses multiple hidden layers to learn complex patterns from data. Deep learning performs exceptionally well in image recognition, speech processing, and natural language processing. It requires large amounts of data and computational power. Frameworks like TensorFlow and PyTorch are commonly used for deep learning. Neural networks automatically extract features from raw data. Deep learning has significantly advanced artificial intelligence applications.
27. What is a neural network?
Ans:
A neural network is a machine learning model inspired by the human brain. It consists of interconnected layers of nodes called neurons. The network learns patterns by adjusting weights during training. Neural networks are highly effective for complex tasks like image and speech recognition. They can model non-linear relationships in data. Deep neural networks contain multiple hidden layers for advanced learning. Neural networks are widely used in artificial intelligence systems.
28. What is natural language processing??
Ans:
Natural Language Processing, or NLP, is a field of artificial intelligence that enables computers to understand human language. NLP combines linguistics, machine learning, and data analysis. It is used in applications like chatbots, sentiment analysis, and translation systems. NLP helps machines process text and speech effectively. Techniques include tokenization, stemming, and named entity recognition. Python libraries such as NLTK and SpaCy are widely used in NLP. NLP improves communication between humans and machines.
29. What is accuracy in machine learning?
Ans:
Accuracy is a performance metric used to measure how many predictions are correct out of the total predictions made. It is commonly used in classification problems. Accuracy is calculated as correct predictions divided by total predictions. High accuracy indicates good model performance. However, accuracy may not be sufficient for imbalanced datasets. In such cases, precision and recall are also important. Accuracy provides a simple way to evaluate classification models.
30. What is precision and recall?
Ans:
- Precision measures how many predicted positive values are actually correct. Recall measures how many actual positive cases were identified correctly.
- Both metrics are important in classification problems. Precision is important when false positives are costly, while recall is important when missing positives is risky.
- These metrics are commonly used in medical diagnosis and fraud detection. Balancing precision and recall improves model effectiveness. The F1-score combines both metrics into a single value.
31. What is the F1-score?
Ans:
- The F1-score is a metric used to evaluate classification models by combining precision and recall. It provides a balanced measure when datasets are imbalanced.
- The F1-score ranges from 0 to 1, where higher values indicate better performance. It is especially useful when both false positives and false negatives matter.
- The score is calculated using the harmonic mean of precision and recall. Data scientists use it to compare classification models effectively. It helps ensure balanced model evaluation.
32. What is big data?
Ans:
- Big data refers to extremely large and complex datasets that cannot be processed using traditional methods. Big data is characterized by volume, velocity, and variety. Organizations use big data technologies to analyze massive amounts of information quickly.
- Tools like Hadoop and Spark help process big data efficiently. Big data supports better business decisions and predictive analysis.
- Industries such as healthcare, finance, and retail use big data extensively. It enables organizations to gain valuable insights from large-scale information.
33. What is Hadoop?
Ans:
Hadoop is an open-source framework used for storing and processing large datasets in distributed environments. It allows data to be processed across multiple computers efficiently. Hadoop consists of components like HDFS and MapReduce. It is designed to handle big data applications reliably. Hadoop provides scalability and fault tolerance. Many organizations use Hadoop for large-scale data processing. It supports cost-effective storage and analysis of massive datasets.
34. What is Apache Spark?
Ans:
Apache Spark is a fast and powerful big data processing framework. It performs in-memory processing, making it faster than Hadoop MapReduce. Spark supports batch processing, streaming, machine learning, and graph analysis. It works with programming languages like Python, Java, and Scala. Spark is widely used for real-time data analytics. It integrates well with Hadoop ecosystems. Organizations prefer Spark for high-speed large-scale data processing.
35. What is ETL?
Ans:
ETL stands for Extract, Transform, and Load. It is a process used to move and prepare data from multiple sources into a data warehouse. Data is first extracted from source systems. It is then transformed into a suitable format by cleaning and organizing it. Finally, the processed data is loaded into a destination system. ETL helps ensure data consistency and quality. It is widely used in business intelligence and analytics projects
36. What is data cleaning?
Ans:
Data cleaning is the process of identifying and correcting errors, inconsistencies, and missing values in datasets. Clean data improves analysis accuracy and model performance. Common tasks include removing duplicates and fixing formatting issues. Data cleaning also involves handling outliers and incomplete records. Poor-quality data can lead to misleading insights. Data scientists spend significant time cleaning data before analysis. Proper data cleaning ensures reliable decision-making.
37. What are outliers?
Ans:
Outliers are data points that differ significantly from other observations in a dataset. They may occur due to errors, rare events, or natural variations. Outliers can negatively affect machine learning models and statistical analysis. Detecting outliers is important for improving data quality. Techniques like box plots and Z-scores help identify them. Depending on the situation, outliers may be removed or analyzed separately. Understanding outliers helps improve model reliability.
38. What is correlation?
Ans:
- Correlation measures the relationship between two variables and indicates how strongly they are connected. Positive correlation means both variables increase together, while negative correlation means one decreases when the other increases.
- Correlation values range from -1 to 1. It helps data scientists identify relationships in datasets. Correlation analysis is useful in feature selection and predictive modeling.
- However, correlation does not imply causation. Understanding correlations helps improve business insights.
39. What is hypothesis testing?
Ans:
- Hypothesis testing is a statistical method used to make decisions based on sample data. It helps determine whether assumptions about data are valid.
- The process involves null and alternative hypotheses. Statistical tests are performed to accept or reject the null hypothesis.
- Hypothesis testing is widely used in experiments and business analysis. Common tests include t-tests and chi-square tests. It supports data-driven decision-making.
40. What is a p-value?
Ans:
A p-value is a statistical measure used in hypothesis testing to determine the significance of results. It indicates the probability of obtaining observed results if the null hypothesis is true. Smaller p-values suggest stronger evidence against the null hypothesis. A common threshold for significance is 0.05. P-values help researchers make informed conclusions from data. They are widely used in scientific studies and analytics. Understanding p-values is important in statistical analysis

41. What is linear regression?
Ans:
Linear regression is a supervised learning algorithm used to predict continuous values. It establishes a linear relationship between dependent and independent variables. The model fits a straight line to the data points. Linear regression is simple and easy to interpret. It is widely used in forecasting and trend analysis. The algorithm helps understand the impact of variables on outcomes. It forms the foundation of many advanced machine learning techniques.
42. What is the difference between AI, ML, and Data Science?
Ans:
| TOPIC | ARTIFICIAL INTELLIGENCE (AI) | MACHINE LEARNING (ML) | DATA SCIENCE |
|---|---|---|---|
| DEFINITION | AI Enables Machines To Mimic Human Intelligence. | ML Allows Systems To Learn From Data Automatically.. | Data Science Extracts Insights From Structured And Unstructured Data.. |
| MAIN FOCUST | Focuses On Smart Decision-Making And Automation. | Focuses On Learning Patterns From Data | Focuses On Data Analysis And Interpretation |
| GOAL | Create Intelligent Systems And Applications. | Build Models That Improve With Experience. | Solve Business Problems Using Data Insights. |
43. What is reinforcement learning?
Ans:
- Reinforcement learning is a type of machine learning where an agent learns through rewards and penalties. The system interacts with an environment and improves its decisions over time
- It is inspired by human learning through trial and error. Reinforcement learning is widely used in robotics and gaming applications.
- The algorithm aims to maximize long-term rewards. It involves concepts such as states, actions, and policies. Reinforcement learning supports intelligent automated decision-making.
44. What is dimensionality reduction?
Ans:
- Dimensionality reduction is the process of reducing the number of features in a dataset while preserving important information.
- It helps simplify models and improve computational efficiency. Techniques like PCA are commonly used for dimensionality reduction. It reduces noise and prevents overfitting. Lower-dimensional data is easier to visualize and analyze.
- Dimensionality reduction is useful for handling high-dimensional datasets. It improves model performance and interpretation.
45. What is PCA?
Ans:
- Principal Component Analysis, or PCA, is a dimensionality reduction technique used to simplify datasets. It transforms original variables into new uncorrelated variables called principal components
- PCA captures the maximum variance in data using fewer dimensions. It helps reduce complexity and improve model efficiency.
- PCA is commonly used in image processing and exploratory analysis. It also helps remove multicollinearity among features. PCA improves data visualization and processing speed.
46. What is ensemble learning?
Ans:
Ensemble learning is a technique that combines multiple machine learning models to improve prediction accuracy. The idea is that a group of models performs better than a single model. Common ensemble methods include bagging, boosting, and stacking. Random forest is an example of bagging. Ensemble learning reduces overfitting and increases stability. It is widely used in competitive machine learning applications. Ensemble methods improve robustness and overall model performance.
47. What is boosting?
Ans:
Boosting is an ensemble learning technique that combines weak learners to create a strong predictive model. Models are trained sequentially, and each model corrects the errors of the previous one. Popular boosting algorithms include AdaBoost and XGBoost. Boosting improves prediction accuracy significantly. It works well for complex datasets and classification problems. However, boosting may require careful tuning to avoid overfitting. It is widely used in machine learning competitions and industry applications.
48. What is bagging?
Ans:
Bagging, or Bootstrap Aggregating, is an ensemble learning method that improves model stability and accuracy. It creates multiple subsets of training data using random sampling. Separate models are trained on each subset independently. The final prediction is obtained by averaging or voting. Random forest is a popular bagging algorithm. Bagging reduces variance and helps prevent overfitting. It is effective for improving predictive performance.
49. What is XGBoost?
Ans:
XGBoost is an advanced gradient boosting algorithm known for speed and performance. It is widely used in machine learning competitions and real-world applications. XGBoost supports parallel processing and regularization. It handles missing values effectively and improves prediction accuracy. The algorithm works well with structured data. XGBoost provides high efficiency and scalability. Many organizations use it for predictive analytics and classification tasks.
50. What is feature selection?
Ans:
Feature selection is the process of choosing the most relevant variables for building machine learning models. It helps reduce complexity and improve model performance. Irrelevant features may increase noise and overfitting. Feature selection techniques include filter, wrapper, and embedded methods. It also improves training speed and interpretability. Selecting important features enhances predictive accuracy. Feature selection is an important step in machine learning workflows.
51. What are missing values in data?
Ans:
- Missing values occur when certain data points are absent from a dataset. They may result from data entry errors or incomplete information collection.
- Missing values can affect analysis and model performance negatively. Common handling methods include deletion, mean imputation, and predictive imputation.
- Choosing the right technique depends on the dataset and business problem. Proper handling improves data quality and reliability. Managing missing data is essential in preprocessing.
52. What is time series analysis?
Ans:
- Time series analysis involves studying data collected over time to identify patterns and trends. It is commonly used in forecasting applications.
- Time series data includes stock prices, weather data, and sales records. Important components include trend, seasonality, and noise.
- Algorithms like ARIMA and LSTM are used for analysis. Time series forecasting helps businesses plan future activities. It supports better decision-making and resource management.
53. What is sentiment analysis?
Ans:
- Sentiment analysis is a natural language processing technique used to determine emotions or opinions in text. It classifies text as positive, negative, or neutral.
- Sentiment analysis is widely used in social media monitoring and customer feedback analysis. It helps organizations understand public opinion. Machine learning and NLP techniques are commonly applied for sentiment classification.
- Businesses use sentiment analysis to improve products and services. It enhances customer experience and brand reputation.
54. What is recommendation system?
Ans:
A recommendation system is a machine learning application that suggests products or services to users. It analyzes user preferences and behavior patterns. Recommendation systems are widely used in e-commerce and streaming platforms. There are content-based and collaborative filtering methods. These systems improve user experience and engagement. They help businesses increase sales and customer satisfaction. Recommendation engines play a major role in personalized services.
55. What is cloud computing in Data Science?
Ans:
Cloud computing provides online access to storage, computing power, and software services. Data scientists use cloud platforms for processing and storing large datasets. Popular cloud providers include AWS, Azure, and Google Cloud. Cloud computing offers scalability and flexibility. It reduces infrastructure costs for organizations. Cloud services support machine learning and big data analytics. They enable faster collaboration and deployment.
56. What is Tableau??
Ans:
Tableau is a popular data visualization and business intelligence tool. It helps users create interactive dashboards and reports. Tableau connects to multiple data sources easily. It allows organizations to analyze data visually and identify trends. The tool supports drag-and-drop functionality, making it user-friendly. Tableau improves communication of business insights. It is widely used in analytics and reporting projects.
57. What is Power BI?
Ans:
Power BI is a business analytics tool developed by Microsoft. It helps users visualize data and create interactive dashboards. Power BI connects to databases, cloud services, and spreadsheets. It supports real-time analytics and reporting. The tool is widely used for business intelligence applications. Power BI simplifies data interpretation for decision-makers. It helps organizations monitor performance and make informed decisions
58. What is data warehousing?
Ans:
Data warehousing is the process of storing and managing large amounts of historical data for analysis and reporting. A data warehouse integrates data from multiple sources into a centralized system. It supports business intelligence and analytics operations. Data warehouses are optimized for query performance. They help organizations analyze trends and make strategic decisions. ETL processes are commonly used in data warehousing. Data warehouses improve reporting efficiency and consistency.
59. What is Apache Kafka?
Ans:
- Apache Kafka is a distributed event-streaming platform used for handling real-time data feeds. It enables high-throughput data processing and communication between systems.
- Kafka is commonly used in big data and streaming applications. It supports fault tolerance and scalability. Organizations use Kafka for log monitoring and event-driven architectures.
- It integrates well with Spark and Hadoop ecosystems. Kafka helps process real-time analytics efficiently.
60. What is model deployment?
Ans:
- Model deployment is the process of integrating a trained machine learning model into a production environment. It allows users and applications to access model predictions in real time.
- Deployment can be done using APIs, cloud platforms, or web applications. Monitoring is important after deployment to maintain performance.
- Deployed models should be scalable and secure. Model deployment bridges the gap between development and business use. It is a critical step in the machine learning lifecycle.

Learn Data Science Course with Advanced Concepts By Industry Experts
- Instructor-led Sessions
- Real-life Case Studies
- Assignments
61 What is A/B testing?
Ans:
A/B testing is an experimental method used to compare two versions of a product or feature. Users are divided into groups, and each group experiences a different version. The goal is to determine which version performs better. A/B testing helps organizations make data-driven decisions. It is widely used in marketing and website optimization. Statistical analysis is used to evaluate results. A/B testing improves user engagement and business performance.
62. What is anomaly detection?
Ans:
Anomaly detection is the process of identifying unusual patterns or outliers in data. These anomalies may indicate fraud, system failures, or security threats. Machine learning algorithms help automate anomaly detection. It is widely used in banking, cybersecurity, and manufacturing. Detecting anomalies early reduces business risks. Techniques include clustering and statistical analysis. Anomaly detection improves operational efficiency and reliability.
63. What is data mining?
Ans:
Data mining is the process of discovering patterns, trends, and useful information from large datasets. It combines statistics, machine learning, and database systems. Data mining helps organizations uncover hidden relationships in data. Applications include fraud detection and customer segmentation. It supports predictive analytics and decision-making. Common techniques include classification, clustering, and association rules. Data mining transforms raw data into valuable knowledge.
64. What are APIs in Data Science?
Ans:
APIs, or Application Programming Interfaces, allow software systems to communicate and exchange data. Data scientists use APIs to collect data from external platforms and services. APIs simplify integration with applications and cloud systems. They are commonly used for real-time data access. REST APIs are widely used in web services. APIs help automate workflows and improve efficiency. Knowledge of APIs is useful for modern data science project
65. What is TensorFlow?
Ans:
- TensorFlow is an open-source deep learning framework developed by Google. It is widely used for building and training neural networks
- TensorFlow supports machine learning, computer vision, and NLP applications. It provides flexibility for research and production deployment. The framework works efficiently with GPUs and distributed systems.
- TensorFlow includes high-level APIs for easier development. It is one of the most popular tools in deep learning.
66. What is PyTorch?
Ans:
- PyTorch is an open-source deep learning framework developed by Meta. It is known for its flexibility and dynamic computation graphs.
- PyTorch is widely used in research and artificial intelligence applications. The framework supports GPU acceleration for faster training.
- Developers prefer PyTorch because of its simplicity and ease of debugging. It integrates well with Python libraries. PyTorch is popular for computer vision and NLP projects.
67. What is computer vision?
Ans:
Computer vision is a field of artificial intelligence that enables machines to understand and process images and videos. It uses deep learning and image processing techniques. Applications include facial recognition, object detection, and autonomous vehicles. Computer vision helps automate visual tasks efficiently. Convolutional neural networks are commonly used in computer vision. The technology is widely used in healthcare and security systems. It improves automation and accuracy in image analysis.
68. What is data ethics?
Ans:
Data ethics refers to the responsible use and management of data. It includes privacy, transparency, and fairness in data handling. Organizations must ensure that data is collected and used ethically. Bias in machine learning models should be minimized. Data security and user consent are also important ethical concerns. Ethical practices help build trust with customers and stakeholders. Data ethics is becoming increasingly important in modern technology.
69. What is scalability in machine learning?
Ans:
Scalability refers to the ability of a machine learning system to handle increasing amounts of data and workloads efficiently. Scalable systems maintain performance as demand grows. Big data technologies and cloud platforms support scalability. Efficient algorithms and distributed computing improve scalability. It is important for production-level machine learning systems. Scalable solutions help organizations manage large-scale operations. Scalability ensures long-term system reliability.
70. What is data governance?
Ans:
- Data governance is the framework used to manage data quality, security, and accessibility within an organization. It defines policies and standards for data management. Data governance ensures data consistency and compliance with regulations
- It improves trust and reliability in organizational data. Proper governance supports effective analytics and reporting.
- It also protects sensitive information from misuse. Strong data governance is essential for modern businesses.
71. What is multicollinearity?
Ans:
- Multicollinearity occurs when independent variables in a regression model are highly correlated with each other. It makes it difficult to determine the impact of individual variables.
- Multicollinearity can reduce model interpretability and stability. Variance Inflation Factor is commonly used to detect it. Removing correlated variables can solve the issue
- PCA may also help reduce multicollinearity. Proper feature selection improves regression performance.
72. What is regularization?
Ans:
Regularization is a technique used to reduce overfitting in machine learning models. It adds a penalty term to the loss function to limit model complexity. Common methods include L1 and L2 regularization. Regularization improves model generalization on unseen data. It is widely used in regression and neural networks. Proper regularization balances bias and variance effectively. It helps create stable and accurate predictive models.
73. What is L1 and L2 regularization?
Ans:
L1 regularization adds the absolute values of coefficients as penalties in the loss function. It can reduce some coefficients to zero, helping with feature selection. L2 regularization adds squared coefficient penalties and prevents extremely large values. Both methods reduce overfitting and improve generalization. L1 is also known as Lasso regression, while L2 is Ridge regression. These techniques improve model stability. Regularization is widely used in predictive analytics.
74. What is confusion matrix?
Ans:
A confusion matrix is a table used to evaluate classification model performance. It shows actual and predicted classifications. The matrix includes true positives, true negatives, false positives, and false negatives. It helps calculate metrics like accuracy, precision, and recall. Confusion matrices provide deeper insights into model errors. They are useful for analyzing imbalanced datasets. Understanding the confusion matrix improves model evaluation.
75. What is ROC curve?
Ans:
The ROC curve, or Receiver Operating Characteristic curve, evaluates classification model performance. It plots true positive rate against false positive rate. A good model achieves high true positive rates with low false positives. The Area Under the Curve measures overall performance. ROC curves help compare multiple classification models. They are especially useful for binary classification problems. Higher AUC values indicate better model performance.
76. What is gradient descent?
Ans:
- Gradient descent is an optimization algorithm used to minimize the loss function in machine learning models. It updates model parameters iteratively to reduce errors.
- The algorithm moves in the direction of the steepest decrease in loss. Learning rate controls the step size during updates. Gradient descent is widely used in neural networks and regression models.
- Variants include batch, stochastic, and mini-batch gradient descent. It is fundamental to machine learning optimization
77. What is hyperparameter tuning?
Ans:
Hyperparameter tuning is the process of selecting the best configuration for machine learning models. Hyperparameters are settings defined before training begins. Examples include learning rate and tree depth. Proper tuning improves model accuracy and performance. Techniques like grid search and random search are commonly used. Cross-validation helps evaluate different parameter combinations. Hyperparameter tuning is essential for building effective models.
78. What is transfer learning?
Ans:
Transfer learning is a technique where a pre-trained model is reused for a new but related task. It reduces training time and data requirements. Transfer learning is common in deep learning and computer vision applications. Models trained on large datasets can be adapted for smaller tasks. This approach improves efficiency and performance. Popular pre-trained models include ResNet and BERT. Transfer learning accelerates AI development.
79. What is AutoML?
Ans:
AutoML, or Automated Machine Learning, automates tasks involved in building machine learning models. It includes data preprocessing, feature selection, and hyperparameter tuning. AutoML simplifies machine learning for non-experts. It reduces development time and improves productivity. Popular AutoML tools include Google AutoML and H2O.ai. The technology helps organizations adopt AI more easily. AutoML enhances accessibility and efficiency in data science.
80. What is data imbalance?
Ans:
Data imbalance occurs when one class in a dataset significantly outnumbers another class. Imbalanced data can lead to biased machine learning models. Models may predict the majority class more often. Techniques like oversampling and undersampling help address imbalance. Metrics such as F1-score and recall are important in such cases. Data imbalance is common in fraud detection and medical diagnosis. Proper handling improves classification accuracy.
81. What is cosine similarity?
Ans:
- Cosine similarity measures the similarity between two vectors based on the angle between them. It is widely used in text analysis and recommendation systems.
- The value ranges from -1 to 1, where higher values indicate greater similarity. Cosine similarity is effective for high-dimensional data.
- It helps compare documents and user preferences. NLP applications frequently use cosine similarity. It improves content matching and recommendations.
82. What is web scraping?
Ans:
- Web scraping is the process of extracting data from websites automatically using scripts or tools. It helps collect large amounts of online data quickly.
- Python libraries like BeautifulSoup and Scrapy are commonly used. Web scraping supports market research and sentiment analysis.
- Ethical and legal considerations must be followed while scraping data. Clean and structured data can then be analyzed effectively. Web scraping is useful in many data science applications.
83. What is exploratory data analysis?
Ans:
- Exploratory Data Analysis, or EDA, is the process of analyzing datasets to understand their characteristics. It involves statistical summaries and visualizations.
- EDA helps identify patterns, anomalies, and relationships in data. Data scientists use charts, histograms, and scatter plots during EDA.
- It improves understanding before model building. EDA also helps detect missing values and outliers. Proper EDA leads to better predictive models.
84. What is business intelligence?
Ans:
Business Intelligence, or BI, refers to technologies and processes used to analyze business data. BI tools help organizations create reports and dashboards. It supports strategic decision-making using historical and real-time data. BI improves operational efficiency and performance monitoring. Tools like Tableau and Power BI are commonly used. Business intelligence transforms raw data into actionable insights. It helps organizations remain competitive in the market.
85. What is Docker?
Ans:
Docker is a platform used to create and manage lightweight software containers. Containers package applications with their dependencies for consistent deployment. Docker helps data scientists deploy models efficiently across environments. It improves portability and scalability. Docker simplifies collaboration among development teams. It is widely used in cloud computing and machine learning deployment. Docker ensures reliable application execution.
86. What is Kubernetes?
Ans:
- Kubernetes is an open-source platform used to automate deployment and management of containerized applications. It helps scale and monitor applications efficiently.
- Kubernetes works well with Docker containers. It provides load balancing, fault tolerance, and resource management. Organizations use Kubernetes for large-scale cloud deployments.
- It supports high availability and automation. Kubernetes is important in modern DevOps and machine learning operation
87. What is MLOps?
Ans:
- MLOps refers to Machine Learning Operations, which combines machine learning, DevOps, and data engineering practices. It helps automate model deployment, monitoring, and maintenance.
- MLOps ensures reliable and scalable machine learning workflows. It improves collaboration between data scientists and engineers.
- Continuous integration and deployment are key components of MLOps. The approach supports faster delivery of AI solutions. MLOps improves operational efficiency in production systems.
88. What is feature scaling?
Ans:
Feature scaling is the process of standardizing numerical features to a common range. It helps machine learning algorithms perform better and converge faster. Scaling prevents features with larger values from dominating the model. Common methods include normalization and standardization. Algorithms like KNN and SVM require feature scaling. It improves model accuracy and stability. Feature scaling is an important preprocessing step.
89. What is standardization?
Ans:
Standardization is a feature scaling technique that transforms data to have a mean of zero and a standard deviation of one. It is also called Z-score normalization. Standardization helps algorithms handle varying feature scales effectively. It improves convergence during optimization. Models like logistic regression and SVM benefit from standardization. It is widely used in machine learning preprocessing. Standardized data improves training efficiency.
90. What is the role of statistics in Data Science?
Ans:
Statistics plays a major role in data science by helping analyze and interpret data effectively. It supports hypothesis testing, probability analysis, and predictive modeling. Statistical methods help identify trends and relationships in datasets. Data scientists use statistics to validate results and make decisions. Concepts like mean, variance, and correlation are fundamental. Statistics also helps evaluate machine learning models. Strong statistical knowledge improves analytical accuracy.
91.What are the qualities of a good Data Scientist?
Ans:
- A good data scientist should have strong analytical and problem-solving skills. Technical knowledge in programming, statistics, and machine learning is essential
- Communication skills are also important for explaining insights clearly. Curiosity and continuous learning help data scientists adapt to new technologies. Teamwork and collaboration improve project success.
- Attention to detail ensures accurate analysis and predictions. A good data scientist combines technical expertise with business understanding.
92. What Values Are Important In A Workplace?
Ans:
Integrity, Respect, And Professionalism Are Important Workplace Values. Ethical Behavior Builds Trust Among Colleagues And Stakeholders. Collaboration Encourages Team Success And Knowledge Sharing. Accountability Ensures Responsibilities Are Fulfilled Effectively. Continuous Learning Supports Growth And Innovation. Inclusiveness Creates A Positive And Productive Work Environment. Strong Values Contribute To Sustainable Organizational Success.
93. How Does Prioritize Multiple Tasks?
Ans:
Task Prioritization Involves Evaluating Urgency, Importance, And Deadlines. High-Priority Activities Should Receive Immediate Attention. Creating A Structured Plan Helps Organize Responsibilities Efficiently. Monitoring Progress Supports Timely Completion Of Tasks. Effective Prioritization Reduces Work Overload And Stress. Flexibility Allows Adjustments When New Requirements Arise. This Approach Improves Productivity And Work Quality.
94. What Have Academic Projects Taught?
Ans:
Academic Projects Provide Practical Exposure To Planning, Execution, And Collaboration. They Help Develop Problem-Solving And Analytical Thinking Skills. Team Activities Improve Communication And Coordination Abilities. Managing Deadlines Encourages Discipline And Responsibility. Research Activities Enhance Learning And Technical Understanding. Project Experiences Build Confidence In Handling Challenges. These Lessons Prepare Candidates For Professional Work Environments.
95.How Does Build Good Relationships At Work?
Ans:
Good Workplace Relationships Are Built Through Respect, Trust, And Professionalism. Effective Communication Encourages Better Understanding Among Colleagues. Active Listening Demonstrates Interest In Others’ Ideas And Opinions. Reliability Helps Establish Credibility And Confidence. Positive Attitudes Contribute To A Healthy Work Environment. Collaboration Strengthens Team Connections And Productivity. Strong Relationships Support Long-Term Professional Success.
96. What Is Professionalism?
Ans:
Professionalism Involves Demonstrating Responsibility, Integrity, And Respect In The Workplace. It Includes Maintaining Ethical Standards During Daily Activities. Professional Individuals Communicate Clearly And Behave Respectfully. Accountability Helps Ensure Tasks Are Completed Effectively. Time Management Supports Productivity And Reliability. Continuous Learning Reflects Commitment To Growth And Improvement. Professionalism Enhances Reputation And Career Development.
97. How Does Handle Disagreements In A Team?
Ans:
- Disagreements Should Be Addressed Through Respectful And Open Communication. Understanding Different Perspectives Helps Identify Common Ground.
- Focusing On Facts Rather Than Emotions Improves Discussions. Active Listening Encourages Better Collaboration And Understanding.
- Seeking Solutions That Benefit The Team Supports Progress. Professional Behavior Maintains Positive Relationships During Conflicts. Constructive Resolution Strengthens Team Effectiveness.
98. What Does Customer Satisfaction Mean?
Ans:
Customer Satisfaction Reflects The Ability To Meet Or Exceed Expectations Consistently. Understanding Customer Needs Helps Deliver Better Solutions. Quality Service Builds Trust And Long-Term Relationships. Prompt Responses Improve Customer Experiences And Confidence. Continuous Improvement Supports Higher Satisfaction Levels. Positive Customer Experiences Contribute To Organizational Success. Customer Satisfaction Is Essential For Sustainable Growth.
99. How Does Deal With Failure?
Ans:
Failure Provides Valuable Lessons That Contribute To Personal And Professional Growth. Analyzing Mistakes Helps Identify Opportunities For Improvement. A Positive Mindset Encourages Learning Rather Than Discouragement. Continuous Effort And Persistence Help Overcome Challenges Successfully. Experience Gained From Failure Improves Future Decision-Making. Adaptability And Resilience Support Recovery From Difficult Situations. Every Failure Can Become A Step Toward Future Success.
100. What Is The Importance Of Integrity?
Ans:
Integrity Involves Honesty, Ethics, And Consistency In Actions. It Builds Trust Among Colleagues, Customers, And Organizations. Ethical Decisions Support Long-Term Professional Success. Integrity Encourages Accountability And Transparency. Respect For Rules And Standards Strengthens Workplace Culture. Honest Behavior Enhances Reputation And Credibility. Integrity Is A Fundamental Value In Every Profession.