 LMS
LMS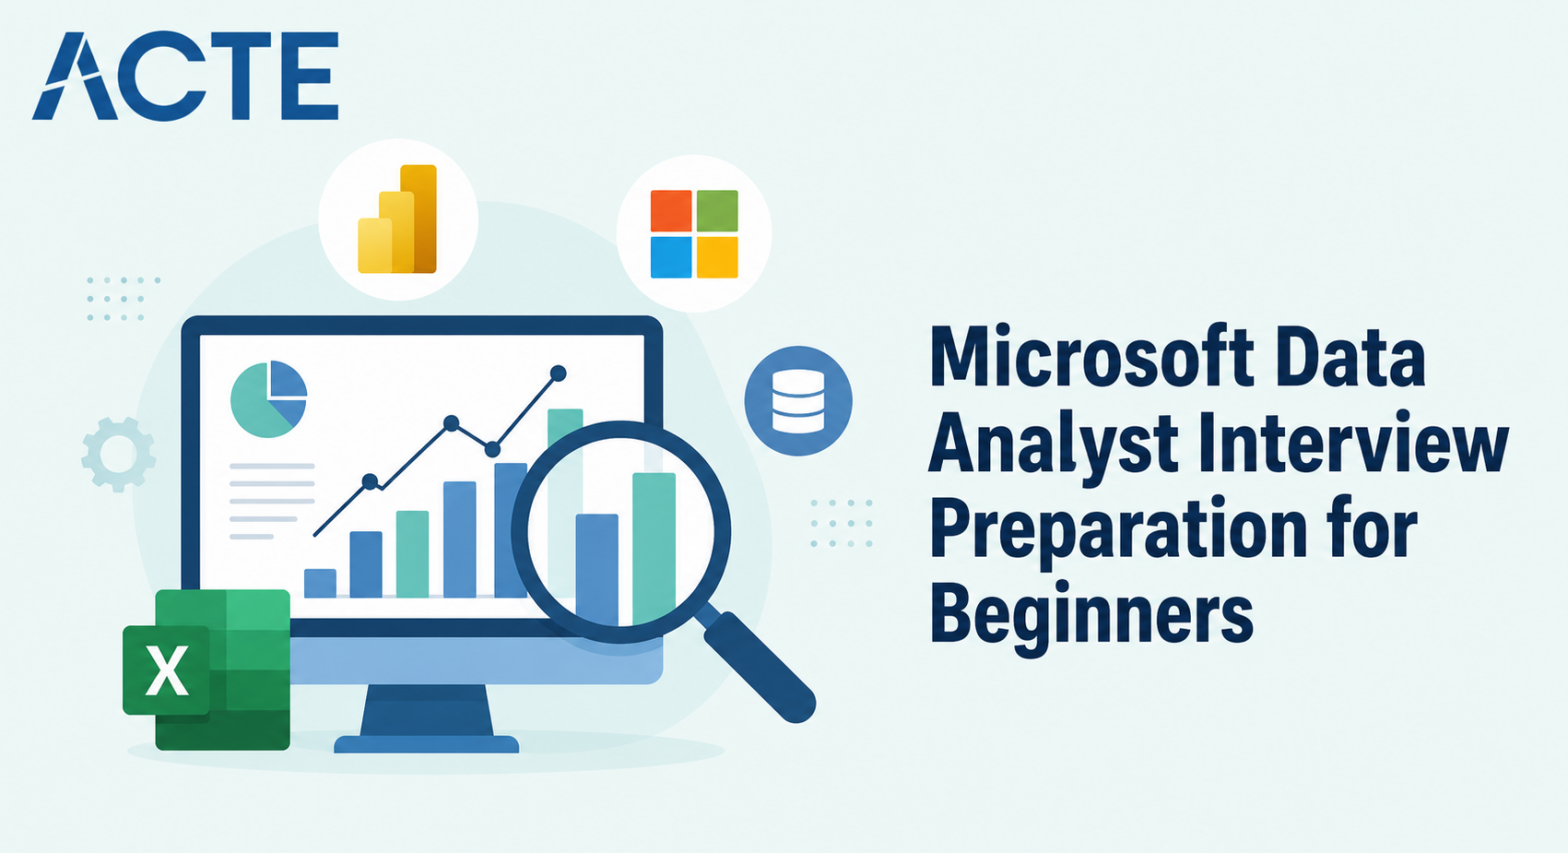
Last updated on 24th Jul 2026| 7626

preparing for a Microsoft Data Analytics Interview requires a strong understanding of data analysis concepts, SQL, Microsoft Excel, Power BI, statistics, and business intelligence fundamentals. Microsoft looks for candidates who can analyze data accurately, build meaningful dashboards, solve business problems, and communicate insights clearly to stakeholders. Beginners should focus on learning data cleaning, data visualization, database concepts, and analytical thinking while gaining hands-on experience with real-world datasets. Interview questions often include technical concepts, scenario-based problems, SQL queries, Power BI features, and behavioral questions that assess problem-solving and collaboration skills. Consistent practice with mock interviews, case studies, and Microsoft analytics tools helps build confidence and technical expertise. This guide presents 100 beginner-friendly Microsoft Data Analyst interview questions and answers designed to strengthen core knowledge, improve interview performance, and help candidates prepare successfully for Microsoft Data Analyst roles.
1. What Is Data Analysis?
Ans:
Data analysis is the process of collecting, cleaning, organizing, and interpreting data to discover useful information. It helps businesses make informed decisions based on facts rather than assumptions. A data analyst works with different datasets to identify trends and patterns. Microsoft uses data analysis to improve products and customer experiences. Common tools include Excel, SQL, Power BI, and Python. Strong analytical thinking is essential for success. Accurate analysis supports better business strategies and decision-making.
2. Why Does Want To Become A Data Analyst At Microsoft?
Ans:
Microsoft provides opportunities to work with large-scale business data and advanced technologies. The company encourages innovation and continuous learning. A data analyst can contribute by transforming raw data into meaningful insights. Microsoft values analytical thinking, collaboration, and problem-solving abilities. Working with experienced teams helps improve technical and communication skills. The role offers exposure to cloud technologies and AI-driven analytics. It is an excellent environment for career growth
3. What Are The Main Responsibilities Of A Data Analyst?
Ans:
- A data analyst gathers, cleans, and validates data from multiple sources. The role involves analyzing datasets to identify trends and business opportunities. Reports and dashboards are created for stakeholders using visualization tools.
- Analysts collaborate with business teams to understand requirements. SQL queries are written to retrieve and manipulate data efficiently.
- Data accuracy and consistency are maintained throughout the analysis process. The final goal is to support better business decisions.
4. Explain Technical Results To Non-Technical Stakeholders?
Ans:
Technical findings should be presented using simple and clear language. Visualizations such as charts and dashboards help communicate insights effectively. Complex technical terms should be minimized or explained with examples. The focus should remain on business impact rather than technical details. Key recommendations should be concise and actionable. Questions from stakeholders should be answered with supporting evidence. Clear communication is an essential skill for every Microsoft Data Analyst.
5. What Is Data Cleaning?
Ans:
Data cleaning is the process of correcting or removing inaccurate, incomplete, or duplicate data. High-quality data improves the accuracy of analysis and reporting. Common tasks include handling missing values and correcting formatting errors. Duplicate records are removed to avoid incorrect results. Outliers are reviewed before analysis. Clean data produces reliable dashboards and business insights. Data cleaning is one of the most important steps in analytics.
6. Why Is Excel Important For Data Analysts?
Ans:
Microsoft Excel is widely used for organizing and analyzing business data. It provides formulas, PivotTables, charts, and conditional formatting. Excel helps perform calculations quickly and efficiently. Data can be filtered and sorted for better analysis. Many organizations use Excel for reporting and dashboard creation. Beginners can learn analytical concepts easily using Excel. It remains one of the most valuable tools for data analysts.
7. What Is SQL?
Ans:
SQL stands for Structured Query Language and is used to manage relational databases. It allows analysts to retrieve, insert, update, and delete data. SQL queries help extract meaningful information from large datasets. Filtering, sorting, grouping, and joining tables are common operations. SQL improves efficiency when working with business data. Microsoft data analysts frequently use SQL in daily tasks. Strong SQL knowledge is essential for interview success.
8. What Is A Database?
Ans:
- A database is an organized collection of related data stored electronically. It enables users to store, retrieve, and manage information efficiently. Databases improve data security and consistency.
- Popular database systems include SQL Server, MySQL, and PostgreSQL. Businesses use databases to manage customers, products, and transactions.
- Data analysts query databases to perform business analysis. Well-designed databases improve application performance and reporting.
9. What Is Power BI?
Ans:
Power BI is Microsoft’s business intelligence and data visualization tool. It connects to multiple data sources and creates interactive dashboards. Charts, graphs, and reports help stakeholders understand business performance. Power BI supports real-time data analysis and sharing. Users can create calculated measures using DAX. It integrates well with Excel and Azure services. Power BI is a key skill for Microsoft data analyst roles.
10. What Is A Dashboard?
Ans:
A dashboard is a visual display of important business metrics and performance indicators. It combines charts, tables, and graphs into a single interface. Dashboards help managers monitor business performance quickly. Interactive filters allow users to explore data easily. Power BI is commonly used to create dashboards. Effective dashboards simplify complex information. They support faster and more informed decision-making..
11. What Is A KPI?
Ans:
KPI stands for Key Performance Indicator and measures business performance. KPIs help organizations track progress toward specific goals. Examples include revenue, customer satisfaction, and sales growth. Data analytics calculate and monitor KPIs regularly. Accurate KPIs enable better strategic decisions. Dashboards often highlight KPIs for executives. Choosing relevant KPIs improves organizational performance.
12. What Is Data Visualization?
Ans:
Data visualization presents information through charts, graphs, and dashboards. Visual reports make complex data easier to understand. Stakeholders can quickly identify trends and patterns. Effective visualizations improve communication and decision-making. Power BI and Excel are popular visualization tools. Simple and clear visuals are more effective than complex designs. Good visualization enhances business intelligence..
13. What Is A PivotTable In Excel?
Ans:
A PivotTable summarizes large datasets into meaningful reports. It allows users to group, filter, and aggregate information easily. Sales, revenue, and customer data can be analyzed quickly. PivotTables reduce manual calculations and improve productivity. Different fields can be rearranged dynamically. Charts can also be created from PivotTables. They are commonly used in business reporting.
14. What Is Data Filtering?
Ans:
- Data filtering displays only records that meet specific conditions. It helps analysts focus on relevant information.
- Filters improve report readability and reduce unnecessary data. Excel, SQL, and Power BI all support filtering.
- Multiple conditions can be applied simultaneously. Filtering speeds up data exploration. It is an essential feature in business analysis.
15. What Is Sorting In Data Analysis?
Ans:
Sorting arranges data in ascending or descending order. Analysts sort information by dates, names, revenue, or other fields. Proper sorting improves readability and analysis efficiency. It helps identify highest and lowest values quickly. Excel and SQL both provide sorting features. Sorted data supports better reporting. It is a fundamental analytical operation.
16. What Is A Primary Key?
Ans:
A primary key uniquely identifies each record in a database table. No duplicate or null values are allowed. It ensures data integrity and consistency. Primary keys help establish relationships between tables. Database performance also improves with proper indexing. SQL queries often use primary keys for efficient retrieval. Every well-designed table should have a primary key.
17. What Is A Foreign Key?
Ans:
A foreign key connects one database table with another. It references the primary key in a related table. Foreign keys maintain referential integrity between tables. They help avoid inconsistent or orphan records. SQL joins use these relationships to retrieve combined data. Proper database design depends on correct foreign key usage. They are fundamental concepts in relational databases.
18. What Is An INNER JOIN In SQL?
Ans:
An INNER JOIN combines matching records from two or more tables. Only rows with matching values are returned. It is commonly used to retrieve related business information. Analysts join customer and order tables frequently. INNER JOIN improves reporting across multiple datasets. It is one of the most frequently asked SQL interview topics. Understanding joins is essential for data analysts.
19. What Is Data Validation?
Ans:
Data validation ensures that entered information follows predefined rules. It prevents incorrect or incomplete data from being stored. Validation improves data quality and consistency. Excel provides built-in validation features for user input. Businesses use validation to reduce human errors. Reliable data leads to accurate reports and analysis. Validation is an important step in data management.
20. How Does Prepare For A Microsoft Data Analyst Interview?
Ans:
Preparation begins with strengthening Excel, SQL, and Power BI skills. Practice writing SQL queries and building interactive dashboards. Understand data cleaning, visualization, and database concepts thoroughly. Solve analytical case studies using real datasets. Review statistics, KPIs, and business intelligence fundamentals. Improve communication skills to explain analytical findings clearly. Consistent practice and confidence greatly improve interview performance.
21. What Is A LEFT JOIN In SQL?
Ans:
- A LEFT JOIN returns all records from the left table and the matching records from the right table. If there is no match, the result contains NULL values for the right table columns.
- It is useful when all records from one table must be included. Analysts often use it to identify missing relationships. LEFT JOIN helps compare datasets efficiently.
- It is widely used in reporting and data analysis. Understanding LEFT JOIN is important for SQL interviews.
22. What Is The Difference Between WHERE And HAVING
Ans:
| Feature | WHERE Clause | HAVING Clause |
|---|---|---|
| Purpose | Filters individual rows before grouping. | Filters grouped records after aggregation. |
| Works With | Individual rows and non-aggregate conditions. | Aggregate functions such as SUM(), COUNT(), AVG(), MAX(), and MIN() |
| Execution Order | Executed before the GROUP BY clause. | Executed after the GROUP BY clause. |
23. What Is GROUP BY In SQL?
Ans:
GROUP BY is used to arrange rows into groups based on one or more columns. It allows aggregate functions such as COUNT, SUM, AVG, MAX, and MIN to calculate values for each group. Businesses use GROUP BY to summarize sales, customers, or revenue. It improves report readability. Analysts use it in dashboards and reports. GROUP BY is a core SQL concept. Mastering it is essential for data analysis.
24. What Is An Aggregate Function?
Ans:
An aggregate function performs calculations on multiple rows and returns a single result. Common aggregate functions include SUM, COUNT, AVG, MIN, and MAX. They help summarize large datasets efficiently. Businesses use them to calculate revenue, averages, and totals. Aggregate functions simplify reporting. They are often combined with GROUP BY. Understanding them improves SQL query-writing skills.
25. What Is Normalization?
Ans:
Normalization is the process of organizing database tables to reduce redundancy and improve data integrity. It divides large tables into smaller related tables. This approach minimizes duplicate data. Normalization improves storage efficiency and database consistency. It also simplifies database maintenance. Analysts work with normalized databases regularly. Understanding normalization helps design better database structures.
26. What Is Denormalization?
Ans:
Denormalization combines related tables to improve query performance. It intentionally introduces some data redundancy. This approach reduces the number of joins required during reporting. It is useful for analytical workloads and data warehouses. Faster query execution is the primary advantage. However, updates become more complex. Analysts should understand when denormalization is appropriate.
27. What Is A Data Warehouse?
Ans:
- A data warehouse is a centralized repository designed for reporting and business analysis. It stores historical data collected from multiple sources.
- Data is cleaned and transformed before loading into the warehouse. Analysts use it to generate business insights. Data warehouses support fast analytical queries.
- They improve decision-making across organizations. Microsoft Azure Synapse Analytics is an example of a data warehouse solution.
28. What Is ETL?
ETL stands for Extract, Transform, and Load. Data is extracted from source systems, transformed into a usable format, and loaded into a destination database or warehouse. ETL improves data quality and consistency. It combines information from multiple sources. Businesses depend on ETL for accurate reporting. ETL processes are widely used in analytics projects. Understanding ETL is essential for data analysts.
29. What Is Data Modeling?
Ans:
Data modeling is the process of designing how data is organized and related within a database. It defines tables, relationships, keys, and business rules. A good data model improves query performance and reporting accuracy. Analysts use logical and physical data models during projects. Proper modeling reduces redundancy and errors. It supports efficient data analysis. Data modeling is a valuable analytical skill.
30. What Is DAX In Power BI?
Ans:
DAX stands for Data Analysis Expressions. It is a formula language used in Power BI to create calculated columns, measures, and custom calculations. DAX helps perform advanced business analysis. Analysts use functions such as CALCULATE, SUM, and IF. It enhances dashboards with dynamic metrics. Strong DAX knowledge improves Power BI reports. It is a key Microsoft interview topic.
31. What Is Power Query?
Ans:
Power Query is a data preparation tool available in Power BI and Excel. It connects to multiple data sources and transforms data before analysis. Analysts use it to clean, merge, filter, and reshape datasets. Power Query reduces manual work. It improves data quality before visualization. The transformation steps are repeatable and automated. It is widely used in Microsoft analytics solutions..
32. What Is A Calculated Column In Power BI?
Ans:
A calculated column is created using DAX formulas and stores values for every row in a table. It becomes part of the dataset after calculation. Analysts use calculated columns to derive new information. They are useful for categorization and business logic. Unlike measures, calculated columns consume storage space. They support detailed reporting. Choosing between columns and measures depends on reporting needs.
33. What Is A Measure In Power BI?
Ans:
A measure is a dynamic calculation created using DAX. It calculates results only when required in reports or dashboards. Measures are commonly used for totals, averages, and percentages. They improve storage efficiency because results are not stored permanently. Measures respond to report filters automatically. They are essential for interactive dashboards. Power BI reports rely heavily on measures.
34. What Is A Relationship In Power BI?
Ans:
A relationship connects tables based on common columns. It allows data from multiple tables to work together in reports. Relationships improve filtering and aggregation. Proper relationships create accurate dashboards. Analysts typically connect fact and dimension tables. Incorrect relationships may produce inaccurate results. Understanding relationships is essential for effective Power BI modeling.
35. What Are NULL Values?
Ans:
- NULL values represent missing or unknown information in a database. They are different from zero or empty text. Analysts must handle NULL values carefully during analysis.
- SQL provides functions such as IS NULL and COALESCE for working with missing data. Ignoring NULL values can affect calculations.
- Proper handling improves report accuracy. Data cleaning often involves managing NULL values.
36. What Is Data Integrity?
Ans:
Data integrity ensures that information remains accurate, consistent, and reliable throughout its lifecycle. Database constraints help maintain integrity. Primary keys and foreign keys prevent invalid relationships. Validation rules reduce data entry errors. Strong data integrity produces trustworthy reports. Organizations depend on reliable data for business decisions. Maintaining integrity is a key responsibility of data professionals
37. What Is Business Intelligence?
Ans:
Business Intelligence, or BI, refers to technologies and processes used to analyze business data. BI helps organizations make informed decisions using reports and dashboards. Power BI is Microsoft’s leading BI platform. Analysts transform raw data into meaningful visual insights. Business Intelligence supports strategic planning. It improves operational efficiency. BI plays a significant role in modern organizations.
38. What Is The Difference Between A Report And A Dashboard?
Ans:
- A report provides detailed analysis with multiple pages and extensive information. A dashboard presents key metrics on a single screen for quick monitoring.
- Reports allow deeper exploration of data. Dashboards focus on high-level business performance. Managers often review dashboards daily.
- Analysts prepare detailed reports for further investigation. Both tools are important in business intelligence.
39. How Does Handle Duplicate Records?
Ans:
Duplicate records are identified using unique fields or combinations of columns. SQL queries, Excel tools, and Power Query can detect duplicates efficiently. After verification, unnecessary duplicate records are removed or merged. Preventing duplicates improves data quality. Duplicate data can lead to incorrect reports and analysis. Validation rules also reduce future duplication. Maintaining clean datasets is essential for reliable insights.
40. How Does Ensure Accuracy In Data Analysis?
Ans:
Accuracy is achieved by validating data before analysis. Data is cleaned to remove duplicates, missing values, and inconsistencies. Queries and calculations are tested carefully. Reports are compared with source data for verification. Business rules are reviewed to ensure correctness. Peer reviews and automated validation improve reliability. Accurate analysis builds confidence in business decisions.
41. What Is A Fact Table?
Ans:
A fact table stores measurable business data such as sales, revenue, profit, or quantity. It usually contains numeric values that are analyzed in reports. Fact tables are connected to dimension tables through keys. They form the center of a star schema. Analysts use fact tables to calculate KPIs and business metrics. Properly designed fact tables improve query performance. They are fundamental in data warehouse design.

Learn Advanced Data Analytics Certification Training Course to Build Your Skills
Weekday / Weekend BatchesSee Batch Details42. What Is A Dimension Table?
Ans:
A dimension table contains descriptive information about business entities such as customers, products, employees, or dates. It provides context for the numeric values stored in fact tables. Dimension tables help users filter and group reports. They improve readability and business understanding. Analysts use them extensively in Power BI and SQL reporting. Well-designed dimensions simplify data analysis. They are essential components of a star schema.
43. What Is A Star Schema?
Ans:
- A star schema is a data modeling technique used in data warehouses. It consists of one central fact table connected to multiple dimension tables.
- This design simplifies analytical queries and improves performance. Power BI models commonly use star schemas.
- The structure is easy to understand and maintain. It supports efficient reporting and dashboard creation. Star schemas are widely recommended for business intelligence projects.
44. What Is A Snowflake Schema?
Ans:
A snowflake schema is an extension of the star schema where dimension tables are further normalized. This reduces data redundancy but increases the number of joins. Snowflake schemas improve data consistency. They are suitable for complex business environments. However, query performance may be slightly slower than a star schema. Analysts should understand both approaches. Choosing the right schema depends on business requirements.
45. What Is A KPI Dashboard?
Ans:
A KPI dashboard displays important business performance indicators in a visual format. It allows managers to monitor progress toward organizational goals. Charts, cards, and gauges are commonly used. Power BI makes KPI dashboard creation simple and interactive. Dashboards provide real-time insights into business performance. Users can quickly identify trends and issues. Effective dashboards support faster decision-making.
46. What Is Data Profiling?
Ans:
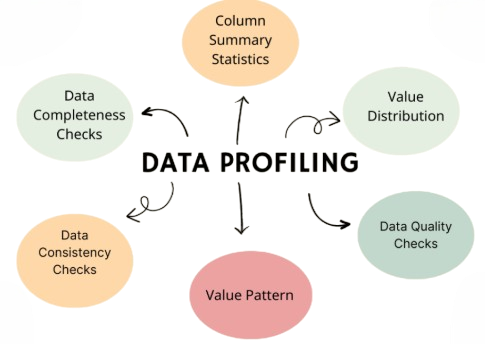
Data profiling is the process of examining data to understand its quality, structure, and content. Analysts identify missing values, duplicates, inconsistencies, and unusual patterns. Profiling helps detect potential data quality issues before analysis. It improves confidence in business reports. Power Query provides useful profiling features. Good profiling saves time during data preparation. It is an important step in analytics projects.
47. What Is Data Transformation?
Ans:
Data transformation converts raw data into a suitable format for analysis. Common transformations include filtering, merging, splitting, renaming, and changing data types. Analysts use Power Query and SQL for these tasks. Transformation improves data consistency and usability. Clean and transformed data produces accurate reports. It is a major part of the ETL process. Effective transformation enhances business insights
48. What Is Data Governance?
Ans:
Data governance is the process of managing data quality, security, availability, and compliance across an organization. It establishes standards for data management. Governance ensures that business data remains accurate and trustworthy. It defines responsibilities for maintaining data assets. Organizations use governance to meet legal and regulatory requirements. Strong governance improves collaboration. It supports reliable business intelligence..
49. What Is Data Security?
Ans:
- Data security protects information from unauthorized access, misuse, or loss. Organizations implement authentication, encryption, and access controls to safeguard data.
- Analysts should access only authorized datasets. Secure handling of business information builds customer trust.
- Data security reduces the risk of breaches. Microsoft emphasizes secure data practices across its platforms. Protecting sensitive information is a shared responsibility.
50. What Is Row-Level Security In Power BI?
Ans:
Row-Level Security, or RLS, restricts data access based on user roles. Different users see only the records they are authorized to view. This improves confidentiality in shared reports. RLS is configured using roles and DAX filters. Businesses use it to protect sensitive information. It supports secure reporting for multiple departments. Understanding RLS is valuable for Microsoft interviews.
51. What Is Conditional Formatting In Power BI?
Ans:
Conditional formatting automatically changes the appearance of report elements based on data values. Colors, icons, and data bars highlight important information. It helps users identify trends and exceptions quickly. Analysts use it to improve dashboard readability. Conditional formatting makes reports more interactive. It supports better decision-making through visual emphasis. Proper use enhances the user experience.
52. What Is Drill-Down In Power BI?
Ans:
Drill-down allows users to move from summary data to more detailed information within a report. For example, sales can be viewed by year, quarter, month, and day. This feature supports deeper analysis without creating separate reports. Users interact with charts to explore details. Drill-down improves report flexibility. It enables better understanding of business performance. Interactive analysis is one of Power BI’s strengths
53. What Is A Slicer In Power BI?
Ans:
A slicer is a visual filter that allows users to interactively filter report data. It can filter information by product, region, date, or other categories. Slicers make dashboards easy to use. They update all related visuals instantly. Analysts use slicers to improve report interactivity. They provide a better user experience than static reports. Slicers are commonly used in business dashboards.
54. What Is A Scatter Chart?
Ans:
A scatter chart displays the relationship between two numerical variables. Each point represents one data record. Analysts use scatter charts to identify trends, patterns, and outliers. They help determine whether variables are positively or negatively correlated. Power BI supports interactive scatter charts. These visuals are useful for business analysis. They simplify complex data relationships.
55. What Is A Line Chart?
Ans:
- A line chart shows changes in data over time. It is commonly used to display trends such as monthly sales or website traffic.
- The horizontal axis usually represents time, while the vertical axis represents values. Line charts make trend analysis easier.
- Analysts use them in dashboards and reports. They clearly display growth or decline. They are among the most frequently used visualizations.
56. What Is A Bar Chart?
Ans:
A bar chart compares values across different categories. It displays data using horizontal or vertical bars. Businesses use bar charts to compare products, departments, or regions. The chart makes comparisons easy to understand. Power BI offers multiple bar chart variations. Analysts select bar charts for categorical analysis. Clear labeling improves report effectiveness.
57. What Is An Outlier?
Ans:
An outlier is a data value that differs significantly from other observations. Outliers may result from data entry errors or genuine business events. Analysts investigate outliers before making conclusions. They can affect averages and statistical calculations. Identifying outliers improves analysis accuracy. Visualization tools help detect unusual values. Proper evaluation leads to more reliable insights.
58. What Is Correlation?
Ans:
Correlation measures the relationship between two variables. A positive correlation means both variables increase together, while a negative correlation means one increases as the other decreases. Zero correlation indicates no meaningful relationship. Analysts use correlation to understand business patterns. It supports predictive analysis and decision-making. Correlation does not necessarily imply causation. Careful interpretation is important.
59. What Is Trend Analysis?
Ans:
Trend analysis examines historical data to identify patterns over time. Businesses use it to forecast future performance and make strategic decisions. Analysts compare monthly, quarterly, or yearly results. Charts and dashboards help visualize trends clearly. Trend analysis identifies growth opportunities and potential risks. It supports planning and budgeting. Consistent monitoring improves business performance.
60. What Is The Difference Between Structured And Unstructured Data
Ans:
| Feature | Structured Data | Unstructured Data |
|---|---|---|
| Format | Organized in rows and columns with a predefined schema. | Does not have a predefined format or structure. |
| Storage | Stored in relational databases such as SQL Server, MySQL, or Oracle. | Stored in file systems, cloud storage, data lakes, or NoSQL databases. |
| Examples | Customer records, employee details, sales transactions, and inventory data. | Emails, images, videos, audio files, social media posts, and documents. |
| Analysis | Easy to query and analyze using SQL and reporting tools like Power BI.. | Requires advanced tools such as AI, machine learning, or natural language processing for analysis. |

Get JOB Oriented Data Analytics Training for Beginners By MNC Experts
- Instructor-led Sessions
- Real-life Case Studies
- Assignments
61. What Is Predictive Analytics?
Ans:
- Predictive analytics uses historical data, statistical techniques, and machine learning algorithms to forecast future outcomes. Businesses use predictive models to estimate sales, customer behavior, and market trends.
- Data analytics prepare and clean data before modeling. Accurate predictions help organizations make proactive decisions.
- Microsoft tools such as Azure Machine Learning support predictive analytics. Model performance should be validated before deployment. Predictive analytics improves strategic planning and business growth.
62. What Is Descriptive Analytics?
Ans:
Descriptive analytics focuses on summarizing historical data to understand what has happened in the past. It uses reports, dashboards, and visualizations to present business performance. Analysts calculate metrics such as revenue, profit, and customer growth. This type of analysis helps identify trends and patterns. Power BI is widely used for descriptive analytics. The insights support informed decision-making. It is the foundation of business intelligence.
63. What Is Diagnostic Analytics?
Ans:
Diagnostic analytics investigates the reasons behind business outcomes. Analysts compare datasets and identify relationships that explain changes in performance. Root cause analysis is a common technique in diagnostic analytics. SQL queries and Power BI dashboards help uncover insights. Businesses use this approach to solve operational problems. Understanding causes leads to better decisions. Diagnostic analytics complements descriptive reporting.
64. What Is Prescriptive Analytics?
Ans:
Prescriptive analytics recommends actions that help achieve desired business outcomes. It combines historical data, predictive models, and optimization techniques. Businesses use it to improve pricing, inventory, and resource allocation. Analysts evaluate different scenarios before making recommendations. Prescriptive analytics supports better strategic planning. Advanced analytical tools make these recommendations more effective. It helps organizations maximize business value.
65. What Is Data Mining?
Ans:
Data mining is the process of discovering hidden patterns, trends, and relationships in large datasets. It combines statistics, machine learning, and database techniques. Businesses use data mining to understand customer behavior and market opportunities. Analysts identify valuable insights from historical information. Data mining supports predictive and descriptive analytics. Accurate data improves mining results. It is an important concept in advanced analytics.
66. What Is Sampling In Data Analysis?
Ans:
Sampling involves selecting a subset of data from a larger population for analysis. It reduces processing time while maintaining meaningful results. Common sampling methods include random, systematic, and stratified sampling. Analysts use sampling when datasets are extremely large. Proper sampling reduces bias and improves reliability. The selected sample should represent the population accurately. Sampling is widely used in research and business analytics.
67. What Is A Histogram?
Ans:
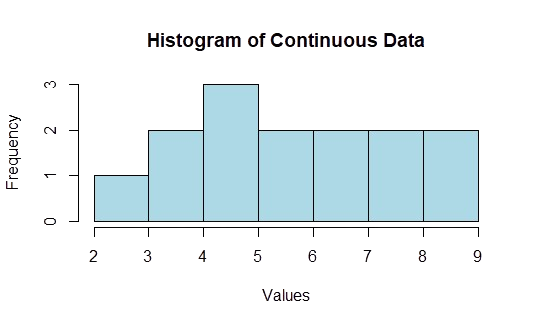
- A histogram is a chart that displays the frequency distribution of numerical data. It groups values into intervals called bins.
- Analysts use histograms to understand data distribution and identify patterns. Histograms help detect skewness, gaps, and outliers.
- They are useful during exploratory data analysis. Power BI and Excel can create histograms easily. They simplify statistical interpretation.
68. What Is A Box Plot?
Ans:
A box plot summarizes data using the minimum, first quartile, median, third quartile, and maximum values. It highlights the spread of data and identifies potential outliers. Analysts use box plots to compare multiple datasets. They provide a quick overview of data distribution. Box plots support statistical analysis. They are commonly used during exploratory data analysis. Understanding box plots improves analytical interpretation.
69. What Is The Mean?
Ans:
The mean is the average value of a dataset. It is calculated by dividing the sum of all values by the total number of observations. The mean provides a measure of central tendency. Analysts use it to summarize numerical data. Extreme values can significantly affect the mean. It is commonly used in business reporting. Understanding the mean is important for statistical analysis.
70. What Is The Median?
Ans:
The median is the middle value in an ordered dataset. If the dataset contains an even number of values, the median is the average of the two middle values. It is less affected by extreme values than the mean. Analysts use the median for skewed data distributions. The median represents the central position of data. It is widely used in statistical reporting. Choosing the correct measure improves analysis accuracy.
71. What Is The Mode?
Ans:
The mode is the value that appears most frequently in a dataset. A dataset may have one mode, multiple modes, or no mode at all. Analysts use the mode to identify common occurrences. It is especially useful for categorical data. Businesses analyze popular products or customer preferences using the mode. It complements the mean and median. Understanding all three measures improves data interpretation.
72. What Is Standard Deviation?
Ans:
Standard deviation measures how much data values vary from the mean. A low standard deviation indicates that values are close to the average. A high standard deviation indicates greater variability. Analysts use it to understand consistency and risk. It supports quality control and business forecasting. Statistical software calculates standard deviation efficiently. It is a key concept in data analysis
73. What Is Variance?
Ans:
- Variance measures the spread of data by calculating the average squared difference from the mean. It indicates how widely data points are distributed.
- Larger variance represents greater variability. Analysts use variance before calculating standard deviation. It helps compare different datasets.
- Variance is commonly used in statistics and machine learning. Understanding variance improves analytical skills.
74. What Is Probability?
Ans:
Probability measures the likelihood of an event occurring. It ranges from 0 to 1, where 0 represents an impossible event and 1 represents a certain event. Analysts use probability to assess risks and predict outcomes. Business forecasting often relies on probability models. It supports decision-making under uncertainty. Probability is a fundamental statistical concept. Strong knowledge benefits every data analyst.
75. What Is Hypothesis Testing?
Ans:
Hypothesis testing is a statistical method used to determine whether an assumption about data is supported by evidence. Analysts compare a null hypothesis with an alternative hypothesis. Statistical tests calculate whether observed differences are significant. Businesses use hypothesis testing for product improvements and experiments. Reliable data is essential for valid conclusions. Proper interpretation prevents incorrect decisions. It is widely used in analytical projects.
76. What Is A P-Value?
Ans:
A p-value measures the strength of evidence against the null hypothesis. A smaller p-value indicates stronger evidence that the observed result is unlikely to have occurred by chance. Analysts compare the p-value with a significance level before drawing conclusions. Proper interpretation supports reliable statistical decisions. P-values are commonly used in business experiments. They should always be evaluated in context. Understanding p-values strengthens analytical reasoning.
77. What Is A/B Testing?
Ans:
A/B testing compares two versions of a product, webpage, or feature to determine which performs better. Users are divided into separate groups for comparison. Analysts measure metrics such as conversion rate or user engagement. Statistical analysis determines whether differences are significant. Businesses use A/B testing to optimize customer experiences. Microsoft frequently applies experimentation in product development. A/B testing supports data-driven decisions.
78. What Is Time Series Analysis?
Ans:
- Time series analysis studies data collected over regular time intervals. Analysts identify trends, seasonality, and recurring patterns. B
- usinesses use time series analysis for forecasting sales, demand, and financial performance. Historical data helps predict future outcomes.
- Power BI visualizations support time-based analysis. Accurate forecasting improves planning. Time series analysis is valuable in business intelligence.
79. What Is Root Cause Analysis?
Ans:
Root cause analysis identifies the underlying reason for a problem instead of treating only its symptoms. Analysts examine data, processes, and business events to determine the primary cause. Techniques such as the Five Whys and Fishbone Diagram are commonly used. Understanding the root cause leads to effective solutions. Businesses reduce recurring issues through systematic analysis. Data supports objective decision-making. Root cause analysis improves operational efficiency.
80. How Does Prioritize Multiple Analytical Tasks?
Ans:
Analytical tasks should be prioritized based on business impact, urgency, and stakeholder requirements. High-priority projects that affect critical decisions are completed first. Deadlines and available resources should be considered during planning. Progress should be communicated regularly to stakeholders. Proper documentation helps manage multiple assignments efficiently. Time management and organization improve productivity. Effective prioritization ensures consistent delivery of high-quality analytical results.
81. How Does Handle Missing Data In A Dataset?
Ans:
Missing data should first be identified to understand its impact on the analysis. Analysts determine whether the missing values occurred randomly or due to a specific issue. Depending on the situation, missing values may be removed, replaced with averages or medians, or estimated using suitable methods. The chosen approach should preserve data quality. Documentation of the process ensures transparency. Proper handling improves the accuracy of reports. Managing missing data is a fundamental analytical skill
82. What Is Exploratory Data Analysis (EDA)?
Ans:
Exploratory Data Analysis, or EDA, is the process of examining datasets before formal modeling begins. Analysts use statistics and visualizations to understand distributions, trends, and relationships. EDA helps identify missing values, outliers, and inconsistencies. Charts and summary statistics simplify interpretation. This process improves data quality and supports better decision-making. Power BI, Excel, and Python are commonly used for EDA. It is an essential first step in analytics projects.
83. What Is A Data Dictionary?
Ans:
A data dictionary is a document that describes the meaning, format, and purpose of each data field. It includes column names, data types, constraints, and business definitions. Analysts use it to understand datasets quickly. A well-maintained data dictionary improves collaboration between technical and business teams. It reduces confusion and ensures consistency. Documentation also simplifies future maintenance. Every analytics project benefits from a clear data dictionary.
84. What Is Metadata?
Ans:
- Metadata is information that describes other data. It includes details such as file names, creation dates, data types, and source information.
- Metadata helps users understand where data originated and how it should be used. Analysts rely on metadata during data integration and reporting.
- Proper metadata management improves data governance. It also supports faster data discovery. Good metadata enhances overall data quality.
85. What Is SQL Indexing?
Ans:
SQL indexing improves database performance by allowing faster retrieval of records. An index works similarly to an index in a book by helping locate information quickly. Proper indexing reduces query execution time. However, excessive indexing can increase storage requirements and slow updates. Database administrators balance indexing based on workload. Analysts benefit from faster report generation. Understanding indexing improves SQL performance knowledge.
86. What Is Query Optimization?
Ans:
Query optimization is the process of improving SQL queries to execute more efficiently. Analysts reduce unnecessary calculations and retrieve only required columns. Proper indexing and efficient joins also improve performance. Optimized queries reduce database workload and response time. Faster queries improve dashboard performance. Reviewing execution plans helps identify bottlenecks. Query optimization is an important database skill
87. What Is Version Control In Analytics Projects?
Ans:
Version control tracks changes made to files, scripts, and reports over time. It allows analysts to collaborate without overwriting each other’s work. Tools such as Git maintain revision history and support teamwork. Version control also enables recovery of previous versions if needed. Proper documentation accompanies code changes. Microsoft development teams commonly use version control practices. It improves project management and collaboration.
88. What Is Data Quality?
Ans:
Data quality refers to how accurate, complete, consistent, and reliable data is for analysis. High-quality data produces trustworthy business insights. Analysts validate datasets before creating reports. Duplicate records, missing values, and incorrect formats reduce quality. Regular monitoring maintains reliable information. Good data quality supports effective business decisions. It is one of the highest priorities in analytics.
89. What Are Soft Skills Required For A Data Analyst?
Ans:
Successful data analysts require strong communication, problem-solving, and critical-thinking skills. Time management helps complete projects within deadlines. Collaboration enables analysts to work effectively with business and technical teams. Attention to detail improves report accuracy. Adaptability supports learning new technologies. Presentation skills help explain insights clearly. These soft skills complement technical expertise.
90. How Does Manage Tight Deadlines During An Analytics Project?
Ans:
- Work should be prioritized according to business impact and project deadlines. Large tasks can be divided into smaller milestones for easier tracking.
- Regular communication keeps stakeholders informed about progress. Automation tools reduce repetitive manual work. Risks should be identified early to avoid delays.
- Quality checks should never be skipped. Effective planning ensures timely delivery of accurate results.
91. Describe A Situation Where Data Helped Solve A Business Problem.
Ans:
Sales performance data may reveal declining revenue in a specific region. Further analysis can identify the products and time periods contributing to the decline. Dashboards help visualize the trend clearly. Stakeholders can then adjust marketing strategies or inventory levels. Follow-up analysis measures the effectiveness of those actions. Data-driven decisions improve business performance. This demonstrates the practical value of analytics.
92. How does Present Analytical Findings To Senior Management?
Ans:
Presentations should begin with the key business objective and the most important findings. Visual dashboards help communicate complex information clearly. Only relevant metrics and KPIs should be highlighted. Recommendations should focus on business outcomes and actionable steps. Technical details should be explained only when necessary. Questions should be answered using supporting data. Clear communication builds confidence in the analysis.
93. Why Is Attention To Detail Important For A Data Analyst?
Ans:
Small errors in data preparation or calculations can lead to incorrect business decisions. Attention to detail helps identify inconsistencies, duplicates, and missing values. Careful validation improves report accuracy. Thorough testing reduces the likelihood of mistakes. Reliable analysis increases stakeholder trust. High-quality work reflects professionalism. Attention to detail is a critical skill for every analyst.
94. What Challenges Do Beginners Face In Data Analysis?
Ans:
Beginners often struggle with understanding business requirements and selecting appropriate analytical methods. Learning SQL, Excel, and Power BI simultaneously can be challenging. Data cleaning may take longer than expected. Interpreting results correctly requires practice. Building confidence in presenting findings is another common challenge. Continuous learning helps overcome these obstacles. Practical projects accelerate skill development.
95. How Does Stay Updated With New Data Analytics Technologies?
Ans:
- Continuous learning is essential in the rapidly evolving analytics field. Analysts regularly explore new features in Microsoft Power BI, SQL Server, and Azure services.
- Reading technical blogs, official documentation, and industry articles expands knowledge. Online courses and certifications strengthen practical skills.
- Participating in webinars and technical communities encourages knowledge sharing. Hands-on practice reinforces learning. Staying updated improves career growth.
96. What Are The Most Important Microsoft Tools For A Data Analyst?
Ans:
Microsoft Excel is widely used for data preparation and analysis. SQL Server supports efficient data storage and querying. Power BI creates interactive dashboards and reports. Azure provides cloud-based analytics and data services. Power Query simplifies data transformation tasks. DAX enables advanced business calculations. Together, these tools form the core Microsoft analytics ecosystem.
97. What Mistakes Should Be Avoided During Data Analysis?
Ans:
Analysts should avoid using incomplete or inaccurate data without validation. Ignoring missing values or duplicates can produce misleading results. Business requirements must be clearly understood before beginning analysis. Visualizations should remain simple and easy to interpret. Assumptions should always be verified with data. Documentation should not be overlooked. Careful planning reduces analytical errors.
98. Why Should Microsoft Hire Data Analyst?
Ans:
A strong foundation in Excel, SQL, Power BI, and analytical thinking enables effective problem-solving. Commitment to continuous learning supports adaptation to new technologies. Attention to detail ensures accurate reports and dashboards. Collaboration and communication help deliver business value across teams. A focus on data-driven decision-making aligns with Microsoft’s culture. Professionalism and accountability contribute to project success. These qualities support long-term growth within the organization.
99. What Are Career Goals As A Data Analyst?
Ans:
- The immediate goal is to build strong expertise in data analysis, visualization, and business intelligence. Continuous improvement in SQL, Power BI, and cloud analytics remains a priority.
- Gaining experience with real-world business problems strengthens analytical capabilities. Contributing meaningful insights supports organizational success. Long-term growth includes developing advanced analytical and leadership skills.
- Professional certifications enhance technical knowledge. A commitment to lifelong learning drives career advancement.
100. What Is Final Preparation Tip For A Microsoft Data Analyst Interview?
Ans:
Review Excel, SQL, Power BI, statistics, and business intelligence concepts thoroughly before the interview. Practice SQL queries and build interactive dashboards using sample datasets. Prepare to explain analytical approaches with clear business examples. Strengthen communication skills to present insights confidently. Revise common interview questions and solve practical case studies. Stay updated with Microsoft’s analytics technologies and best practices. Consistent preparation, confidence, and a structured problem-solving approach significantly improve interview success.