 LMS

Last updated on 06th Oct 2026| 7720

Power BI Data Analyst Interview Questions For Freshers At Microsoft help candidates prepare for interviews by understanding essential concepts in data analysis, business intelligence, data visualization, and reporting. Power BI is a business intelligence tool used to transform raw data into meaningful insights through interactive dashboards, reports, and visualizations. Microsoft interviews may assess knowledge of Power Query, DAX functions, data modeling, relationships, filters, and report development. Candidates should also understand SQL basics, data cleaning, performance optimization, and how to analyze business requirements. Practicing these frequently asked interview questions and answers helps freshers strengthen technical knowledge, improve problem-solving skills, and prepare confidently for Power BI Data Analyst opportunities at Microsoft.
1. What Is Power BI?
Ans:
Power BI Is A Business Intelligence And Data Visualization Platform Developed By Microsoft. It Helps Users Connect To Different Data Sources, Transform Data, And Create Interactive Reports And Dashboards. Power BI Supports Data Analysis Through Visualizations, Filters, Measures, And Data Models. It Can Connect To Excel, SQL Server, Cloud Services, And Many Other Sources..
2. Why Is Power BI Used In Data Analytics?
Ans:
Power BI Is Used To Analyze Data And Present Business Information Through Interactive Reports And Dashboards. It Helps Identify Trends, Compare Performance, Monitor Key Performance Indicators, And Support Data-Driven Decisions. Its Data Connectivity And Transformation Features Reduce Manual Reporting Effort. Users Can Filter And Explore Information Without Rebuilding Every Report.
3. What Are The Main Components Of Power BI?
Ans:
Power BI Includes Power BI Desktop, Power BI Service, Power BI Mobile, Power BI Gateway, And Power BI Report Builder. Power BI Desktop Is Used To Connect, Transform, Model, And Visualize Data. Power BI Service Supports Online Publishing, Sharing, Collaboration, And Scheduled Refreshes. Power BI Mobile Allows Users To Access Reports On Supported Mobile Devices
4. What Is Power BI Desktop?
Ans:
- Power BI Desktop Is A Windows Application Used To Develop Data Models, Reports, And Visualizations.
- It Allows Analysts To Import Data, Clean It Using Power Query, Create Relationships, And Write DAX Expressions.
- Reports Can Include Charts, Tables, Slicers, Cards, And Other Visual Elements. Completed Reports Can Be Published To The Power BI Service When Appropriate Permissions And Licensing Are Available
5. What Is Power BI Service?
Ans:
Power BI Service Is Microsoft’s Cloud-Based Business Intelligence Platform For Publishing, Sharing, And Managing Power BI Content. It Supports Workspaces, Semantic Models, Reports, Dashboards, Apps, And Scheduled Data Refreshes. Teams Can Collaborate And Distribute analytical insights through controlled access. Features Such As Row-Level Security Help Restrict Which Data Users Can See.
6. What Is The Difference Between Power BI Desktop And Power BI Service?
Ans:
| Aspect | Power BI Desktop | Power BI Service |
|---|---|---|
| Definition | Power BI Desktop Is A Windows Application Used To Create Data Models And Interactive Reports. | Power BI Service Is A Cloud-Based Platform Used To Publish, Share, And Manage Power BI Content. |
| Purpose | Used To Connect, Transform, Model, And Visualize Data. | Used To Share Reports, Collaborate With Teams, And Distribute Business Insights. |
| Features | Supports Power Query, DAX Calculations, Data Modeling, And Report Design. | Supports Workspaces, Dashboards, Apps, Scheduled Refreshes, And Online Collaboration. |
| Accessibility | Installed And Run On A Windows Computer. | Accessed Primarily Through A Web Browser And Supported Applications, Subject To Permissions. |
7. What Is A Power BI Report?
Ans:
A Power BI Report Is An Interactive Collection Of Visualizations Built From A Semantic Model Or Data Model. It Can Contain Multiple Pages With Charts, Tables, Maps, Cards, And Filters. Users Can Explore Data Through Slicers, Drill-Downs, Cross-Filtering, And Tooltips. Reports Help Answer Specific Business Questions And Explain performance trends
8. What Is A Dashboard In Power BI?
Ans:
A Power BI Dashboard Is A Single-Page Canvas Available In The Power BI Service That Displays Tiles From One Or More Reports Or Data Sources. It Provides A High-Level Overview Of Important Business Metrics. Users Can Monitor Sales, Revenue, Customer Growth, And Other Key Performance Indicators. Dashboard Tiles Can Link To Detailed Reports For Further Analysis.
9. What Is The Difference Between A Power BI Report And A Dashboard?
Ans:
- A Power BI Report Can Contain Multiple Pages And Provides Detailed, Interactive Data Exploration.
- A Dashboard Is A Single-Page Overview Available In The Power BI Service. Reports Commonly Support Detailed Filtering, Drill-Down, And Visual Interactions Across Pages.
- Dashboards Display Selected Tiles That Highlight Important Metrics From One Or More sources.
10. What Data Sources Does Power BI Support?
Ans:
- Power BI Supports Many Data Sources, Including Excel Workbooks, CSV Files, SQL Server, Azure Services, SharePoint, Web APIs, And Various Cloud Platforms.
- The Available Connectors Depend On The Source System And Power BI Features. Analysts Can Import Data Or Use Supported DirectQuery And Live Connection Options.
- Data From Multiple Sources Can Be Combined When Their Structures And Access Requirements Permit
11. What Is Power Query?
Ans:
Power Query Is A Data Connection And Transformation Technology Used To Extract, Clean, And Reshape Data Before Analysis. It Allows Analysts To Remove Duplicates, Change Data Types, Filter Rows, Merge Tables, And Handle Missing Values. Transformations Are Recorded As Repeatable Steps.
12. What Is The M Language In Power BI?
Ans:
M Is The Functional Language Used By Power Query To Define Data Extraction And Transformation Steps. It supports operations such as filtering rows, changing column types, combining tables, and connecting to data sources. Many M expressions are generated automatically when transformations are applied through the Power Query interface. Advanced users can edit expressions in the Advanced Editor.
13. What Is Data Modeling In Power BI?
Ans:
Data Modeling Organizes Tables, Columns, Relationships, And Measures To Support Accurate And Efficient Analysis. A Well-Designed Model Connects Related Data Through Appropriate keys and relationships. Analysts Often Separate Transaction Tables From Descriptive Tables Such As Products, Customers, And Dates.
14. What Is A Semantic Model In Power BI?
Ans:
A Semantic Model Organizes Data, Relationships, Measures, And Business Definitions So That Users Can Analyze Information Consistently. It Provides A Structured Layer Between Data Sources And Reports. Analysts Can Define Measures Such As Total Sales, Profit Margin, And Year-To-Date Revenue. Multiple Reports May Reuse The Same Semantic Model When Access And Compatibility Requirements Are Met.
15. What Is A Relationship In Power BI?
Ans:
A Relationship Connects Tables Through Columns That Represent Related Data, Such As Customer IDs Or Product IDs. Relationships Allow Filters And Calculations To Work Across Multiple Tables. Power BI Supports Different Cardinalities, Including One-To-Many And Many-To-Many. Analysts Must Choose Appropriate relationship directions and active relationships for the intended calculations
16. What Is Data Cleaning In Power BI?
Ans:
Data Cleaning Is The Process Of Identifying And Correcting Issues In A Dataset Before Analysis. It Includes Removing Duplicates, Handling Missing Values, Correcting Data Types, And Standardizing Inconsistent Formats. Power Query Provides Tools To Perform These Operations Through Repeatable Transformation Steps.
17. How Does Remove Duplicate Rows In Power BI?
Ans:
Duplicate Rows Can Be Removed Using The Remove Duplicates Option In Power Query Editor. The Relevant Column Or Combination Of Columns Must Be Selected Before Applying The Operation. For Example, Customer Records May Be Checked Using Customer ID To Identify Repeated Entries.
18. How Does Handle Missing Values In Power BI?
Ans:
- Missing Values Can Be Handled By Replacing Them, Removing Affected Rows, Or Preserving Them As Blank Values.
- The Appropriate Method Depends On The Meaning Of The Data And The Business Requirement. For Example, A Missing Product Description May Be Replaced With A Label, While A Missing Sales Amount Requires Investigation.
- Power Query Can Filter Rows And Replace Values During Data Preparation. Analysts Should Document Their Decisions To Avoid Introducing Bias Or Incorrect Assumptions.
19. What Is Data Profiling In Power Query?
Ans:
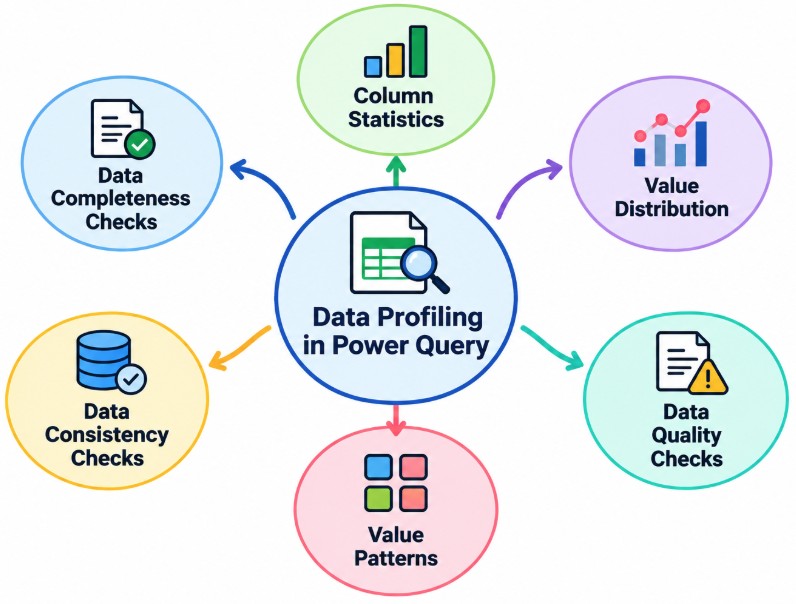
Data Profiling Helps Analysts Understand The Quality, Distribution, And Structure Of A Dataset. Power Query Provides Column Quality, Column Distribution, And Column Profile Features. These Features Help Identify Errors, Empty Values, Distinct Values, And Statistical Summaries. Profiling Can Reveal Inconsistent Categories Or Unexpected Data Types Before Modeling Begins.
20. What Is The Difference Between Merge And Append Queries
Ans:
Merge Queries Combines Data From Two Tables By Matching Values In Selected Columns, Similar To A Database Join. Append Queries Adds Rows From One Table To Another Table With Compatible column structures. For Example, Customer Details From Two Sources Can Be Merged Using Customer ID. Monthly Sales Tables Can Be Appended To Create A Combined Sales Dataset.
21. What Is Query Folding?
Ans:
Query Folding Occurs When Power Query Translates Supported Transformation Steps Into A Query That The Data Source Executes. This Can Reduce The Amount Of Data Transferred To Power BI And Improve Refresh Performance. Query Folding Depends On The Connector, Data Source, And Transformations Applied. Some Operations May Prevent Later Steps From Being Folded.
22. What Is Data Refresh In Power BI?
Ans:
- Data Refresh Updates The Data Available To A Power BI Semantic Model From Its Connected Sources. It Helps Reports Reflect New Transactions, Updated Records, And Changes In Source Data.
- Refresh Can Be Triggered Manually Or Scheduled When Supported By The Configuration.
- Credentials, Gateway Availability, Source Permissions, And Capacity Can Affect Refresh Success. Analysts Should Monitor Refresh History And Resolve Errors To Maintain Reliable Reporting.
23. What Is Incremental Refresh?
Ans:
Incremental Refresh Updates Data Within A Defined Recent Period Instead Of Refreshing The Entire Historical Dataset Every Time. It Uses Configured Date Parameters And Refresh Policies To Manage Historical And Recent Data Partitions. This Can Reduce Refresh Duration And Resource Consumption For Large Datasets. The Data Source And Connector Must Support The Required Query Behavior For The Configuration.
24. What Is DirectQuery In Power BI?
Ans:
- DirectQuery Allows Power BI To Query Data In A Supported Source Without Importing The Entire Dataset Into The Semantic Model.
- It Can Help With Large Datasets Or Scenarios Requiring Source-Based Data Access. Report Interactions May Generate Queries Against The Underlying Source.
- Performance Depends On Source Capacity, Network Latency, Model Design, And Query Complexity.
25. What Is Import Mode In Power BI?
Ans:
Import Mode Loads Data Into The Power BI Semantic Model For Analysis. It Often Provides Fast Report Interactions Because Queries Can Be Answered From The In-Memory Model. Data Must Be Refreshed To Include Source Changes, Unless Other Supported features alter the data-access process. Import Mode Can Provide Strong Compression And Analytical Performance.
26. What Is The Difference Between Import Mode And DirectQuery?
Ans:
Import Mode Stores A Copy Of Data In The Power BI Semantic Model, While DirectQuery Retrieves Data Through Queries To The Underlying Source. Import Mode Often Provides Faster Interactions But Requires Refresh To Update Imported Data. DirectQuery Can Reflect Source Changes More Directly, Depending On Caching And Configuration, But May Have Higher Query Latency..
27. What Is A Star Schema?
Ans:
A Star Schema Is A Data Modeling Design That Contains A Central Fact Table Connected To Multiple Dimension Tables. The Fact Table Stores measurable business events, such as sales quantities and transaction amounts. Dimension Tables Describe entities such as products, customers, locations, and dates. This structure simplifies filtering, aggregation, and DAX calculations
28. What Is The Difference Between Fact And Dimension Tables?
Ans:
A Fact Table Stores Business Events And Measurable Values, Such As Revenue, Quantity, And Transaction Counts. A Dimension Table Stores Descriptive Attributes, Such As Product Names, Customer Categories, And Geographic Regions. Fact Tables Often Contain Foreign Keys That Connect Them To Dimension Tables. Dimension Tables Help Users Filter And Group Measures By Business Attributes.
29. What Is Cardinality In Power BI Relationships?
Ans:
Cardinality Defines How Values In One Table Relate To Values In Another Table. One-To-Many Relationships Are Common When A Unique Dimension Key Connects To Multiple Fact Records. One-To-One Relationships Connect Unique Values On Both Sides, While Many-To-Many Relationships Allow Repeated values in both tables. Incorrect cardinality can cause unexpected filtering or ambiguous calculations
30. What Is A Date Table In Power BI?
Ans:
A Date Table Contains A Continuous Set Of Dates And Related Attributes Such As Year, Quarter, Month, And Week. It Supports Consistent Time-Based Analysis Across Sales, Finance, And Operational Data. The Table Should Have Unique Dates And Usually One Row Per Calendar Day. Marking An Appropriate Table As A Date Table Helps Enable Certain Time Intelligence Features..
31. What Is DAX In Power BI?
Ans:
- DAX Stands For Data Analysis Expressions And Is Used To Create Measures, Calculated Columns, And Calculated Tables.
- It Supports Aggregations, Conditional Logic, Filtering, And Time-Based Calculations. Functions Such As SUM, CALCULATE, FILTER, And DISTINCTCOUNT Are Commonly Used In Analytical Models.
- DAX Expressions Evaluate According To The Data Model And Its Filter Context. Understanding DAX Helps Analysts Create Accurate And Reusable Business Metrics.
32. What Is The Difference Between A Measure And A Calculated Column?
Ans:
A Calculated Column Is Evaluated For Each Row During Data Processing And Its Results Are Stored In The Model. A Measure Is Evaluated When A Report Query Runs And Responds To The Current Filter Context. Calculated Columns Are Useful For Row-Level Categories And Relationship Keys. Measures Are Better Suited For Dynamic Aggregations Such As Total Sales And Profit Margin. Choosing The Correct Approach Can Improve Model Efficiency And Calculation Accura
33. What Is The SUM Function In DAX?
Ans:
The SUM Function Adds All Numeric Values In A Specified Column, Subject To The Applicable Filter Context. For Example, Total Sales = SUM(Sales[SalesAmount]) Calculates The Total Sales Amount. Filters From Slicers And Related Tables Can Change The Result Displayed In A Visual. SUM Is Commonly Used In Financial And Operational Reports. The Column Should Contain Suitable Numeric Data For Meaningful Results.
34. What Is The CALCULATE Function In DAX?
Ans:
CALCULATE Evaluates An Expression Under A Modified Filter Context. It Can Apply New Filters Or Change Existing Filters To Produce A Specific Analytical Result. For Example, A Measure Can Use CALCULATE To Compute Sales For A Particular Product Category. The Function Is Central To Many Advanced DAX Calculations. Understanding Filter Context And Relationships Is Essential For Using CALCULATE Correctly.
35. What Is Filter Context In DAX?
Ans:
Filter Context Is The Set Of Filters That Determines Which Data Rows Are Considered During A DAX Calculation. It Can Come From Visualizations, Slicers, Page Filters, Report Filters, And DAX Expressions. For Example, A Sales Measure Displayed For One Region Calculates Using The Applicable Regional Filter. Different Filter Contexts Can Produce Different Results From The Same Measure
36. What Is Row Context In DAX?
Ans:
Row Context Refers To The Current Row Being Evaluated In A DAX Expression. It Commonly Appears In Calculated Columns And Iterating Functions Such As SUMX. For Example, A Calculated Column Can Multiply Quantity By Unit Price For Each Transaction. Row Context Is Different From Filter Context, Which Determines The Set Of Rows Available To A Calculation. Understanding The Difference Helps Prevent Incorrect Results In More Complex DAX Expressions.
37. What Is The Difference Between SUM And SUMX?
Ans:
| Aspect | SUM | SUMX |
|---|---|---|
| Definition | SUM Adds All Numeric Values In A Specified Column. | SUMX Evaluates An Expression For Each Row And Adds The Results. |
| Usage | Used When The Required Values Already Exist In A Numeric Column. | Used When Values Must Be Calculated From An Expression Before Summation. |
| Calculation | Aggregates A Single Column Within The Applicable Filter Context. | Iterates Through A Table, Evaluates A Row-Level Expression, And Sums The Results. |
| Example | SUM(Sales[SalesAmount]) Calculates The Total Sales Amount. |
SUMX(Sales, Sales[Quantity] * Sales[UnitPrice]) Calculates Total Sales From Quantity And Unit Price. |
38. What Is DISTINCTCOUNT In DAX?
Ans:
DISTINCTCOUNT Returns The Number Of Unique Values In A Specified Column Within The Current Filter Context. It Is Useful For Calculating Unique Customers, Orders, Products, Or Transactions. For Example, A Distinct Customer Measure Can Show How Many Different Customers Purchased During A Selected Period. Repeated Customer IDs Are Counted Only Once Within The Relevant Context. Analysts Should Consider How Blank Values And Filters Affect The Result.
39. What Is The IF Function In DAX?
Ans:
- The IF Function Evaluates A Logical Condition And Returns One Value When The Condition Is True And Another When It Is False.
- For Example, A Sales Measure Can Classify Performance As “Target Achieved” Or “Target Not Achieved.” The Function Can Be Used In Measures And Calculated Columns.
- Nested IF Expressions Are Possible, Although SWITCH May Be More Readable For Multiple categories. Correct condition ordering is important to avoid unintended classifications.
40. What Is The SWITCH Function In DAX?
Ans:
- The SWITCH Function Evaluates An Expression Against Multiple Possible Values And Returns The Corresponding Result.
- It Can Make Complex Categorization Logic Easier To Read Than Repeated Nested IF Statements.
- For Example, A Sales Performance Measure May Return Different Labels For High, Medium, And Low Results.

Learn Advanced Data Analytics Certification Training Course to Build Your Skills
Weekday / Weekend BatchesSee Batch Details41. What Is Time Intelligence In Power BI?
Ans:
Time Intelligence Refers To DAX Techniques Used To Analyze Measures Across Different Time Periods. Common Examples Include Year-To-Date Sales, Previous Month Sales, And Year-Over-Year Growth. Functions Such As TOTALYTD And SAMEPERIODLASTYEAR Can Support These Calculations. Reliable time intelligence generally requires a well-structured date table and suitable relationships.
42. How Does Calculate Year-To-Date Sales In Power BI?
Ans:
Year-To-Date Sales Measures The Total Sales From The Beginning Of The Relevant Year Through The Selected Date. A Typical DAX Measure Is Sales YTD = TOTALYTD([Total Sales], ‘Date'[Date]). The Calculation Depends On The Date Context And The Relationships In The Semantic Model. A Proper Date Table Helps Ensure Consistent Calendar-Based Results.
43. How Does Calculate Year-Over-Year Growth?
Ans:
Year-Over-Year Growth Compares A Metric For A Selected Period With The Equivalent Period In The Previous Year. Analysts First Calculate Current-Period And Prior-Year Values Using Appropriate DAX Measures. The Growth Percentage Is Calculated As The Difference Divided By The Prior-Year Value, Multiplied By 100. The Formula Requires Careful Handling When The Prior-Year Value Is Zero Or Blank
44. What Is DIVIDE In DAX?
Ans:
- DIVIDE Performs Division And Allows A Result To Be Specified When The Denominator Is Zero Or Blank.
- For Example, Profit Margin = DIVIDE([Total Profit], [Total Sales], 0) Returns Zero When The Denominator Cannot Be Used For Division.
- This Helps Avoid Unwanted Division Errors In Reports. The Alternate Result Should Match The Business Meaning Of The Metric.
45. What Is The Difference Between COUNT And DISTINCTCOUNT?
Ans:
COUNT Counts Nonblank Values In A Supported Column, Including Repeated Values. DISTINCTCOUNT Counts Unique Values And Does Not Count Repeated Entries Separately. For Example, If A Customer ID Appears Five Times In A Sales Table, COUNT Can Count Those Occurrences While DISTINCTCOUNT Counts The Unique Customer Once. The Exact Result Depends On The Column Type And Blank Values
46. What Is RELATED In DAX?
Ans:
RELATED Retrieves A Value From A Related Table Through An Existing Relationship. It Is Commonly Used When A Row In One Table Needs An Attribute From The One-Side Of A Relationship. For Example, A Sales Table Can Retrieve A Product Category From The Product Dimension. RELATED Typically Requires An Appropriate relationship and row context. It Is Useful For Certain Calculated Columns And Row-Based Expressions..
47. What Is ALL In DAX?
Ans:
ALL Returns All Rows Or Values From A Specified Table Or Column By Removing Applicable Filters From That Target. It Is Often Used Within CALCULATE To Compare Filtered Results With A Broader Total. For Example, It Can Help Calculate Each Product’s Percentage Of Overall Sales. Its Effect Depends On The Arguments And The Surrounding DAX Expression. Analysts Must Understand Filter Context To Avoid Misinterpreting The Result.
48. What Is RANKX In DAX?
Ans:
RANKX Calculates The Rank Of An Expression Across A Specified Table Or Set Of Values. It Can Rank Products By Revenue, Employees By Sales, Or Regions By Profit. The Result Depends On The Table Being Evaluated, The Expression, And The Selected ranking options. Ties Can Be Handled Using Different ranking behaviors supported by the function. Analysts Should Test Ranking Measures Under Different Slicer And Filter Conditions.
49. What Is A KPI In Power BI?
Ans:
A Key Performance Indicator, Or KPI, Is A Metric Used To Evaluate Progress Toward A Business Objective. Examples Include Revenue Growth, Customer Retention, Conversion Rate, And Profit Margin. Power BI Can Display KPIs Through Cards, Charts, Conditional Formatting, And KPI Visuals. Effective KPIs Include Clear definitions, targets, and relevant time periods. They Help Stakeholders Understand Performance And Identify Areas Requiring Action.
50. What Is Conditional Formatting In Power BI?
Ans:
Conditional Formatting Changes The Appearance Of Visual Elements Based On Values Or Rules. It Can Apply Colors, Data Bars, Icons, Or Font Formatting To Highlight Important results. For Example, A Sales Table Can Show Profitable Products In One Color And Loss-Making Products In Another. Conditional Formatting Helps Users Identify Patterns And Exceptions Quickly.
51. What Are The Different Visualizations Available In Power BI?
Ans:
Power BI Provides Bar Charts, Column Charts, Line Charts, Pie Charts, Tables, Matrices, Cards, Maps, Scatter Charts, And Many Other Visuals. Each Visualization Supports Different Analytical Purposes. Line Charts Are Useful For Trends, While Bar Charts Help Compare Categories. Cards Highlight Individual Metrics, And Tables Display Detailed Records.
52. What Is A Slicer In Power BI?
Ans:
A Slicer Is An Interactive Visual That Allows Users To Filter Report Data By Selecting Specific Values. Slicers Can Use Fields Such As Date, Product Category, Region, And Customer Segment. They Help Users Explore Different Perspectives Without Creating Separate Reports. Multiple Slicers Can Work Together To Refine The Displayed Results. Analysts Should Configure Slicer Interactions Carefully To Ensure That Filtering Behaves As Expected.s.
53. What Is Drill-Down In Power BI?
Ans:
Drill-Down Allows Users To Explore Data At Increasing Levels Of Detail Within A Visual Hierarchy. For Example, A Sales Chart Can Display Yearly Results And Allow Users To Navigate To Quarters, Months, And Days. It Helps Reveal Patterns That May Be Hidden In Summary-Level Data. Drill-Down Requires A Suitable hierarchy or compatible fields in the visual. It Supports Detailed Exploration Without Requiring Separate Charts For Every Level.
54. What Is Drill-Through In Power BI?
Ans:
Drill-Through Allows Users To Navigate From A Summary Visual To A Dedicated Report Page Filtered For A Selected Data Point. For Example, Selecting A Product In A Sales Report Can Open A Detailed Page Showing Its Revenue, Quantity, And Regional Performance. The Destination Page Uses Configured Drill-Through Fields To Carry Relevant Filter Values
55. What Are Tooltips In Power BI?
Ans:
Tooltips Display Additional Information When A User Hovers Over A Data Point In A Visual. They Can Show Values Such As Sales, Profit, Percentage Change, Or Category Details. Power BI Also Supports Report Page Tooltips That Display A Custom-designed page in the tooltip area. Tooltips Provide Context Without Overloading The Main Dashboard.
56. What Is A Card Visual In Power BI?
Ans:
- A Card Visual Displays A Key Value Such As Total Revenue, Total Customers, Profit, Or Order Count.
- It Helps Stakeholders Quickly Understand An Important Metric Without Examining A Detailed Chart. Cards Can Respond To Slicers And Filters When Their Measures Are Designed Accordingly.
- Multiple Cards Are Often Arranged At The Top Of An Executive Dashboard. Clear Labels, Suitable Formatting, And Meaningful Comparisons Make Card Visuals More Useful.
57. What Is A Matrix Visual In Power BI?
Ans:
A Matrix Visual Displays Data In A Row-And-Column Structure With Support For Hierarchies And Aggregated Values. It Is Similar To A PivotTable In Excel And Can Summarize Measures Across Multiple categories. For Example, A Sales Matrix Can Show Revenue By Region, Product Category, And Year. Users Can Expand Or Collapse hierarchical levels to explore details. Matrices Are Useful For Financial Reports, Cross-Tabulations, And Detailed Business Analysis.
58. What Is The Difference Between A Bar Chart And A Column Chart?
Ans:
A Bar Chart Displays Categories Horizontally And Values Along The Horizontal Axis. A Column Chart Displays Categories Along The Horizontal Axis And Values Vertically. Bar Charts Are Often Suitable For Long Category Names And Ranking Comparisons. Column Charts Can Work Well For Comparing A Smaller Number Of Categories Or Periods. Both Visuals Should Use Appropriate Scales, Labels, And Sorting To Communicate Differences Clearly.
59. When Should Use A Line Chart?
Ans:
A Line Chart Is Useful For Showing Changes In A Measure Across An Ordered Sequence, Especially Time. It Can Display Monthly Revenue, Daily Website Traffic, Or Yearly Customer Growth. Multiple Lines Can Compare Trends Across Products Or Regions. Analysts Should Ensure That The Horizontal Axis Is Ordered Correctly And That Comparisons Remain Readable.
60. What Is A Bookmark In Power BI?
Ans:
A Bookmark Saves A Configured View Of A Report, Including Supported Display States, Filters, And Selections. Bookmarks Can Be Used With Buttons To Create Navigation, Guided Presentations, Or Show-And-Hide Experiences. For Example, A Dashboard May Use Bookmarks To Switch Between Summary And Detailed Views.
61. What Is Cross-Filtering In Power BI?
Ans:
Cross-Filtering Occurs When A Selection In One Visual Filters Data Displayed In Another Visual. For Example, Selecting A Region In A Sales Chart Can Update A Product Chart To Show Results For That Region. Cross-Highlighting Can Also Emphasize A Related Portion Of Data Without Removing The Remaining Context. Visual Interaction Settings Control How Charts Respond To One Another..

Get JOB Oriented Data Analytics Training for Beginners By MNC Experts
- Instructor-led Sessions
- Real-life Case Studies
- Assignments
62. What Is A Custom Visual In Power BI?
Ans:
A Custom Visual Is A Visualization That Extends The Standard Visuals Available In Power BI. It Can Provide Specialized Charts, Advanced Formatting, Or Industry-Specific Analytical Capabilities. Custom Visuals May Be Obtained Through Microsoft AppSource Or Developed Using Supported development tools. Organizations Should Review Security, Certification, Performance, And Governance Requirements Before Using Them.
63. How Does Design An Effective Power BI Dashboard?
Ans:
- An Effective Power BI Dashboard Starts With Clear Business Objectives And A Defined Audience.
- Important KPIs Should Appear Prominently, With Supporting Charts Organized In A Logical Order.
- Consistent Colors, Readable Labels, Appropriate Scales, And Useful Filters Improve Usability.
64. How Does Choose The Right Chart For Data Analysis?
Ans:
The Right Chart Depends On The Question Being Answered And The Structure Of The Data. Bar Charts Compare Categories, Line Charts Show Trends, And Scatter Charts Examine Relationships Between Numeric Variables. Tables And Matrices Support Detailed Inspection, While Cards Highlight Individual Metrics. Pie Charts Are Best Reserved For Simple Part-To-Whole Comparisons With Few Categories
65. What Is Data Storytelling In Power BI?
Ans:
Data Storytelling Combines Data, Visualizations, And Context To Explain What Happened And Why It Matters. It Starts With A Business Question And Organizes Findings Into A Logical Sequence. For Example, A Sales Report May Highlight Revenue Decline, Identify Underperforming Regions, And Show Potential Contributing Factors. Clear Titles, annotations, and comparisons help communicate the evidence
66. What Is SQL And Why Is It Important For A Power BI Data Analyst?
Ans:
SQL Is A Language Used To Query And Manage Data In Relational Databases. Power BI Data Analysts Use SQL To Retrieve Records, Filter Datasets, Join Tables, And Aggregate Business Metrics. It Helps Validate Data Before Loading It Into Power BI. SQL Can Also Support Source-Level Transformations And Performance Optimization.
67. What Is The Difference Between WHERE And HAVING In SQL?
Ans:
WHERE Filters Individual Rows Before Grouping And Aggregation Are Performed. HAVING Filters Groups After The GROUP BY Operation And Can Evaluate Aggregate Conditions. For Example, WHERE Can Select Sales Transactions From A Particular Year. HAVING Can Return Only Product Categories Whose Total Sales Exceed A Defined Amount.
68. What Is The Difference Between INNER JOIN And LEFT JOIN?
Ans:
INNER JOIN Returns Rows That Have Matching Values In Both Joined Tables. LEFT JOIN Returns All Rows From The Left Table And Matching Rows From The Right Table, With Missing Matches Represented By NULL Values. INNER JOIN Is Useful When Only Matched Records Are Required. LEFT JOIN Helps Identify Missing Relationships And Preserve All Records From The Main Table
69. What Is GROUP BY In SQL?
Ans:
GROUP BY Combines Rows That Share The Same Values In Specified Columns. It Is Commonly Used With Aggregate Functions Such As SUM, COUNT, AVG, MIN, And MAX. For Example, A Query Can Calculate Total Sales For Each Product Category. The Results Help Analysts Summarize Large Datasets Into Meaningful Business Metrics
70. What Is A Primary Key?
Ans:
A Primary Key Uniquely Identifies Each Row In A Database Table. It Must Contain Unique Values And Cannot Contain NULL Values. For Example, CustomerID Can Serve As The Primary Key In A Customer Table. Primary Keys Help Maintain Data Integrity And Support Relationships With Other Tables
71. What Is Excel’s Role In Power BI Data Analysis?
Ans:
Excel Is Commonly Used For Data Inspection, Basic Cleaning, PivotTables, Formulas, And Initial Analysis. Power BI Can Import Excel Worksheets And Tables To Build Interactive Reports. Analysts May Use Excel To Validate Totals, compare results, and investigate unusual values. Power BI Is Better Suited To Repeatable Data Models And Interactive Report Distribution
72. What Is A PivotTable In Excel?
Ans:
A PivotTable Summarizes Data By Grouping Categories And Calculating Values Such As Totals, Counts, And Averages. It Allows Users To Rearrange Rows, Columns, Filters, And Measures Without Writing Complex Formulas. For Example, Sales Can Be Summarized By Region And Product Category. PivotTables Help Explore Patterns And Validate aggregated results
73. What Is Data Normalization?
Ans:
Data Normalization Organizes Relational Database Data To Reduce Unnecessary Duplication And Improve Data Integrity. It commonly separates related entities into tables connected through keys. For Example, Customer Details May Be Stored Separately From Sales Transactions. Analytical Models Often Use A Star Schema That Denormalizes Certain descriptive attributes into dimension tables for easier reporting.
74. What Is ETL In Data Analytics?
Ans:
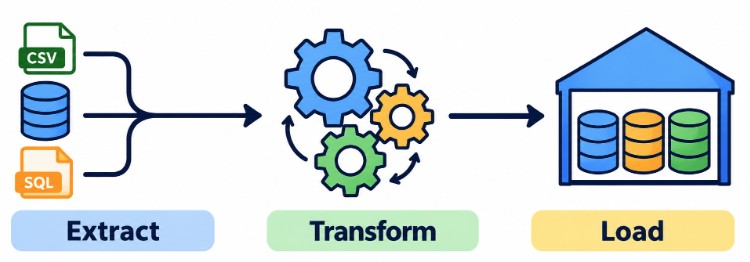
- ETL Stands For Extract, Transform, And Load. It Describes A Process In Which Data Is Retrieved From Sources, transformed into a suitable structure, and loaded into a destination.
- Power Query Can Support ETL-Style Preparation For Power BI Models. Typical transformations include cleaning values, combining tables, and converting data types.
- A Well-Designed ETL Process Improves Data Consistency And Makes Reports More Reliable
75. What Is Exploratory Data Analysis?
Ans:
Exploratory Data Analysis, Or EDA, Is The Process Of Examining Data To Understand Its Structure, Quality, Distribution, And Relationships. Analysts Use Summary Statistics, Charts, Filters, And Comparisons To Identify Trends And Unusual Values. EDA Can Reveal Missing Data, outliers, and unexpected patterns before conclusions are drawn. Power BI Visualizations Can Support Interactive Exploration Of Business Datasets.
76. What Is Row-Level Security In Power BI?
Ans:
Row-Level Security, Or RLS, Restricts Which Rows Of Data A User Can Access In A Power BI Semantic Model. It Uses Defined Roles And DAX Filter Expressions To control data visibility. For Example, Regional Managers May Be Allowed To View Only Sales Records For Their Assigned Regions. RLS Roles Must Be Configured And Tested With The Appropriate Permissions
77. What Is The Difference Between Static And Dynamic Row-Level Security?
Ans:
Static Row-Level Security Uses Fixed Filter Conditions To Restrict Data For A Defined Role. Dynamic Row-Level Security Uses Information Such As The Signed-In User’s Identity To Determine Which Rows They Can View. For Example, A Mapping Table Can Connect User Email Addresses To Their Assigned Regions. Dynamic RLS Can Simplify Access Management When Many Users Require Different Data Views. Both Approaches Must Be Tested Carefully To Ensure That Users See Only Authorized Informat
78. What Is A Gateway In Power BI?
Ans:
An On-Premises Data Gateway Enables Supported Power BI Cloud Services To Access Data Sources Located Within An Organization’s Network. It Can Support Scheduled Refreshes And Certain Live Query Scenarios, Depending On The Connection Type. The Gateway Must Be Installed, Configured, And Authorized To Access The Relevant Sources. Network Availability, Credentials, And Permissions Can Affect Its Operation.
79. What Is Customer Segmentation?
Ans:
A Power BI Deployment Pipeline Helps Teams Move Supported Content Through Development, Test, And Production Stages. It Supports A More Controlled Approach To Releasing Reports And Semantic Models. Teams Can Validate Changes In A Test Environment Before Making Them Available To Business Users. Deployment Rules And Connection Settings May Help Adapt Content To Different Environments
80. What Is The Difference Between A Workspace And An App In Power BI?
Ans:
- A Workspace Is A Collaborative Area Where Authorized Team Members Develop And Manage Power BI Content.
- A Power BI App Packages Selected Content For Distribution To A Defined Audience. Workspace Roles Control What Members Can Do Within The Workspace.
- App Permissions Help Determine Which Consumers Can Access Published Content.
81. How Does mprove Power BI Report Performance?
Ans:
- Power BI Performance Can Be Improved By Optimizing The Data Model, Removing Unnecessary Columns, And Using Appropriate Data Types. A Star Schema And Efficient DAX Measures Can Reduce Calculation Complexity.
- Analysts Should Limit Unnecessary Visuals And Avoid Expensive interactions where possible
- .Query Diagnostics, Performance Analyzer, And Source-Level Monitoring Can Help Identify Bottlenecks.
82. What Is Power BI Performance Analyzer?
Ans:
Performance Analyzer Is A Power BI Desktop Feature That Helps Identify The Time Taken By Report Visuals And Related Operations. It Records Information About Visual Refreshes And Can Help Distinguish Query Time From Other rendering activities. Analysts Can Use Its Results To Identify Slow Visuals And Investigate Their Underlying Causes. The Information Can Guide DAX, model, and visual optimization
88. How Does Validate Data In Power BI?
Ans:
Data Validation Involves Comparing Power BI Results With Trusted Source Data And Defined Business Rules. Analysts Can Check Row Counts, totals, missing values, duplicates, and relationships. SQL Queries And Excel Summaries Can Help independently verify important calculations. Filters, date ranges, and aggregation logic must match during comparisons. Documenting validation results helps establish confidence in the accuracy of reports and dashboards.
84. How Does Analyze A Sudden Drop In Sales Using Power BI?
Ans:
The First Step Is To Validate The Sales Data And Check For Missing Records, Refresh Failures, Or Reporting Errors. Next, Compare Sales Across Relevant Periods, Products, Regions, And Customer Segments. Examine Possible Factors Such As Pricing Changes, Promotions, Inventory Shortages, And Customer Behavior.
85. How Does Handle A Slow Power BI Dashboard?s?
Ans:
The Initial Step Is To Identify Which Visuals, Measures, Or Data Sources Are Causing The Delay. Performance Analyzer Can Help Investigate Visual-Level Timing, While Model And Source Diagnostics Can Reveal Other Bottlenecks. Remove Unnecessary Visuals, simplify expensive DAX expressions, and review relationships and data volume.
86. Explain A Power BI Report To A Non-Technical Stakeholder?
Ans:
Start By Explaining The Business Question The Report Addresses And The Meaning Of Its Main KPIs. Use Clear Language To Describe Important Trends, comparisons, and unusual results. Demonstrate How Filters And Slicers Can Help Explore Different Regions, Products, Or Periods. Explain The Evidence Behind Each Finding And Avoid Unverified Conclusions. Finish By Connecting The Insights To Practical Business Decisions Or Further Investigation.
87. What Is The Difference Between Power BI And Tableau
Ans:
Power BI And Tableau Are Business Intelligence Platforms Used To Analyze Data And Build Interactive Visualizations. Power BI Integrates Closely With Microsoft Tools Such As Excel, Azure, And Microsoft Fabric. Tableau Is Known For Its Flexible Data Visualization And Exploratory Analytics Capabilities. Both Platforms Support Dashboards, data connections, and business reporting.
88. What Is Microsoft Fabric, And How Is It Related To Power BI?
Ans:
Microsoft Fabric Is An Analytics Platform That Brings Together Data Engineering, Data Integration, Data Warehousing, Real-Time Intelligence, And Business Intelligence Capabilities. Power BI Provides The Reporting And Visualization Layer Within This Broader Ecosystem. Fabric Can Help Organizations Prepare And Manage Data For Analytical Use Across Different Workloads
89. What Does Do If Your Power BI Report Shows Incorrect Totals?
Ans:
First, Verify The Source Data And Compare The Report Results With Independent SQL Queries Or Trusted Calculations. Then Review Table Relationships, Filter Context, Aggregation Settings, And The DAX Measures Used In The Visuals. Check Whether Duplicate Records, Many-To-Many Relationships, Or Incorrect data granularity are affecting the results.
90. Why Should Microsoft Hire As A Power BI Data Analyst?
Ans:
A Strong Fresher Candidate Can Demonstrate Analytical Thinking, Attention To Detail, And A Genuine Interest In Converting Data Into Useful Business Insights. Knowledge Of Power BI, Power Query, DAX, SQL, data modeling, and visualization provides a solid foundation for the role. Academic projects and practical dashboards can demonstrate the ability to clean data, calculate metrics, and communicate findings.