
Last updated on 06th Aug 2025| 12002
- Introduction to Both Approaches
- What is Technical Analysis?
- What is Fundamental Analysis?
- Key Metrics in Fundamental Analysis
- Popular Chart Patterns in Technical Analysis
- Time Frame of Each Approach
- Tools Used (Ratios vs Charts)
- Use Cases and Examples
- Conclusion
Introduction to Both Approaches
When analyzing financial markets, investors primarily use two main approaches: technical vs fundamental analysis. Both aim to predict future price movements and assess investment potential but do so using entirely different methods. While fundamental analysis focuses on understanding a company’s intrinsic value based on financial and economic data, technical analysis evaluates price trends, patterns, and trading volume to make investment decisions. Understanding the difference between these methods is crucial for any investor or trader aiming to build a strong strategy.
Do You Want to Learn More About Database? Get Info From Our Database Online Training Today!
What is Technical Analysis?
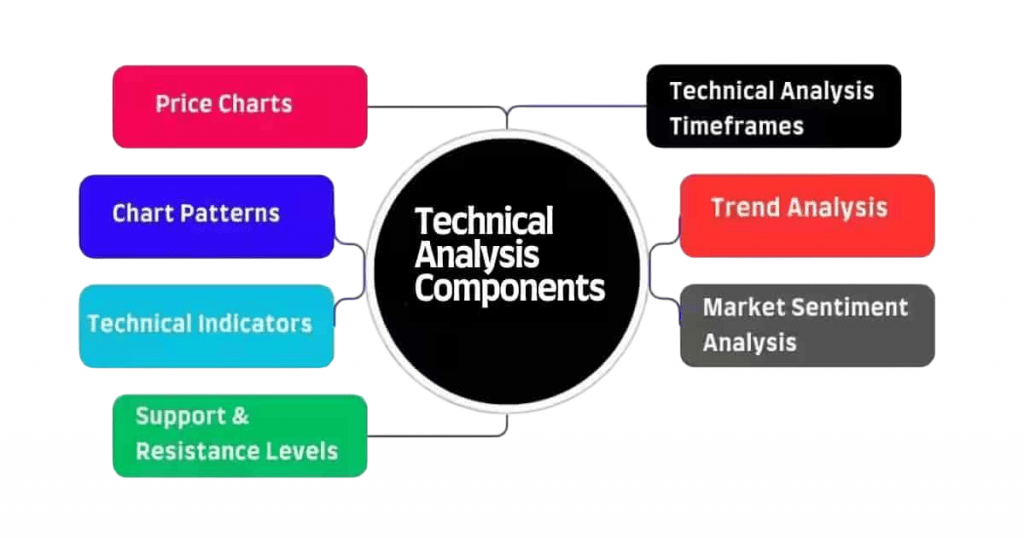
Technical analysis involves studying historical market data mainly price and volume to forecast future price movements. It is based on the belief that all known information is already reflected in the stock’s price, and that price movements follow recognizable patterns. Technical vs fundamental analysis is a method used to evaluate and forecast the future price movements of financial assets such as stocks, commodities, or currencies based on historical market data, primarily price and volume. Unlike fundamental analysis, which focuses on a company’s financial health and intrinsic value, technical analysis relies on charts, patterns, and technical indicators to identify trading opportunities. The core belief behind technical analysis is that all relevant information is already reflected in the price, and that price movements tend to follow trends over time.
Analysts use tools like moving averages, trendlines, RSI (Relative Strength Index), MACD (Moving Average Convergence Divergence), and candlestick patterns to spot entry and exit points. Common among traders and short-term investors, technical analysis helps in understanding market psychology, momentum, and timing, rather than the fundamental worth of an asset.Technical analysts use various tools to find entry and exit points for trading , such as moving averages, RSI (Relative Strength Index), MACD, Bollinger Bands, and candlestick patterns.
What is Fundamental Analysis?
Fundamental analysis focuses on a company’s financial health, economic conditions, industry trends, and management quality to determine the intrinsic value of a stock. If a stock’s market price is below its intrinsic value, it may be considered undervalued and a good investment.Fundamental analysis is a method used to evaluate the intrinsic value of a financial asset such as a stock, bond, or commodity by examining economic, financial, and qualitative factors. The goal is to determine whether an asset is undervalued or overvalued relative to its current market price. In the case of stocks, fundamental analysis involves studying a company’s financial statements, such as income statements, balance sheets, technical vs fundamental analysis and cash flow reports, along with key ratios like earnings per share (EPS), price-to-earnings (P/E) ratio, and return on equity (ROE). Analysts also consider macroeconomic indicators (like GDP growth, inflation, and interest rates) and industry conditions to assess the broader environment in which a company operates. Unlike technical analysis, which focuses on price trends and charts, Key Metrics in Fundamental Analysis, fundamental analysis is used by long-term investors to make informed decisions based on a company’s true financial health and growth potential.This approach is often used by value investors like Warren Buffett, who look for strong companies with solid fundamentals and sustainable competitive advantages.
Would You Like to Know More About Database? Sign Up For Our Database Online Training Now!
Key Metrics in Fundamental Analysis
Fundamental analysts rely on financial ratios and metrics to assess a company’s performance and compare it to industry peers.
- Earnings Per Share (EPS) – Net income divided by number of shares
- Price-to-Earnings Ratio (P/E) – Stock price relative to EPS.
- Price-to-Book Ratio (P/B) – Compares market value to book value.
- Debt-to-Equity Ratio – Measures financial leverage.
- Return on Equity (ROE) – Indicates how efficiently capital is used.
- Free Cash Flow – Cash left after capital expenditures, crucial for sustainability.
These metrics help analysts form a picture of the company’s profitability, solvency, growth potential, and valuation.

Popular Chart Patterns in Technical Analysis
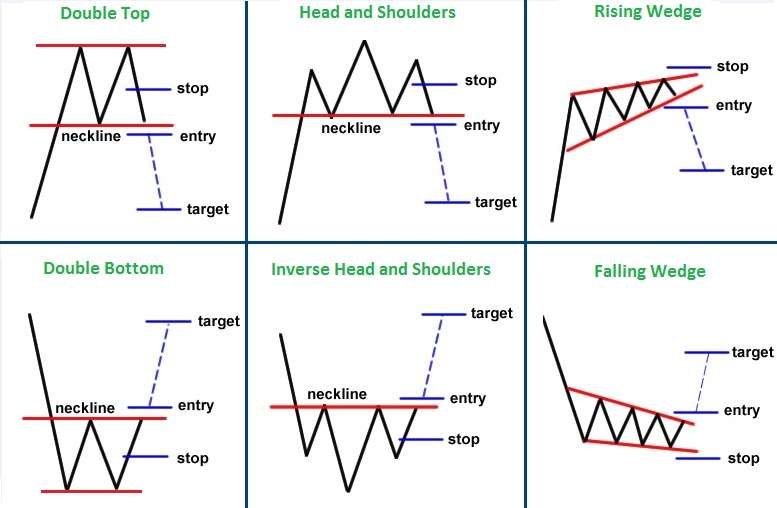
Chart Patterns in Technical Analysis are a central part of technical analysis. These patterns help traders anticipate market movements and develop strategies accordingly.
- Head and Shoulders – Indicates a potential trend reversal.
- Double Top/Double Bottom – Sign of a reversal in a bullish or bearish trend.
- Triangles (Ascending/Descending/Symmetrical) – Suggest continuation or breakout.
- Cup and Handle – Bullish continuation pattern.
- Flags and Pennants – Indicate short-term consolidations before a breakout.
Candlestick patterns like Doji, Hammer, Engulfing, and Shooting Star also play a significant role in signaling trend changes.
To Earn Your Database Certification, Gain Insights From Leading Blockchain Experts And Advance Your Career With ACTE’s Database Online Training Today!
Time Frame of Each Approach
The time frame is one of the key differences between technical analysis and fundamental analysis. Technical analysis is typically used for short-term to medium-term trading. Traders and analysts rely on real-time charts and technical indicators to make decisions that may span minutes, hours, or days, depending on the strategy such as day trading, swing trading, or momentum trading. The focus is on identifying entry and exit points based on price action, trends, and patterns,Key Metrics in Fundamental Analysis making it ideal for those looking to capitalize on short-term market movements.In contrast, fundamental analysis is generally applied with a long-term investment perspective. Investors using this approach analyze a company’s financial health, industry position, Chart Patterns in Technical Analysis and macroeconomic factors to determine its intrinsic value. This process involves deep research and is intended for decisions that may play out over months or years. Fundamental analysts aim to buy undervalued assets and hold them until the market recognizes their true worth, which makes this strategy more suitable for long-term portfolio building and value investing.
Tools Used (Ratios vs. Charts)
The tools used in both approaches differ significantly, reflecting their distinct perspectives on the market.
Fundamental Analysis Tools:
- Financial statements
- Valuation ratios (P/E, P/B, EV/EBITDA)
- Industry and economic reports
- Company filings and earnings calls
- Excel spreadsheets and valuation models
Technical Analysis Tools:
- Price charts (candlestick, bar, line)
- Technical indicators (MACD, RSI, Bollinger Bands)
- Charting software (TradingView, MetaTrader)
- Volume analysis tools
- Trendlines and support/resistance levels
While some investors integrate both tools into a hybrid approach, most prefer to specialize in one.
Preparing for a Database Job? Have a Look at Our Blog on Database Interview Questions and Answers To Ace Your Interview!
Use Cases and Examples
- An investor analyzing Apple Inc. might look at its EPS growth, product pipeline, balance sheet strength, trading and competitive advantages before deciding it’s undervalued at a certain price. They may hold the stock for years.
- A day trader may look at Tesla’s 5-minute candlestick chart, wait for a breakout above resistance, and enter a Traders with a tight stop-loss, Time Frame holding the position for just a few hours or less.
- A swing trader might choose fundamentally strong stocks and use technical analysis to time entry and exit points.
Use Case 1: Fundamental Investor
Use Case 2: Technical Trader
Use Case 3: Combining Both
Conclusion
Technical vs fundamental analysis offer different yet complementary approaches to understanding the markets. While technical analysis focuses on price action and market psychology for short-term trading ,Chart Patterns in Technical Analysis Time Frame fundamental analysis seeks to uncover long-term value based on company performance , Key Metrics in Fundamental Analysis and economic indicators.Choosing between them depends on your investment goals, risk tolerance, and time horizon. In practice,Traders many successful investors blend both techniques to make more informed and balanced decisions.