Last updated on 24th Oct 2025| 11581
- What is Comparative Analysis?
- Applications in Business Strategy
- Educational Use Cases
- Market Research Using Comparative Techniques
- Comparative Data in Analytics
- Steps to Perform Comparative Analysis
- Visualization Tools for Comparison
- Comparative Reports in Academia
- Pitfalls to Avoid
- Tools and Templates
- Conclusion
What is Comparative Analysis?
Comparative analysis is a method used to evaluate two or more entities by identifying similarities and differences. This technique helps in drawing conclusions, spotting trends, and making informed decisions based on the juxtaposition of data sets, business models, market trends, academic findings, or any other comparable elements. It is widely used across various fields, including business strategy, education, market research, and data analytics. To build expertise in these high-impact domains, explore Data Science Training a hands-on program that equips learners with statistical modeling, machine learning, and data visualization skills essential for solving real-world problems across industries. Comparative analysis can be quantitative (numerical) or qualitative (descriptive). It involves collecting relevant data, analyzing attributes, and forming insights to support decision-making. Whether it’s comparing sales performance, academic results, or customer satisfaction across departments, comparative analysis provides a structured approach to problem-solving.
Applications in Business Strategy
In the fast-changing world of business strategy, comparative analysis is a strong tool for growth and gaining a competitive edge. By looking closely at competitors’ strengths, weaknesses, pricing strategies, and market positions, companies can create better and more effective strategies. This method goes beyond just gathering competitive information; it includes important areas like measuring performance against industry standards, improving product development through detailed customer feedback, and assessing possible mergers and acquisitions. To uncover hidden patterns and reduce dimensional complexity in such strategic datasets, explore Understanding Principal Component Analysis a foundational guide to PCA techniques that help analysts extract meaningful insights, visualize trends, and optimize decision-making across competitive intelligence workflows. Organizations use comparative analysis to find performance gaps, focus on key strategic projects, and make decisions based on data that improve efficiency and competitiveness. With this approach, businesses can understand their internal abilities, the dynamics of the market outside, and opportunities for innovation and strategic change more clearly.
Interested in Obtaining Your Data Science Certificate? View The Data Science Online Training Offered By ACTE Right Now!
Educational Use Cases
Comparative analysis is widely applied in education: it helps institutions evaluate student performance, benchmark teaching outcomes, and identify areas for curriculum improvement. To support such data-driven insights with powerful visualization and reporting tools, explore Spotfire: Features, Analytics, Dashboards a comprehensive guide to leveraging interactive dashboards, predictive analytics, and real-time data exploration for smarter decision-making in academic and institutional settings.
- Curriculum Evaluation: Institutions compare curricula across programs or with other institutions to improve academic offerings.
- Student Performance: Teachers compare performance across student groups, subjects, or time periods to tailor interventions.
- Pedagogical Methods: Researchers analyze teaching methods to identify best practices in student engagement and outcomes.
- Policy Comparison: Education policymakers study different countries’ policies to inform reforms and practices.
- Cross-cultural Studies: Researchers use comparative analysis to understand differences in educational systems and their impact on student development.
- Evaluate Customer Preferences: Surveys and focus groups help compare consumer perceptions of different brands or products.
- Segment Markets: Companies compare demographic, psychographic, and behavioral data to define and target market segments.
- Brand Positioning: Comparative analysis helps visualize a brand’s position relative to competitors based on attributes like price, quality, and service.
- Campaign Effectiveness: Marketers compare the success of different campaigns or marketing channels to optimize strategy.
- Trend Analysis: Comparing data over time reveals market trends and customer behavior shifts.
- Bar Charts: Ideal for comparing quantities across categories.
- Line Graphs: Useful for time-based comparisons.
- Pie Charts: Show proportions within a dataset.
- Heat Maps: Visualize intensity or performance across dimensions.
- Radar Charts: Compare multiple attributes of entities simultaneously.
- Dashboards: Combine various visuals for an at-a-glance comparison.
- Thesis and Dissertations: Compare theories, methodologies, or case studies to support academic arguments.
- Research Papers: Analyze outcomes of different experiments or surveys to draw meaningful conclusions.
- Literature Reviews: Compare scholarly perspectives on a topic to identify gaps or consensus.
- Policy Studies: Evaluate the impact of different educational or social policies to inform future reforms.
- Cross-Disciplinary Studies: Compare concepts or frameworks across fields to foster interdisciplinary understanding.
- Spreadsheets (Excel, Google Sheets): Used for basic data comparison and visualization.
- BI Tools (Tableau, Power BI): Enable advanced dashboards and real-time analysis.
- Survey Tools (SurveyMonkey, Google Forms): Collect comparative qualitative and quantitative data.
- Statistical Software (SPSS, R, SAS): Support rigorous analysis and hypothesis testing.
- Templates: Include SWOT templates, benchmarking charts, comparison tables, and KPI dashboards.
To Explore Data Science in Depth, Check Out Our Comprehensive Data Science Online Training To Gain Insights From Our Experts!
Market Research Using Comparative Techniques
Comparative techniques in market research enable businesses to: benchmark competitors, identify gaps in offerings, refine pricing strategies, and tailor messaging to target audiences. To structure and visualize the underlying data that drives these insights, explore Erwin Data Modeler a powerful tool for designing, standardizing, and managing data architectures that support accurate analysis and informed decision-making.

Comparative Data in Analytics
In the field of analytics, comparative data acts as a strong driver for creating useful insights across various business areas. Performance dashboards use comparative metrics like year-over-year growth and regional performance to give a clear view of the organization. Using methods such as A/B testing, companies can evaluate product and webpage changes to improve performance and make better decisions. To master these data-driven techniques and apply them effectively across business scenarios, explore Data Science Training a practical program that covers experimentation frameworks, statistical analysis, and optimization strategies essential for impactful decision-making in digital environments. Financial analysis supports this by carefully comparing income statements, balance sheets, and cash flow metrics from different periods and competitive environments. Operational metrics are vital for process improvement, helping organizations measure productivity, resource use, and turnaround times. Additionally, customer analytics provide valuable insights by comparing customer lifetime value and satisfaction levels across different market segments, which helps shape personalized strategies and improve overall business intelligence.
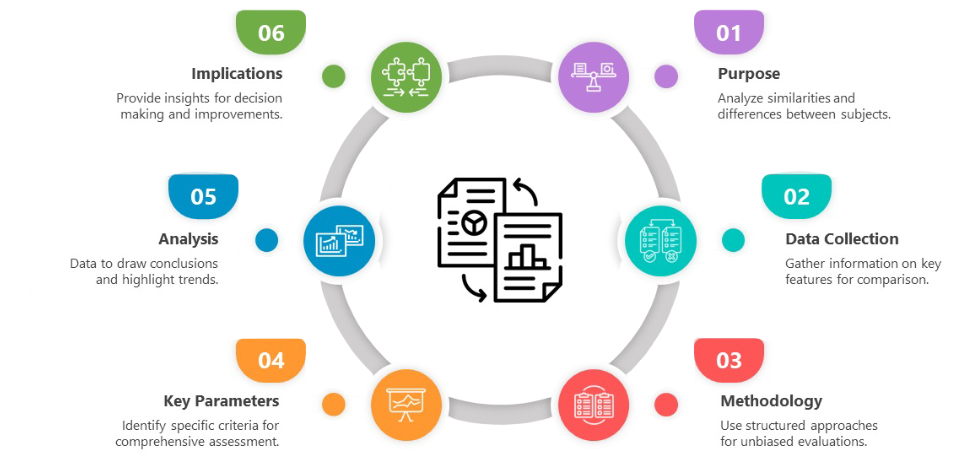
Steps to Perform Comparative Analysis
A thorough comparative analysis needs a clear approach. It starts by defining the objective and identifying the most relevant variables to examine. Researchers collect data from various sources like surveys, databases, and observational reports. They make sure all information is normalized for a fair comparison.
The analysis looks at differences and similarities using statistical or descriptive methods, which help find meaningful patterns and insights. By using strong analytical techniques, professionals can draw conclusions that show important trends and create useful information. The final stage is presenting these findings with clear visualizations and reports. This turns complex data into straightforward communication that helps support informed decision-making in organizations.
Gain Your Master’s Certification in Data Science Training by Enrolling in Our Data Science Master Program Training Course Now!
Visualization Tools for Comparison
Effective visualization tools enhance understanding of comparative data: they help uncover trends, highlight anomalies, and support evidence-based decisions across industries. To scale these insights with real-time processing and distributed analytics, explore Data Science and Cloud Computing a powerful combination that enables organizations to manage vast datasets, deploy scalable models, and drive intelligent outcomes through cloud-native infrastructure.
Comparative Reports in Academia
Academic comparative reports are structured analyses that serve educational purposes: they help institutions evaluate learning outcomes, compare curriculum effectiveness, and identify areas for pedagogical improvement. To enhance these evaluations with advanced statistical techniques and predictive modeling, Explore What Is SAS Analytics a comprehensive guide to leveraging SAS tools for data-driven insights, institutional benchmarking, and evidence-based academic planning.
These reports help advance academic knowledge and support evidence-based practices.
Are You Preparing for Data Science Jobs? Check Out ACTE’s Data Science Interview Questions and Answers to Boost Your Preparation!
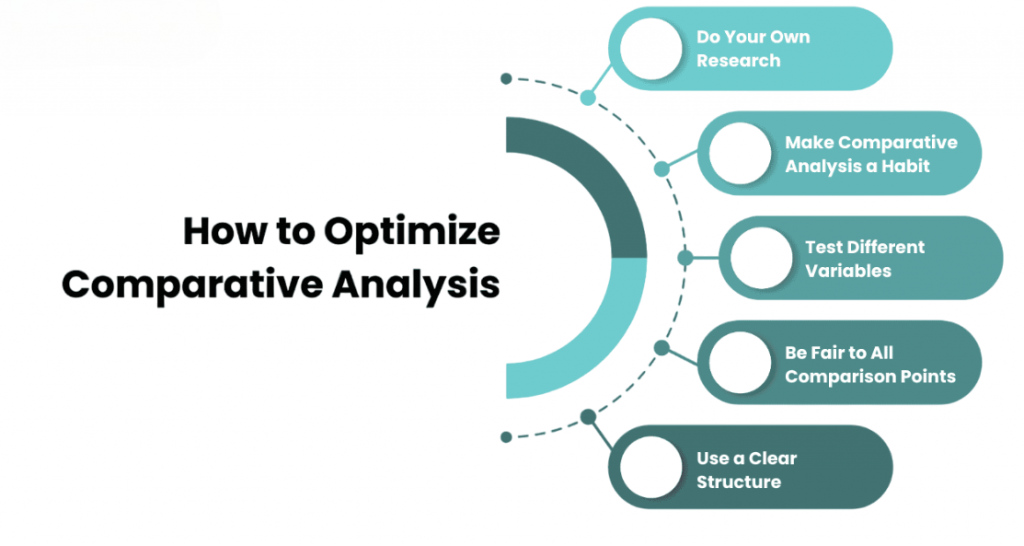
Pitfalls to Avoid
While comparative analysis is a useful tool, it has potential problems that can weaken its effectiveness and trustworthiness. Researchers and analysts need to be careful about data inconsistency, as this can lead to misleading conclusions when comparing different datasets. Additionally, bias in selection can greatly distort results, especially when the criteria for comparison are not chosen with strict fairness. The risks also include overgeneralization, where conclusions are quickly drawn from limited or unrepresentative samples, which can distort the overall understanding. It is also important to consider contextual factors that might significantly affect the data. Ignoring these factors can make comparisons superficial or inaccurate. To improve analytical precision and decision logic in such scenarios, explore The Role of Production Systems a foundational overview of rule-based engines that help structure reasoning, reduce bias, and enhance the reliability of AI-driven conclusions. Visual representations can also cause issues if not made carefully. Poorly designed graphics can unintentionally mislead interpretation. Moreover, insufficient normalization, like not adjusting data per capita or per unit, can affect the fairness and reliability of comparisons. Recognizing and addressing these issues is vital for keeping the integrity and value of comparative analysis intact.
Tools and Templates
Several tools and templates support efficient comparative analysis: they help researchers identify relationships, quantify differences, and validate hypotheses across datasets. To deepen your understanding of statistical modeling in this context, explore Overview of Regression a practical guide to regression techniques that reveal correlations, forecast trends, and support data-driven decision-making in academic and business environments.
Conclusion
Comparative analysis is a versatile method that supports strategic decisions across industries and disciplines. By carefully defining objectives, choosing the right variables, leveraging appropriate tools, and avoiding common pitfalls, professionals and academics can derive valuable insights that guide action and foster growth. To build the analytical mindset and technical expertise required for such data-driven impact, explore Data Science Training a comprehensive program that equips learners with statistical modeling, machine learning, and data interpretation skills essential for research, strategy, and innovation. Its relevance in the digital age continues to expand with the increasing availability of data and the evolution of analytic tools. Understanding and mastering comparative analysis is vital for anyone involved in decision-making, research, or planning. Whether you’re a business strategist, educator, researcher, or analyst, the ability to compare systematically is a powerful skill in a competitive and data-driven world.