
Last updated on 12th Jul 2020| 9741
In statistical process control (SPC) charting, we use the A2 and E2 constants to calculate control limits for an Average (X-bar chart) and Individuals charts. But where do the A2 and E2 constants come from? Let’s look at the following example, for an X-bar chart, that will explain how we derive the A2 constant.
The Generalize Control Limit Equation For Variable Charting
The expression used to compute the control limits for an X-bar chart is:
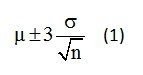
In this expression parameters μ, σ, and n represent the mean, standard deviation, and sample size. The expression, σ/√n is also called the standard error of the mean.
Control Chart Constants – X-Bar Chart
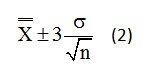
When using an X-bar Chart we collect several consecutive samples of size, n, to form a homogeneous subgroup and compute a subgroup average. Once we have enough subgroups, say 30 or more, we can estimate the population average. To do so, we compute the average of the subgroup averages. We call this estimate of the mean X-double bar. The modified expression appears below.
Next we need to estimate the standard error of the mean. Recall in a earlier post (Estimating Gage Repeatability Using Range Statistics), I showed you how to estimate the standard deviation using the average range from the following expression.
Estimating The Standard Deviation Using The Average Range
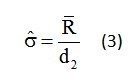
To estimate the standard deviation we compute the range for each subgroup. Recall the range is the difference between the smallest from the largest value. Once we have the range for each subgroup we then calculate the average range and divide by the d2 constant. To learn more about the d2 constant read the following post (Range Statistics and the d2 Constant).
Control Limit Equation For X-Bar Chart
We can now substitute equation (3) into equation (2) to get equation (4) as shown below.
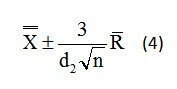
We now have the final equation to compute the control limits for the X-bar Chart based on the average range (R-bar). Take special notice of the expression 3/d2√n. This is the A2 constant.
The A2 constant is a function of the sample size n. Once we know the sample size, n, we can find the value for d2 and compute the value for A2.
Control Chart Constants For A2 At n=5, n=7
Let’s assume that we want to build control limits using a sample size of n=5. In this case the d2 constant is d2=2.326. Substituting these values into equation (5) we have:
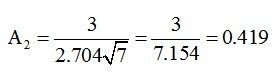
Let’s assume that we want to build control limits using a sample size of n=7. In this case the d2 constant is 2.704. Substituting these values into equation (5) we have:
Control Chart Constants Depend On d2
The X-Bar chart and Individuals chart both use A2 and E2 constants to compute their upper and lower control limits. In both cases we need the d2 constant. Without it we cannot estimate the control limits using equation (4). To learn more about the d2 constant and how you can derive the d2 constant read the following post Range Statistics and d2 Constant – How to Calculate Standard Deviation.
Control Chart Constants For A2 At n=2 Thru n=7
In Table 1, shown are the d2 and A2 constants for various samples sizes, n=2 through n=7. We can use these d2 and A2 values to calculate the control limits for the X-Bar Chart.
Control Chart Constants – Individuals Chart
Let’s apply this new-found knowledge to derive the E2 constants used to compute the control limits for an Individuals Chart. When using an Individuals Chart the subgroup sample size is n=1. In this case, we can change equation (4) and use the following expression shown in equation (6).

Gain Hands-on Experience in Hyperion Microsoft Excel Course
Weekday / Weekend BatchesSee Batch Details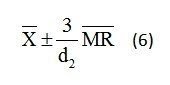
Since n=1, notice that the sample size, n, does not appear in equation (6). Take special notice of the expression 3/d2. This is the E2 constant.
Control Chart Constants – E2
Because d2 is a function of the Average Moving Range (MR-Bar), we often compute MR-Bar based on a Moving Range of MR=2. For example, the first moving range (MR1) is the absolute value of the difference between the 1st and 2nd values. Likewise, the second moving range (MR2) is the absolute value of the difference between the 2nd and 3rd values and so on.
We can also compute MR-Bar based on a Moving Range of MR=3. In this case, the first moving range (MR1) is the absolute value of the difference between the 1st and 3rd values. Likewise, the second moving range (MR2) is the absolute value of the difference between the 2nd and 4th values and so on.
Control Chart Constants – Individuals Chart
Let’s assume that we want to build control limits using a Moving Range=2. In this case the d2 constant is d2=1.1.128. Notice this is the same d2 constant used for a subgroup size of n=2. Substituting this value into equation (7) we have:
Let’s assume that we want to build control limits using a Moving Range span of 3 values. In this case, we use the d2 constant for a sample size of n=3 which is 1.693. Notice this d2 value is the same used for a subgroup size of n=3 for an Xbar chart. Substituting this value into equation (7) we have:
Control Chart Constants for E2 at MR=2 thru MR=5
In Table 2, shown are the d2 and E2 constants for various Moving Ranges, n=2 through n=7. We can use these d2 and E2 values to calculate the control limits for the Individuals Chart.
This post on Control Chart Constants is a subset of the broader topic of Statistical Process Control Charting.