Last updated on 04th Jul 2025| 9835
- Introduction
- Customer Behavior Analysis
- Sales Forecasting
- Supply Chain Optimization
- Marketing Campaign Effectiveness
- Fraud Detection
- Product Recommendation Systems
- Financial Performance Analysis
Introduction
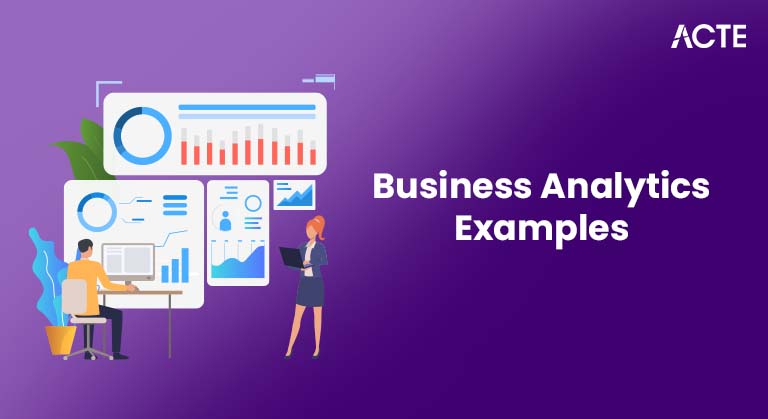
Business analytics plays a crucial role in transforming raw data into meaningful insights that support strategic decision-making across industries. Introduction to Business Analytics Examples involve exploring real-world scenarios where data-driven techniques improve performance and efficiency. For instance, companies use Tableau Business Intelligence tools to visualize trends and patterns, enabling clearer interpretations of data. A common application includes analyzing marketing campaign effectiveness, where professionals with Business Analyst Training track customer engagement, conversion rates, and ROI to refine promotional strategies. Through dashboards and interactive reports in Tableau, decision-makers can identify which campaigns yield the best results and allocate resources more effectively. Additionally, business analytics examples extend to areas such as supply chain optimization, financial forecasting, and customer segmentation, showcasing the versatility of analytics in diverse business functions. From identifying underperforming regions in sales to predicting customer churn, analytics empowers organizations to act proactively. With advanced tools like Tableau and a data-informed approach, businesses can uncover hidden opportunities, mitigate risks, and stay competitive. Ultimately, these examples highlight how integrating analytics into core operations drives smarter decisions, better outcomes, and continuous improvement in today’s data-centric world.
Are You Interested in Learning More About Web Developer Certification? Sign Up For Our Business Analyst Online Training Today!
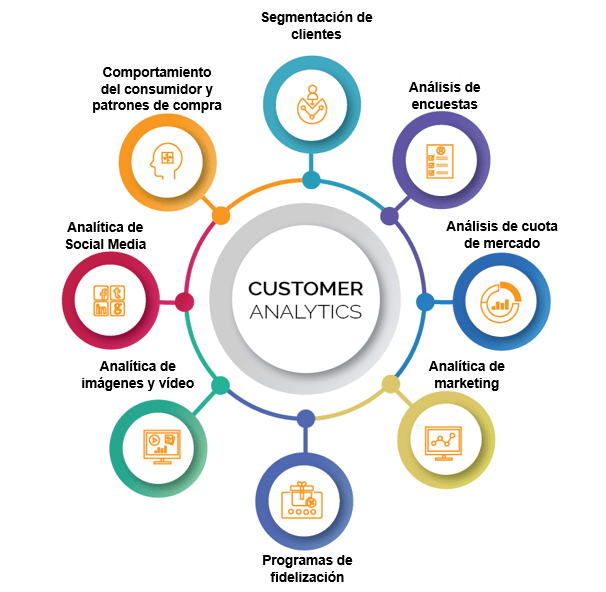
Customer Behavior Analysis
- Purchase Patterns: Identify what, when, and how often customers buy to optimize inventory and personalize offers.
- Customer Segmentation: Group customers based on behavior, demographics, or preferences using Top Business Analytics Tools to create targeted campaigns.
- Churn Prediction: Analyze past behavior to forecast which customers are likely to stop using a product or service.
Customer Behavior Analysis is the process of understanding how customers interact with a business, what influences their decisions, and how these insights can be used to improve marketing, sales, and overall customer experience. By leveraging tools like Tableau Business Intelligence, companies can visualize and interpret data to uncover patterns in customer actions. Here are six key areas where customer behavior analysis makes a significant impact, supported by real business analytics examples:
- Marketing Performance Tracking: Use Tableau Business Intelligence to evaluate how different campaigns influence customer actions and improve future strategies.
- Website Interaction Analysis: Monitor user navigation paths, bounce rates, and conversion metrics to enhance user experience and increase sales.
- Product Preferences and Feedback Trends: Track reviews and feedback over time to adjust offerings and improve satisfaction.
- Demand Forecasting: Analyze historical sales data to predict future demand accurately and prevent overstocking or stockouts.
- Inventory Management: Use analytics to balance inventory levels across warehouses, reducing holding costs while ensuring product availability an approach that highlights the growing Tableau Career Opportunities for professionals skilled in data visualization and supply chain insights.
- Supplier Performance Analysis: Evaluate suppliers on delivery time, cost, and quality to select the most reliable partners.
- Logistics and Transportation Optimization: Identify the most efficient routes and modes of transport to cut delivery times and costs.
- Production Planning: Align manufacturing schedules with demand forecasts to maximize productivity and minimize waste.
- Real-Time Monitoring: Implement Tableau dashboards for real-time tracking of supply chain activities, allowing quicker decisions and responses to disruptions.
- Real-Time Transaction Monitoring: Use BI tools to flag unusual patterns or anomalies in transactions that could indicate fraudulent activity.
- Behavioral Analytics: Track user behaviors and identify deviations from typical patterns, helping detect identity theft or account misuse.
- Supplier and Vendor Audits: Analyze procurement data for irregular pricing, duplicate invoices, or fake vendors, supporting both fraud detection and supply chain optimization demonstrating why Business Intelligence is the Best Career Option for those interested in data-driven decision-making and operational efficiency.
- Marketing Spend Analysis: Review marketing campaign budgets for discrepancies or inflated costs that may signal internal fraud.
- Financial Performance Trends: Detects inconsistencies in revenue or expense reports that could point to manipulation or fraud.
- Predictive Risk Scoring: Leverage machine learning models within BI tools to assign fraud risk scores to transactions or accounts.
These business analytics examples show how companies can transform raw data into actionable insights, leading to better engagement, retention, and profitability.

Sales Forecasting
Sales forecasting is a vital process that helps businesses predict future revenue based on historical data, market trends, and customer behavior. Accurate forecasting allows companies to make informed decisions about budgeting, resource allocation, and strategic planning. By leveraging tools like Tableau Business Intelligence, organizations can create dynamic dashboards that visualize sales trends, seasonal fluctuations, and regional performance in real time. This data-driven approach not only enhances forecast accuracy but also enables faster response to changing market conditions. A key component of effective sales forecasting is analyzing past marketing campaign effectiveness, which helps businesses understand which strategies drive conversions and generate the most revenue highlighting the importance of understanding Scope of Business Analytics in driving data-informed decisions. By evaluating customer responses to promotions and campaigns, companies can fine-tune future marketing efforts for better results. Numerous business analytics examples highlight how integrating sales data with marketing performance and external factors, such as economic indicators or competitor activity, leads to more precise forecasts. With Tableau, users can explore these variables interactively, allowing sales teams to anticipate demand, adjust targets, and identify growth opportunities. Ultimately, sales forecasting powered by business intelligence tools provides a competitive advantage, supporting smarter decision-making and driving sustainable business growth.
Are You Preparing for Business Analyst Jobs? Check Out ACTE’s Business Analyst Interview Questions & Answers to Boost Your Preparation!
Supply Chain Optimization
Supply Chain Optimization involves improving the efficiency and effectiveness of all processes involved in producing and delivering goods. With increasing complexity in global markets, businesses are turning to data-driven strategies to enhance supply chain performance. Leveraging analytics and tools like Tableau Business Intelligence enables companies to gain real-time visibility, reduce costs, and improve service levels. Here are six key focus areas in supply chain optimization:
Through smart use of data and visualization tools, businesses can turn complex supply chains into streamlined, high-performing systems.
Are You Considering Pursuing a Master’s Degree in Business Analyst? Enroll For Business Analyst Masters Program Training course Today!
Marketing Campaign Effectiveness
Marketing campaign effectiveness is a critical metric that helps businesses understand how well their marketing efforts are driving customer engagement, conversions, and overall return on investment. By leveraging the best BI tools, organizations can analyze vast amounts of campaign data to identify which strategies are performing and which need improvement. These tools offer in-depth insights into customer behavior, response rates, and conversion paths, enabling marketers to refine messaging, timing, and targeting for better results. Evaluating the success of a marketing campaign also impacts other areas of the business, such as supply chain optimization, where professionals with Business Analyst Training help align product availability with anticipated demand. Furthermore, data-driven campaign analysis can uncover anomalies in spending patterns, contributing to early fraud detection and preventing resource misuse. It also supports financial performance analysis by linking marketing spend directly to revenue outcomes, ensuring every dollar spent adds measurable value. By integrating data across departments and visualizing it through dashboards, the best BI tools enable real-time tracking and adjustment of campaign tactics. Ultimately, measuring and optimizing marketing campaign effectiveness ensures that businesses remain competitive, maximize ROI, and maintain strong alignment between marketing strategies and broader business goals.
Fraud Detection
Fraud Detection is a critical function for businesses aiming to protect their assets, reputation, and customer trust. With the rise of digital transactions and complex operations, detecting fraud early has become more challenging—and more essential. Organizations now rely on data analytics and the best BI tools to monitor and analyze suspicious activities in real time. These tools not only enhance fraud detection but also support broader business functions such as supply chain optimization and financial performance monitoring. Here are six key ways fraud detection can be effectively implemented:
Product Recommendation Systems
Product recommendation systems play a pivotal role in enhancing customer experience and boosting sales by suggesting relevant products based on user behavior, preferences, and past purchases. These systems leverage advanced analytics and machine learning, often integrated through the best BI tools, to deliver personalized recommendations in real time. By analyzing customer interactions and purchase histories, businesses can drive more effective marketing campaigns, increase conversion rates, and encourage repeat purchases.Additionally, recommendation systems contribute to supply chain optimization by forecasting demand for specific products, helping businesses manage inventory more efficiently. For better data visualization, you can Create a Donut Chart in Tableau to illustrate inventory distribution and demand trends. They also assist in improving financial performance by increasing average order value and customer lifetime value. Moreover, when combined with anomaly detection features, these systems can help flag unusual purchase patterns, supporting fraud detection efforts. Businesses that integrate product recommendation engines into their digital platforms not only enhance customer satisfaction but also streamline operations and decision-making across departments. By utilizing the best BI tools to monitor and refine recommendation strategies, companies can stay ahead of market trends, deliver highly targeted offers, and maximize return on investment. Overall, product recommendation systems are a powerful example of how data-driven insights can transform user engagement and drive strategic business growth.
Are You Interested in Learning More About Business Analyst? Sign Up For Our Business Analyst Online Training Today!
Financial Performance Analysis
Financial performance analysis is essential for assessing a company’s profitability, stability, and overall business health. It involves examining key metrics such as revenue, expenses, profit margins, and cash flow to understand how well an organization is meeting its financial goals. Leveraging the best BI tools, businesses can visualize financial data in real time, uncover trends, and make informed decisions to improve operations. These tools also help link financial outcomes to various business functions, offering insights into how activities like marketing campaigns impact revenue and customer acquisition costs. Additionally, professionals with Business Analyst Training contribute to financial analysis that supports supply chain optimization by identifying cost-saving opportunities and ensuring efficient resource allocation. Monitoring patterns in financial data also plays a crucial role in fraud detection, allowing businesses to spot anomalies or suspicious transactions early. By using dashboards and analytics, organizations can measure their financial performance more accurately, track key performance indicators (KPIs), and forecast future financial outcomes. This data-driven approach ensures that leadership teams can quickly adapt strategies, manage risks, and align financial planning with long-term goals. In today’s competitive environment, integrating financial analysis with the best BI tools is key to sustaining growth, improving transparency, and making smarter, more strategic business decisions.