Last updated on 08th May 2025| 8829
- Introduction to Big Data Analytics
- Understanding Tableau: A Powerful Data Visualization Tool
- Understanding Hadoop: The Backbone of Big Data Storage
- Why Combine Tableau and Hadoop for Big Data Analytics?
- Key Benefits of Using Tableau with Hadoop
- How to Set Up Tableau with Hadoop
- Real-World Use Cases of Tableau and Hadoop in Big Data Analytics
- Challenges in Integrating Tableau with Hadoop
- Conclusion
Introduction to Big Data Analytics
In today’s fast-paced digital world, the volume of data being generated is unprecedented. From social media interactions to transactional data from e-commerce platforms, the information is overwhelming in both size and complexity. This surge in data calls for advanced tools and techniques to analyze and derive insights that can inform strategic business decisions. Business Analyst Training is where Big Data Analytics comes into play. Big data analytics involves the use of advanced analytics techniques to extract meaningful insights from vast and complex datasets. It leverages various technologies and tools to process, analyze, and visualize data in ways that are actionable for businesses. Two technologies that stand out in the realm of Big Data Analytics are Tableau and Hadoop. While Tableau is widely regarded for its powerful data visualization capabilities, Hadoop serves as the platform for managing and processing massive datasets. Together, these two tools form a perfect pair for learning and mastering Big Data Analytics. In this post, we’ll explore how Tableau and Hadoop complement each other, the benefits of using both, and how they can be set up and used for real-world big data analytics.
Understanding Tableau: A Powerful Data Visualization Tool
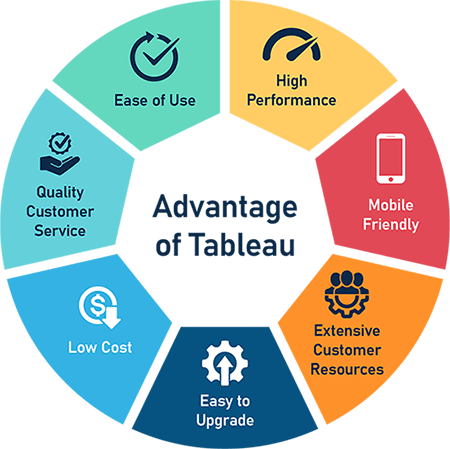
Tableau is a data visualization tool that enables businesses and individuals to convert raw data into interactive, insightful visualizations. It allows users to create a wide variety of charts, graphs, and dashboards that provide a clear view of their data, enabling them to make more informed decisions.
Some of Tableau’s key features include:
- Intuitive User Interface: Tableau is known for its user-friendly drag-and-drop interface that allows non-technical users to create visualizations quickly.
- Integration with Multiple Data Sources: Tableau can connect to a variety of data sources, including Excel, SQL databases, and cloud services. It supports live data connections and data extracts, making it flexible for different use cases.
- Advanced Analytics: Explore Data and Drive Growth with Qlikview BI Tool offers advanced analytical capabilities like trend lines, forecasting, clustering, and data blending.
- Interactive Dashboards: Tableau allows users to create highly interactive dashboards that help in exploring data from multiple angles and sharing insights effectively.
- Tableau: It is widely used across industries for data-driven decision-making, business intelligence, and performance tracking. When combined with big data platforms like Hadoop, Tableau’s capabilities are greatly amplified, enabling the analysis of large datasets with ease.
Enhance your knowledge in Business Analyst. Join this Business AnalystCertification Training now.
Understanding Hadoop: The Backbone of Big Data Storage
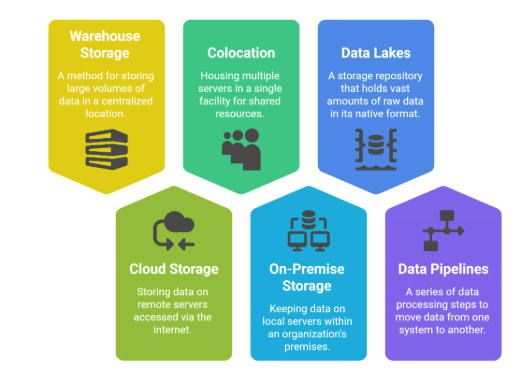
Hadoop is an open-source framework for storing and processing large datasets in a distributed computing environment. It is designed to handle big data, which traditional data management tools and systems cannot process effectively. Hadoop is capable of storing petabytes of data, providing a reliable and scalable platform for processing and analyzing large datasets. Its ability to work with unstructured data, process vast amounts of information, and scale with the growth of data makes it an ideal solution for big data projects. Hadoop’s core components include:
- HDFS (Hadoop Distributed File System): HDFS is the storage layer of Hadoop. https://www.acte.in/informatica-etl-developer breaks down large files into smaller blocks and distributes them across multiple nodes in a cluster. Business Intelligence Landscape allows data to be stored and accessed across various machines in parallel, providing scalability and fault tolerance.
- MapReduce: MapReduce is the processing framework that handles data computation. Informatica ETL Developer splits data processing tasks into smaller sub-tasks (map) and processes them in parallel across nodes. After processing, the results are aggregated (reduce) into a final output.
- YARN (Yet Another Resource Negotiator): YARN is the resource management layer of Hadoop, responsible for allocating resources to different tasks and managing their execution.
- Hadoop Ecosystem: Beyond the core components, Hadoop has a rich ecosystem of tools that help with data management, processing, and analysis. Tools like Hive, Pig, HBase, Spark, and Flume make Hadoop a versatile platform for handling big data.
- Scalability and Performance: Hadoop can handle massive datasets across distributed computing environments. When combined with Tableau, users can visualize and explore these datasets interactively without performance degradation.
- Real-Time Insights: Tableau’s integration with Hadoop allows users to analyze real-time or near-real-time data. As businesses increasingly rely on real-time insights for decision-making, this combination ensures that visualizations reflect up-to-date information.
- Data Flexibility: Hadoop’s ability to store data in different formats (structured, semi-structured, and unstructured) complements Tableau’s versatility in handling diverse data sources. This combination enables businesses to analyze data from a wide variety of formats, such as social media feeds, sensor data, and more.
- Cost Efficiency: Using Hadoop as a backend for data storage and processing is often more cost-effective than traditional databases, especially when dealing with Microstrategy Performance. Tableau, as a front-end visualization tool, can then provide insightful visualizations without needing to move data into expensive databases.
- Simplified Big Data Analytics: Learning and working with big data analytics can be daunting due to its complexity. However, Tableau simplifies the process by providing an intuitive interface for analyzing data, while Hadoop handles the heavy lifting of storing and processing the data. This synergy makes big data more accessible to business users and analysts.
- Seamless Data Integration: Tableau connects directly to Hadoop ecosystems (such as Hive and Impala), allowing users to access and visualize data stored in Hadoop clusters without complex coding or ETL processes.
- Improved Decision-Making: The ability to analyze large datasets through Tableau’s visualizations helps businesses uncover insights that are otherwise difficult to detect in Business Analyst Training. This leads to better, more informed decision-making.
- Speed and Efficiency: The combination of Hadoop’s distributed processing power and Tableau’s real-time analytics capabilities ensures fast processing and visual analysis, even with vast amounts of data.
- Data Exploration: Tableau’s interactive features allow users to explore big data more easily. By filtering, drilling down, and visualizing different aspects of the data, users can discover patterns, trends, and anomalies that are critical for making data-driven decisions.
- Collaboration and Sharing: Tableau makes it easy to share dashboards and reports with team members or stakeholders, facilitating collaboration and transparency in data-driven decision-making across the organization.
- Case Study 1: E-Commerce Retailer An e-commerce retailer integrated Tableau with Hadoop to analyze large volumes of customer data, including clickstreams, transactions, and social media interactions. By visualizing this data in Tableau, the retailer gained insights into customer behavior, purchasing trends, and product popularity, leading to improved marketing campaigns and inventory management.
- Case Study 2: Healthcare Provider A healthcare organization used Hadoop to store and process vast amounts of patient data, including medical records and sensor data. By visualizing this data in Tableau, the organization was able to identify health trends, predict patient outcomes, and optimize hospital resource allocation.
- Case Study 3: Financial Services Firm A global financial institution leveraged Hadoop to store years of historical trading data, customer transactions, and Alteryx Vs Tableau assessments. By integrating this data with Tableau, analysts could detect patterns in market behavior, monitor fraud in near real-time, and improve regulatory compliance through dynamic dashboards. This combination enabled faster decision-making and enhanced risk management strategies.
- Case Study 4: Telecommunications Company A telecom company used Hadoop to handle massive datasets from network traffic, customer support interactions, and device telemetry. With Tableau layered on top, the company created interactive dashboards to monitor network performance, predict service outages, and personalize customer service based on usage patterns. This resulted in reduced downtime and improved customer retention.
Advance your Business Analyst career by joining this Business Analyst Training now.
Why Combine Tableau and Hadoop for Big Data Analytics?
While Tableau excels in creating stunning visualizations and enabling fast decision-making, Hadoop is an excellent platform for handling massive amounts of data and performing distributed processing. Combining these two tools allows organizations to efficiently process, analyze, and visualize large datasets, offering several distinct advantages:

Key Benefits of Using Tableau with Hadoop
The integration of Tableau and Hadoop unlocks several key benefits for data analysts, businesses, and organizations looking to leverage big data for better decision-making:
How to Set Up Tableau with Hadoop
Integrating Tableau with Hadoop is relatively straightforward. Here’s a step-by-step guide to get started, Install and Set Up Hadoop Before integrating with Tableau, ensure that Hadoop is properly set up on your system or cloud environment. This includes configuring HDFS, YARN, and the necessary processing frameworks (like Hive or Impala). Install Tableau Download and install Tableau Desktop or Tableau Server. Tableau is compatible with Windows and macOS, and Root Cause Analysis easy to install with a step-by-step wizard. Connect Tableau to Hadoop Open Tableau and go to the “Connect” pane. Select the appropriate connector for Hadoop. For example, if you are using Hive, choose the “Hive” connector; if using Impala, choose the “Impala” connector. Enter the connection details, such as the Hadoop cluster’s IP address and authentication credentials. Create Data Visualizations Once Tableau is connected to Hadoop, you can begin exploring and visualizing data. Use Tableau’s drag-and-drop interface to create dashboards, charts, and reports from your big data.
Ready to excel in Business Analyst? Enroll in ACTE’s Business Intelligence Master Program Training Course and begin your journey today!
Real-World Use Cases of Tableau and Hadoop in Big Data Analytics
Are you getting ready for your Business Analyst interview? Check out our blog on Business Analyst Interview Questions and Answers!
Challenges in Integrating Tableau with Hadoop
While combining Tableau and Hadoop offers powerful capabilities for Big Data analytics, integration isn’t always seamless. One major challenge is data latency Hadoop is designed for batch processing and may not deliver real-time performance, which Tableau users often expect. Another issue is Qlikview vs Qlik Sense complexity Hadoop stores data in raw formats like JSON or Avro, which might require transformation before visualization. Additionally, security and governance can be complex due to the decentralized nature of Hadoop clusters. Overcoming these challenges often involves using intermediate layers like Hive, Impala, or Presto to bridge the performance and accessibility gap between Hadoop and Tableau..
Conclusion
The combination of Tableau and Hadoop offers a robust and scalable solution for big data analytics. By harnessing Hadoop’s ability to store and process large datasets and Tableau’s interactive visualization capabilities, businesses can unlock valuable insights from their data. Whether you are an analyst, a Business Analyst Training , or a business leader, the synergy between Tableau and Hadoop provides an ideal environment for making data-driven decisions. As organizations continue to deal with growing volumes of data, the integration of these powerful tools will play a pivotal role in driving better business outcomes, improving operational efficiency, and delivering a competitive edge in the marketplace.