 LMS
LMS
Last updated on 20th Aug 2026| 7635

Amazon Data Science Interviews Focus On Evaluating A Candidate’s Knowledge Of Data Science, Statistics, Machine Learning, SQL, Python, Data Analysis, And Problem-Solving Skills. The Selection Process May Include Online Assessments, Technical Interviews, Data Science Case Studies, Coding Questions, And Behavioral Interviews. Candidates Are Often Expected To Analyze Business Problems, Select Appropriate Models, Interpret Results, And Explain Their Approach Clearly. Strong Knowledge Of Probability, Hypothesis Testing, A/B Testing, Machine Learning Algorithms, SQL Queries, And Data Visualization Can Be Valuable During The Technical Rounds. Amazon Also Places Significant Importance On Its Leadership Principles, So Candidates Should Prepare Examples Demonstrating Ownership, Customer Obsession, Dive Deep, Deliver Results, And Data-Driven Decision Making. This Guide Covers Common Amazon Data Science Interview Questions, Coding Problems, Technical Topics, Selection Process, And Preparation Tips To Help Freshers And Experienced Candidates Prepare Effectively.
1. What Is Data Science?
Ans:
Data Science Is The Process Of Extracting Useful Insights From Structured And Unstructured Data. It Combines Statistics, Mathematics, Programming, Machine Learning, And Domain Knowledge To Solve Real-World Problems. Data Scientists Collect, Clean, Analyze, Visualize, And Model Data To identify Patterns And Support Business Decisions. Python, SQL, Pandas, NumPy, And Machine Learning Libraries Are Commonly Used In Data Science Projects. The Process Usually Includes Data Preparation, Exploratory Data Analysis, Feature Engineering, Modeling, And Evaluation. The Main Goal Of Data Science Is To Convert Raw Data Into Meaningful Insights And Data-Driven Decisions.
2. What Is The Difference Between Data Science And Data Analytics?
Ans:
- Data Science Focuses On Extracting Insights From Data And Building Predictive Or Prescriptive Models For Future Decisions. Data Analytics Primarily Focuses On Examining Existing Data To Understand Business Performance, Trends, And Patterns.
- Data Scientists Commonly Use Machine Learning, Statistics, Programming, And Advanced Modeling Techniques.
- Data Analysts Frequently Work With SQL, Excel, Visualization Tools, Dashboards, And Business Reports. Both Fields Require Data Cleaning, Statistical Knowledge, Data Interpretation, And Business Understanding.
3. What Is Machine Learning?.
Ans:
Machine Learning Is A Technique That Enables Computers To Learn Patterns And Relationships From Data Without Being Explicitly Programmed For Every Situation. Instead Of Defining Every Rule Manually, Machine Learning Algorithms Learn From Historical Examples And Use Those Patterns To Make Predictions. Machine Learning Can Be Used For Classification, Regression, Clustering, Recommendation Systems, And Forecasting. Supervised Learning And Unsupervised Learning Are Two Major Categories Of Machine Learning
4. What Is Supervised Learning?
Ans:
Supervised Learning Is A Machine Learning Approach That Uses Historical Data Containing Input Features And Known Target Values. The Algorithm Learns A Relationship Between The Input Variables And The Target Variable During The Training Process. Regression And Classification Are The Two Major Types Of Supervised Learning. For Example, A Model Can Predict Product Demand Using Historical Sales, Pricing, And Customer Data. Training Data Is Used To Learn Patterns, While Validation And Test Data Are Used To Measure How Well The Model Generalizes. Common Supervised Learning Algorithms Include Linear Regression, Logistic Regression, Decision Trees, Random Forests, And Gradient Boosting.
5. What Is Unsupervised Learning?
Ans:
Unsupervised Learning Is A Machine Learning Approach That Works With Data Where A Target Variable Or Predefined Label Is Not Available. The Algorithm Attempts To Discover Hidden Patterns, Groups, Relationships, Or Structures Within The Dataset. Clustering And Dimensionality Reduction Are Common Applications Of Unsupervised Learning. Customer Segmentation Is A Typical Example Where Customers Can Be Grouped According To Their Purchasing Or Behavioral Patterns.
6. What Is Regression?
Ans:
- Regression Is A Supervised Machine Learning Technique Used To Predict Continuous Numerical Values Based On One Or More Input Variables. It Estimates The Relationship Between Independent Variables And A Continuous Target Variable.
- For Example, Regression Can Be Used To Predict Sales, Revenue, Product Prices, Delivery Time, Or Customer Lifetime Value. Linear Regression Is One Of The Most Basic And Interpretable Regression Algorithms.
- Model Performance Can Be Evaluated Using Metrics Such As MAE, MSE, RMSE, And R-Squared. Feature Quality, Data Cleaning, Feature Selection, And Proper Model Validation Can Strongly Affect Regression Performance.
7. What Is Classification?
Ans:
Classification Is A Supervised Machine Learning Technique Used To Predict Discrete Categories Or Classes. Common Applications Include Fraud Detection, Customer Churn Prediction, Spam Detection, Sentiment Analysis, And Product Categorization. The Target Variable Can Contain Two Classes In Binary Classification Or Multiple Classes In Multiclass Classification. Algorithms Such As Logistic Regression, Decision Trees, Random Forests, Gradient Boosting, And Neural Networks Can Be Used For Classification. Metrics Such As Accuracy, Precision, Recall, F1-Score, And AUC Can Be Used To Evaluate The Model
8. What Is Overfitting?
Ans:
Overfitting Happens When A Machine Learning Model Learns The Training Data Too Closely, Including Noise And Random Patterns. Such A Model May Produce Excellent Performance On Training Data But Poor Performance On New Or Unseen Data. Overly Complex Models, Limited Training Data, Excessive Features, And Insufficient Regularization Can Increase The Risk Of Overfitting. Cross-Validation Can Help Detect Whether A Model Generalizes Well Beyond Its Training Dataset. Techniques Such As Regularization, Feature Selection, Early Stopping, Pruning, And Increasing Training Data Can Help Reduce Overfitting.
9. What Is Underfitting?
Ans:
Underfitting Occurs When A Machine Learning Model Is Too Simple To Capture Important Patterns In The Training Data. It Usually Produces Poor Performance On Both Training Data And Testing Data. Insufficient Features, Excessive Regularization, Poor Feature Engineering, Or An Oversimplified Algorithm Can Cause Underfitting. Increasing Model Complexity Can Sometimes Help The Model Capture More Meaningful Relationships.
10. What Is Cross-Validation?
Ans:
Cross-Validation Is A Model Evaluation Technique Used To Estimate How Well A Machine Learning Model Will Perform On Unseen Data. In K-Fold Cross-Validation, The Dataset Is Divided Into K Different Folds Of Approximately Equal Size. The Model Is Trained On K-1 Folds And Validated On The Remaining Fold. This Process Is Repeated Until Every Fold Has Been Used As The Validation Set. The Average Performance Across All Folds Provides A More Reliable Estimate Of Model Performance. Cross-Validation Is Especially Useful When The Available Dataset Is Limited Because It Allows More Effective Use Of The Available Training Data.
11. What Is Feature Engineering?
Ans:
Feature Engineering Is The Process Of Creating, Transforming, Or Selecting Useful Input Variables From Raw Data. It Can Include Numerical Transformations, Aggregations, Encoding, Scaling, Date-Based Features, And Domain-Specific Calculations. For Example, A Timestamp Can Be Converted Into Day, Month, Hour, Weekend, Or Holiday Features. Good Features Can Improve Model Accuracy, Reduce Complexity, And Help Algorithms Identify Important Patterns. Effective Feature Engineering Requires Both Technical Knowledge And A Strong Understanding Of The Business Problem.
12. What Is Feature Selection?
Ans:
Feature Selection Is The Process Of Identifying And Choosing The Most Relevant Variables For A Machine Learning Model. Removing Irrelevant Or Redundant Features Can Reduce Noise, Improve Interpretability, Reduce Training Time, And Lower The Risk Of Overfitting. Common Feature Selection Methods Include Correlation Analysis, Statistical Tests, Recursive Feature Elimination, Tree-Based Importance, And L1 Regularization. Feature Selection Should Be Performed Carefully So That Information From The Validation Or Test Dataset Does Not Leak Into The Training Process. The Selected Features Should Have Predictive Value And Be Available At The Time When Predictions Are Actually Required
13. What Is Data Cleaning?
Ans:
- Data Cleaning Is The Process Of Identifying, Correcting, Removing, Or Handling Problems In A Dataset Before Performing Analysis Or Machine Learning.
- It Can Include Handling Missing Values, Removing Duplicates, Correcting Incorrect Data Types, Managing Invalid Records, And Standardizing Inconsistent Categories. Outliers And Unexpected Values Should Also Be Investigated During The Cleaning Process.
- Clean And Consistent Data Improves The Reliability Of Statistical Analysis And Machine Learning Models.
14. How Does Handle Missing Values?
Ans:
Missing Values Can Be Handled Through Deletion, Statistical Imputation, Model-Based Imputation, Or Specialized Missing-Value Techniques. Numerical Values Can Sometimes Be Replaced Using Mean, Median, Or Other Appropriate Statistical Values. Categorical Values Can Be Replaced Using The Mode Or A Separate Category Such As Unknown. Deleting Rows May Be Appropriate When Only A Small Number Of Records Contain Missing Values And Their Removal Does Not Introduce Bias. The Best Strategy Depends On The Amount, Distribution, And Reason For The Missing Data. Missingness Should Always Be Investigated Before Choosing An Imputation Method Because The Pattern Of Missing Values Can Provide Important Information About The Dataset.
15. What Is Data Leakage?
Ans:
Data Leakage Occurs When Information That Would Not Be Available At Prediction Time Accidentally Enters The Machine Learning Training Process. Leakage Can Make A Model Appear Much More Accurate During Development Than It Will Be In Real-World Usage. For Example, Using Future Customer Information To Predict Whether The Customer Will Churn Can Create Leakage. Leakage Can Occur During Feature Engineering, Data Splitting, Imputation, Scaling, Or Aggregation. Proper Separation Of Training And Testing Data Helps Prevent Many Types Of Leakage. Avoiding Data Leakage Is Essential For Building Reliable Models That Can Generalize Correctly To New Production Data.
16. What Is Normalization?
Ans:
Normalization Is A Feature Scaling Technique That Rescales Numerical Values Into A Specific Range, Often Between Zero And One. Min-Max Scaling Is One Of The Most Common Normalization Methods. It Can Be Useful For Algorithms That Are Sensitive To Differences In Feature Magnitudes. Distance-Based Algorithms Such As K-Nearest Neighbors And Some Clustering Methods Can Benefit From Proper Scaling. Normalization Usually Has Less Impact On Tree-Based Algorithms Because Tree Splits Are Generally Not Sensitive To Feature Scale. The Scaling Parameters Should Be Calculated From Training Data And Then Applied To Validation, Test, And Production Data To Avoid Data Leakage.
17. What Is Standardization?
Ans:
Standardization Is A Feature Scaling Technique That Transforms A Numerical Feature To Have Approximately Zero Mean And Unit Variance. The Common Formula Subtracts The Feature Mean And Divides The Result By Its Standard Deviation. Standardization Is Frequently Used With Algorithms Such As Logistic Regression, Support Vector Machines, K-Nearest Neighbors, And Other Distance-Based Methods. It Helps Features With Different Units And Ranges Become More Comparable During Model Training. The Mean And Standard Deviation Used For Scaling Should Be Learned Only From The Training Dataset. This Prevents Information From Validation Or Test Data From Entering The Training Process.
18. What Is One-Hot Encoding?
Ans:
One-Hot Encoding Is A Technique Used To Convert Categorical Variables Into Separate Binary Columns. For Example, A Color Feature Containing Red, Blue, And Green Can Be Converted Into Three Indicator Columns. Each Record Receives A Value Of One For Its Corresponding Category And Zero For The Other Categories. This Prevents Many Algorithms From Incorrectly Assuming That Categories Have A Numerical Ranking. One-Hot Encoding Works Well For Low-Cardinality Categorical Variables. However, High-Cardinality Variables Can Create A Very Large Number Of Columns, So Alternative Encoding Techniques May Be More Suitable In Such Cases.
19. What Is Label Encoding?
Ans:
- Label Encoding Converts Categorical Values Into Numerical Integer Values. For Example, Categories Such As Low, Medium, And High Can Be Represented As 0, 1, And 2 When A Meaningful Order Exists.
- It Is Simple And Useful For Ordinal Variables Where The Categories Naturally Have A Ranking. For Nominal Variables Without Any Natural Order, Label Encoding Can Accidentally Suggest A Relationship That Does Not Exist.
- Some Tree-Based Algorithms Can Work Effectively With Numerical Category representations, Depending On The Implementation.
20. What Is PCA?
Ans:
Principal Component Analysis, Commonly Known As PCA, Is A Dimensionality Reduction Technique Used To Reduce The Number Of Features In A Dataset. It Transforms The Original Features Into A Smaller Set Of Uncorrelated Principal Components. These Components Are Ordered According To The Amount Of Variance They Explain From The Original Data. PCA Can Reduce Computational Complexity, Remove Redundancy, And Help Visualize High-Dimensional Datasets. Numerical Features Usually Need To Be Properly Scaled Before Applying PCA Because Variables With Larger Scales Can Otherwise Dominate The Components. A Major Limitation Is That Principal Components Can Be Difficult To Interpret Because Each Component May Combine Information From Many Original Features.
21. What Is Linear Regression?
Ans:
Linear Regression Is A Supervised Machine Learning Algorithm Used To Model The Relationship Between A Continuous Target Variable And One Or More Predictor Variables. It Assumes That The Target Can Be Approximated Using A Linear Combination Of The Input Features. The Model Parameters Are Commonly Estimated Using The Least Squares Method. Important Assumptions Include Linearity, Independence Of Errors, Constant Error Variance, And Appropriate Treatment Of Multicollinearity.
22. What Is Logistic Regression?
Ans:
Logistic Regression Is A Supervised Machine Learning Algorithm Commonly Used For Binary Classification Problems. It Estimates The Probability That An Observation Belongs To A Particular Class Using The Logistic Or Sigmoid Function. The Predicted Probability Can Then Be Converted Into A Class Using A Selected Decision Threshold. Logistic Regression Is Relatively Easy To Interpret Because Its Coefficients Represent The Effect Of Features On The Log-Odds Of The Outcome.
23. What Is A Decision Tree?
Ans:
A Decision Tree Is A Supervised Machine Learning Algorithm That Makes Predictions By Repeatedly Splitting Data According To Feature-Based Conditions. Each Internal Node Represents A Decision Or Split, While Each Branch Represents An Outcome Of That Decision. The Final Leaf Node Contains The Prediction Or Class Assigned To An Observation. Decision Trees Can Model Nonlinear Relationships And Are Relatively Easy To Understand And Visualize.
24. What Is Random Forest?
Ans:
Random Forest Is An Ensemble Machine Learning Algorithm That Combines Predictions From Multiple Decision Trees. Each Tree Is Usually Trained Using A Random Sample Of The Training Data And A Random Subset Of Features. The Predictions From Individual Trees Are Combined To Produce The Final Classification Or Regression Result. Random Forest Often Provides Strong Performance Without Requiring Extensive Feature Engineering. It Is Generally More Resistant To Overfitting Than A Single Deep Decision Tre
25. What Is Gradient Boosting?
Ans:
Gradient Boosting Is An Ensemble Learning Technique That Builds A Sequence Of Models, Usually Decision Trees, Where Each New Model Attempts To Correct The Errors Made By Previous Models. The Algorithm Optimizes A Loss Function By Adding New Weak Learners In A Sequential Manner. Popular Gradient Boosting Implementations Include XGBoost, LightGBM, And CatBoost. These Algorithms Can Provide Excellent Performance On Structured And Tabular Datasets. Important Hyperparameters Include Learning Rate, Tree Depth, Number Of Estimators, And Regularization Settings.
26. What Is XGBoost?
Ans:
XGBoost Is An Optimized Gradient Boosting Algorithm That Primarily Uses Decision Trees To Build Powerful Predictive Models. It Improves Traditional Gradient Boosting Through Efficient Training, Regularization, And Advanced Optimization Techniques. XGBoost Can Handle Missing Values And Provides Several Hyperparameters For Controlling Model Complexity And Performance. Important Parameters Include Learning Rate, Maximum Depth, Number Of Estimators, Subsample, And Column Sampling
27. What Is K-Means Clustering?
Ans:
K-Means Is An Unsupervised Machine Learning Algorithm Used To Divide Data Points Into A Predefined Number Of K Clusters. The Algorithm Assigns Each Observation To The Nearest Cluster Centroid Based On A Distance Measure. After Assignment, The Centroids Are Recalculated And The Process Continues Until The Cluster Assignments Stabilize Or A Stopping Condition Is Reached. The Number Of Clusters Usually Needs To Be Selected Before Running The Algorithm. The Elbow Method And Silhouette Score Can Help Identify An Appropriate Number Of Clusters
28. What Is The Silhouette Score?
Ans:
- The Silhouette Score Is A Metric Used To Evaluate The Quality Of Clusters Produced By A Clustering Algorithm. It Measures How Similar A Data Point Is To Other Points In Its Own Cluster Compared With Points In The Nearest Other Cluster.
- The Score Generally Ranges From -1 To 1, Where Higher Values Usually Indicate Better-Separated And More Cohesive Clusters.
- A Score Near Zero Can Indicate Overlapping Clusters, While Negative Values May Suggest Incorrect Cluster Assignments.
29. What Is Precision?
Ans:
Precision Measures The Proportion Of Predicted Positive Cases That Are Actually Positive. It Is Calculated As True Positives Divided By The Sum Of True Positives And False Positives. A High Precision Score Means That The Model Produces Relatively Few False Positive Predictions. Precision Is Particularly Important When False Positive Decisions Are Expensive Or Create Significant Operational Costs. For Example, A Business May Prefer High Precision When Incorrect Fraud Alerts Require Manual Investigation.
30. What Is Recall?
Ans:
Recall Measures The Proportion Of Actual Positive Cases That Are Correctly Identified By A Classification Model. It Is Calculated As True Positives Divided By The Sum Of True Positives And False Negatives. A High Recall Score Means That The Model Misses Fewer Actual Positive Cases. Recall Is Particularly Important When False Negatives Have Significant Consequences, Such As Missing Fraudulent Transactions Or Important Risk Events. Fraud Detection, Medical Screening, And Security Applications May Require Strong Recall Depending On Their Objectives..
31. What Is F1-Score?
Ans:
F1-Score Is A Classification Metric That Represents The Harmonic Mean Of Precision And Recall. It Provides A Single Measure That Balances The Model’s Ability To Avoid False Positives And False Negatives. F1-Score Is Particularly Useful When The Dataset Contains Imbalanced Classes And Accuracy Alone May Be Misleading. A High F1-Score Generally Requires Both Precision And Recall To Be Strong. It Can Be Useful For Comparing Classification Models When Both Types Of Errors Are Important
32. What Is A Confusion Matrix?
Ans:
A Confusion Matrix Is A Table Used To Summarize The Predictions Made By A Classification Model Against The Actual Class Labels. For Binary Classification, It Contains Four Main Values: True Positives, True Negatives, False Positives, And False Negatives. These Values Can Be Used To Calculate Metrics Such As Accuracy, Precision, Recall, Specificity, And F1-Score. A Confusion Matrix Helps Identify The Types Of Errors Produced By A Model Instead Of Looking Only At Overall Accuracy
33. What Is Class Imbalance?
Ans:
Class Imbalance Occurs When One Target Class Contains Significantly More Observations Than Another Class. For Example, In Fraud Detection, Legitimate Transactions May Represent The Vast Majority Of Records While Fraudulent Transactions Form Only A Small Percentage. In Such Situations, Accuracy Can Be Misleading Because A Model Could Predict The Majority Class Most Of The Time And Still Achieve High Accuracy. Techniques Such As Oversampling, Undersampling, Class Weights, And Synthetic Sampling Can Help Address Class Imbalance.
34. What Is AUC-ROC?
Ans:
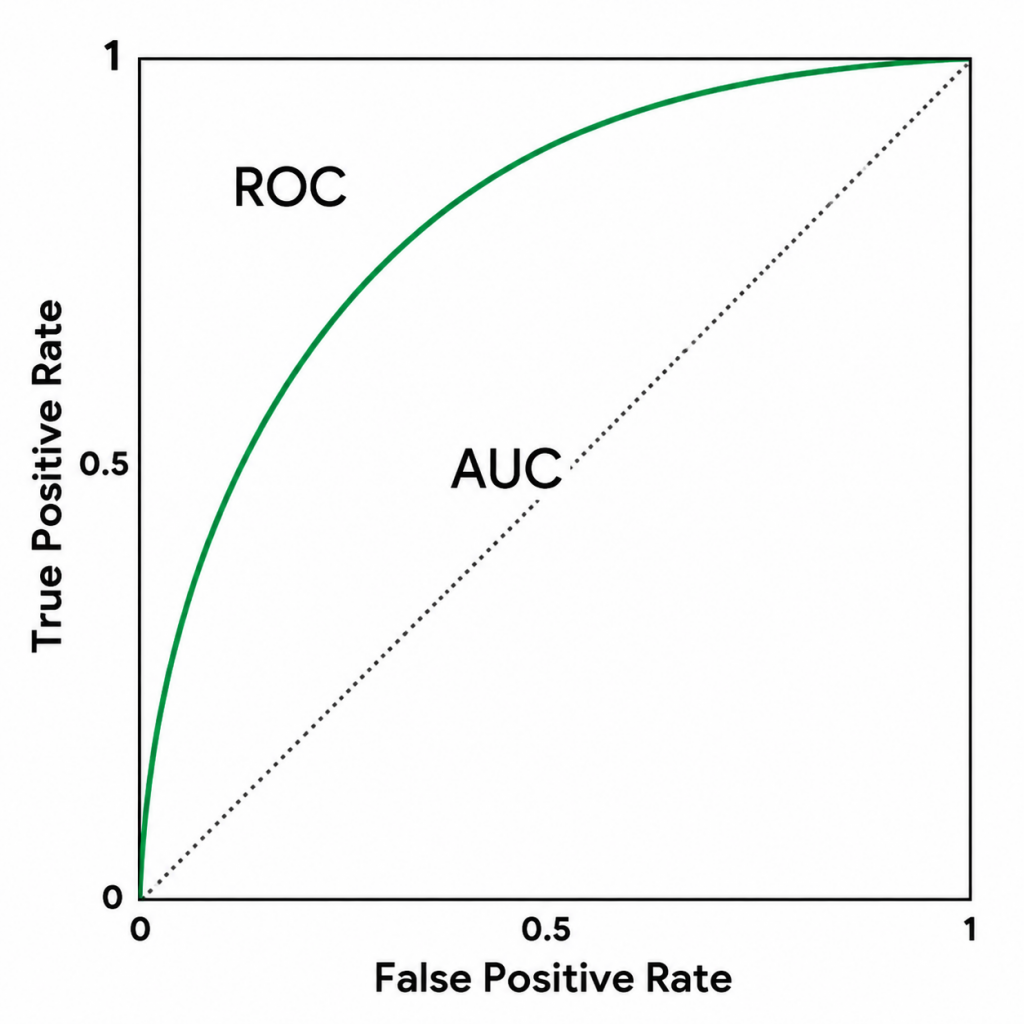
AUC-ROC Is A Performance Metric Used To Evaluate How Well A Classification Model Separates Positive And Negative Classes Across Different Decision Thresholds. The ROC Curve Plots The True Positive Rate Against The False Positive Rate At Various Threshold Values. AUC Represents The Area Under The ROC Curve And Provides A Summary Of The Model’s Ranking Ability. A Higher AUC Generally Indicates That The Model Can Better Distinguish Between Positive And Negative Observations.
35. What Is Mean Absolute Error?
Ans:
Mean Absolute Error, Or MAE, Is A Regression Evaluation Metric That Measures The Average Absolute Difference Between Predicted Values And Actual Values. It Is Calculated By Taking The Absolute Value Of Each Prediction Error And Then Computing Their Average. MAE Is Easy To Interpret Because The Result Is Expressed In The Same Units As The Target Variable. Unlike Squared Error Metrics, MAE Treats Errors More Linearly And Does Not Give Excessive Weight To Very Large Errors.
36. What Is RMSE?
Ans:
- Root Mean Squared Error, Or RMSE, Is A Regression Metric That Measures The Magnitude Of Prediction Errors By Giving Greater Weight To Larger Errors.
- It Is Calculated By Taking The Square Root Of The Mean Squared Error. Because Of The Square Root, RMSE Is Expressed In The Same Units As The Target Variable, Making It Easier To Interpret.
- Large Prediction Errors Have A Greater Impact On RMSE Because The Errors Are Squared Before Averaging..
37. What Is R-Squared?
Ans:
R-Squared Is A Regression Metric That Measures The Proportion Of Variation In The Target Variable Explained By The Model. A Higher R-Squared Generally Indicates That The Model Explains More Of The Observed Variation In The Target. In Many Standard Regression Settings, The Value Can Range From Zero To One, Although Negative Values Can Occur For Poorly Performing Models On Certain Evaluation Sets..
38. What Is Hypothesis Testing?
Ans:
Hypothesis Testing Is A Statistical Method Used To Determine Whether There Is Sufficient Evidence To Support A Claim About A Population Based On Sample Data. The Process Usually Begins With A Null Hypothesis And An Alternative Hypothesis. Sample Data Is Then Analyzed Using An Appropriate Statistical Test And Test Statistic. A P-Value Can Be Used To Determine Whether The Observed Result Provides Sufficient Evidence Against The Null Hypothesis At A Selected Significance Level.
39. What Is A P-Value?
Ans:
A P-Value Represents The Probability Of Observing Results At Least As Extreme As The Observed Result Assuming That The Null Hypothesis Is True. A Small P-Value Can Provide Evidence Against The Null Hypothesis When Evaluated Using A Predefined Significance Level. However, A P-Value Does Not Represent The Probability That The Null Hypothesis Itself Is True. A Common Significance Level Is 0.05, Although The Appropriate Threshold Can Depend On The Problem And Context.
40. What Is A Confidence Interval?
Ans:
A Confidence Interval Is A Statistical Range Used To Express Uncertainty Around An Estimated Population Parameter. It Provides A Range Of Plausible Values Based On Sample Data And The Assumptions Of The Statistical Method. For Example, A 95% Confidence Interval Can Be Used To Communicate Uncertainty Around An Estimated Mean, Proportion, Or Model Parameter. A Narrow Confidence Interval Generally Indicates Greater Estimation Precision Than A Wide Interval Under Comparable Condition

41. What Is A/B Testing?
Ans:
- A/B Testing Is An Experimental Method Used To Compare Two Versions Of A Product, Feature, Page, Recommendation, Or Process.
- Users Are Usually Randomly Assigned To A Control Group And A Treatment Group So That Their Outcomes Can Be Compared Fairly. A Specific Business Metric, Such As Conversion Rate, Revenue Per User, Engagement, Or Click-Through Rate, Is Then Measured For Both Groups.
- Randomization Helps Reduce The Influence Of Confounding Factors And Makes Causal Interpretation More Reliable. Statistical Testing Can Determine Whether The Observed Difference Is Likely To Be Meaningful Rather Than Due To Random Variation.
42. What Is Statistical Significance?
Ans:
Statistical Significance Indicates Whether An Observed Result Provides Sufficient Evidence Against A Defined Null Hypothesis Under A Statistical Testing Framework. It Is Commonly Evaluated Using A P-Value And A Predefined Significance Level. A Statistically Significant Result Does Not Automatically Mean That The Difference Is Large Or Valuable To The Business. Very Large Datasets Can Make Extremely Small Differences Statistically Significant. Therefore, Effect Size, Confidence Intervals, Practical Impact, And Business Metrics Should Also Be Considered. Good Data Analysis Distinguishes Between Statistical Evidence And The Actual Business Importance Of The Observed Result.
43. What Is Correlation?
Ans:
Correlation Measures The Degree To Which Two Variables Move Together In A Statistical Relationship. A Positive Correlation Means That The Variables Tend To Increase Or Decrease Together, While A Negative Correlation Means That One Variable Tends To Increase When The Other Decreases. Correlation Coefficients Commonly Range From -1 To 1, With Values Closer To Either Extreme Indicating Stronger Linear Relationships. A Correlation Near Zero Generally Indicates Little Linear Relationship Between The Variables..
44. What Is The Difference Between Correlation And Causation?
Ans:
| Aspect | Correlation | Causation |
|---|---|---|
| Meaning | Shows That Two Variables Are Associated. | Shows That One Variable Directly Affects Another. |
| Relationship | Variables May Change Together Without One Causing The Other. | A Change In One Variable Produces A Change In Another. |
| Example | Ice Cream Sales And Temperature May Be Positively Correlated. | Increasing Advertising Spending May Cause More Product Sales When Other Factors Are Controlled. |
| Proof | Correlation Alone Does Not Prove A Cause-And-Effect Relationship. | Causation Usually Requires Strong Evidence Such As Controlled Experiments Or Causal Analysis. |
45. What Is Multicollinearity?
Ans:
Multicollinearity Occurs When Two Or More Predictor Variables In A Regression Model Are Highly Related To Each Other. Strong Multicollinearity Can Make Regression Coefficients Unstable And Make It Difficult To Interpret The Individual Effect Of Each Predictor. Variance Inflation Factor, Commonly Called VIF, Is One Technique Used To Detect Multicollinearity. Redundant Features Can Sometimes Be Removed Or Combined To Reduce The Problem. Regularization Methods Such As Ridge Regression Can Also Help Stabilize Models In The Presence Of Correlated Predictors
46. What Is Regularization?
Ans:
Regularization Is A Technique Used To Control Model Complexity And Reduce The Risk Of Overfitting. It Adds A Penalty Term To The Model’s Objective Function That Discourages Excessively Large Model Parameters. L1 Regularization Can Force Some Coefficients To Become Exactly Zero, Which Makes It Useful For Feature Selection. L2 Regularization Shrinks Coefficients Toward Zero Without Usually Eliminating Them Completely. T
47. What Is L1 Regularization?
Ans:
- L1 Regularization Adds A Penalty Based On The Sum Of The Absolute Values Of Model Coefficients. One Important Property Of L1 Regularization Is That It Can Force Some Coefficients To Become Exactly Zero.
- This Makes L1 Regularization Useful For Automatic Feature Selection, Particularly In Datasets With Many Predictors.
- The Strength Of The Regularization Penalty Controls How Many Features May Be Removed From The Model.
48. What Is L2 Regularization?
Ans:
L2 Regularization Adds A Penalty Based On The Squared Values Of Model Coefficients. Instead Of Completely Eliminating Features, It Generally Encourages Their Coefficients To Become Smaller. This Can Improve Model Stability And Reduce Overfitting When A Dataset Contains Many Predictive Variables. Ridge Regression Is A Common Example Of A Model That Uses L2 Regularization. The Regularization Strength Is Usually Selected Through Cross-Validation Or Other Hyperparameter Optimization Methods.
49. What Is Hyperparameter Tuning?
Ans:
Hyperparameter Tuning Is The Process Of Selecting The Settings Of A Machine Learning Algorithm That Produce Good Validation Performance. Examples Of Hyperparameters Include Learning Rate, Maximum Tree Depth, Number Of Estimators, Regularization Strength, And Minimum Samples Per Leaf. Grid Search Tests A Predefined Combination Of Hyperparameter Values, While Random Search Samples Different Combinations From Specified Ranges Or Distributions.
50. What Is Ensemble Learning?
Ans:
Ensemble Learning Is A Machine Learning Approach That Combines Multiple Models To Produce A More Reliable Or Accurate Prediction. Bagging Methods Train Multiple Models Independently And Combine Their Predictions, Which Can Reduce Variance. Boosting Methods Build Models Sequentially, With Each New Model Attempting To Correct Errors From Earlier Models. Random Forest Is A Popular Bagging-Based Ensemble Algorithm, While Gradient Boosting Is A Popular Sequential Ensemble Technique.
51. What Is SQL?
Ans:
SQL Is A Structured Query Language Used To Store, Retrieve, Manipulate, And Analyze Data In Relational Databases. Data Scientists Frequently Use SQL To Extract Relevant Data From Large Tables Before Performing Statistical Analysis Or Machine Learning. Important SQL Commands Include SELECT, WHERE, GROUP BY, HAVING, JOIN, ORDER BY, And DISTINCT. SQL Also Supports Aggregations, Subqueries, Common Table Expressions, And Window Functions For Advanced Analytical Tasks.
52. What Is The Difference Between WHERE And HAVING?
Ans:
WHERE And HAVING Are Both Used To Filter Data, But They Operate At Different Stages Of A SQL Query. WHERE Filters Individual Rows Before GROUP BY And Aggregation Take Place. HAVING Filters Groups After Aggregation Has Been Performed. WHERE Is Commonly Used With Conditions On Individual Columns, While HAVING Is Often Used With Aggregate Functions Such As COUNT, SUM, AVG, MIN, And MAX.
53. What Is A SQL JOIN?
Ans:
A SQL JOIN Is Used To Combine Related Rows From Two Or More Tables Using One Or More Common Columns. INNER JOIN Returns Only Rows With Matching Values In Both Tables. LEFT JOIN Returns All Rows From The Left Table Along With Matching Rows From The Right Table, While RIGHT JOIN Performs The Opposite Operation. FULL OUTER JOIN Returns Matching And Non-Matching Rows From Both Tables Where Supported. Joins Are Frequently Used By Data Scientists To Combine Customer, Transaction, Product, And Other Business Data. The Correct Join Type Should Be Selected Based On The Required Business Question And Expected Result.
54. What Is A Window Function?
Ans:
- A Window Function Performs Calculations Across A Set Of Related Rows Without Combining Those Rows Into A Single Result Row.
- Common Window Functions Include ROW_NUMBER, RANK, DENSE_RANK, LAG, LEAD, SUM, AVG, And COUNT. PARTITION BY Can Be Used To Divide Data Into Logical Groups Before Performing The Calculation.
- ORDER BY Within The Window Defines The Sequence In Which Rows Are Evaluated. Window Functions Are Useful For Ranking Employees, Calculating Running Totals, Comparing Current And Previous Records,
55. How Can The Second Highest Salary Be Found In SQL?
Ans:
The Second Highest Salary Can Be Found Using Several SQL Approaches Depending On The Database System And Interview Requirement. One Common Approach Uses DENSE_RANK To Assign A Ranking To Distinct Salary Values. The Salary With Rank Two Represents The Second Highest Distinct Salary, Even When Multiple Employees Have The Highest Salary. Another Approach Uses A Subquery To Find The Maximum Salary Below The Overall Maximum Salary. DISTINCT Combined With ORDER BY And Appropriate Limiting Can Also Be Used In Some Database Systemse.
56. What Is GROUP BY In SQL?
Ans:
GROUP BY Is A SQL Clause Used To Combine Rows With The Same Values Into Logical Groups. It Is Commonly Used With Aggregate Functions Such As COUNT, SUM, AVG, MIN, And MAX. For Example, Sales Records Can Be Grouped By Product To Calculate Total Sales For Each Product. The Query Produces One Result Row For Each Group After The Aggregation Is Performed. HAVING Can Then Be Used To Filter The Resulting Groups Based On Aggregate Conditions. GROUP BY Is An Essential SQL Feature For Business Reporting, Data Analysis, Performance Measurement, And Data Science Tasks.
57. What Is A Subquery?
Ans:
A Subquery Is A SQL Query That Is Nested Inside Another SQL Query. It Can Appear In Clauses Such As SELECT, FROM, WHERE, Or HAVING Depending On The Requirement. Subqueries Are Useful For Solving Problems That Require Comparisons Against Aggregated Or Previously Calculated Results. For Example, A Subquery Can Be Used To Find Employees Whose Salary Is Greater Than The Average Salary. A Correlated Subquery Can Reference Values From The Outer Query And Execute Based On Each Outer Row
58. What Is A CTE?
Ans:
A Common Table Expression, Or CTE, Is A Temporary Named Result Set Created Using The WITH Clause In SQL. CTEs Help Organize Complex Queries Into Smaller And More Understandable Logical Steps. Multiple CTEs Can Be Combined To Perform Sequential Data Transformations Before Producing The Final Result. Recursive CTEs Can Also Be Used For Certain Hierarchical And Graph-Like Data Problems
59. What Is The Difference Between UNION And UNION ALL?
Ans:
| Aspect | UNION | UNION ALL |
|---|---|---|
| Duplicates | Removes Duplicate Rows From The Result. | Keeps All Duplicate Rows In The Result. |
| Performance | Generally Slower Because Duplicate Removal Is Required. | Generally Faster Because Duplicates Are Not Removed. |
| Usage | Used When Only Unique Records Are Required. | Used When All Records From Both Queries Are Required. |
| Components | Includes servers, databases, middleware | Specific processes on application servers |
60. What Is Data Warehousing?
Ans:
A Data Warehouse Is A Centralized Data Storage System Designed Primarily For Reporting, Analytics, And Business Intelligence. It Usually Integrates Data From Multiple Operational Databases, Applications, APIs, Files, And External Sources. Data Warehouses Are Optimized For Complex Queries, Aggregations, Historical Analysis, And Large-Scale Reporting Workloads. They Commonly Support Dashboards, Business Reports, Forecasting, And Data Science Projects. ETL Or ELT Processes Are Used To Collect, Transform, And Prepare Data Before It Becomes Available For Analysis

Get JOB Oriented Data Science Training for Beginners By MNC Experts
- Instructor-led Sessions
- Real-life Case Studies
- Assignments
61. What Is ETL?
Ans:
ETL Stands For Extract, Transform, And Load And Represents A Common Data Integration Process. During Extraction, Data Is Collected From Sources Such As Relational Databases, APIs, Applications, Files, And Other Systems. During Transformation, Data Can Be Cleaned, Validated, Joined, Standardized, Aggregated, And Reshaped According To Business Requirements. During Loading, The Prepared Data Is Stored In A Target System Such As A Data Warehouse. ETL Pipelines Help Organizations Create Consistent And Reliable Datasets For Reporting, Analytics, And Machine Learning. Production ETL Pipelines Also Require Monitoring, Logging, Error Handling, Data Validation, And Recovery Mechanisms.
62. What Is ELT?
Ans:
ELT Stands For Extract, Load, And Transform And Is A Modern Alternative To Traditional ETL Architecture. In ELT, Raw Or Lightly Processed Data Is Extracted From Source Systems And Loaded Directly Into A Scalable Data Warehouse Or Lakehouse. Transformations Are Then Performed Inside The Target Platform Using Its Computing Capabilities. This Approach Can Be Highly Effective With Modern Cloud Platforms That Provide Large-Scale Storage And Processing. ELT Allows Organizations To Preserve Raw Data And Apply Different Transformations As Business Requirements Change..
63. How does Handle A Large Dataset?
Ans:
Handling A Large Dataset Begins With Understanding Its Size, Structure, Data Types, Quality, And Processing Requirements. Efficient SQL Queries Should Select Only Required Columns And Filter Records As Early As Possible To Reduce Unnecessary Data Movement. When Data Exceeds Single-Machine Capacity, Distributed Processing Technologies Can Be Used To Process Data Across Multiple Machines. Sampling Can Be Useful During Exploratory Analysis When Full-Dataset Processing Is Not Required For Every Task. Aggregations And Feature Engineering Can Also Reduce The Amount Of Data Before Model Training. Processing Time, Memory Usage, Model Accuracy, Infrastructure Cost, And Scalability Should All Be Considered When Designing The Solution.
64. What Is Python Used For In Data Science?
Ans:
Python Is Widely Used In Data Science For Data Collection, Cleaning, Exploration, Visualization, Statistical Analysis, Machine Learning, Automation, And Model Deployment. Pandas Provides Powerful Tools For Data Manipulation And DataFrame-Based Analysis. NumPy Supports Numerical Computing, Arrays, Mathematical Operations, And Linear Algebra. Scikit-Learn Provides Many Classical Machine Learning Algorithms And Model Evaluation Utilities. Visualization Libraries Help Data Scientists Explore Distributions, Relationships, Trends, And Model Results.
65. What Is Pandas?
Ans:
Pandas Is A Popular Python Library Used For Data Manipulation, Cleaning, Transformation, And Analysis. Its Two Main Data Structures Are Series And DataFrame, Which Make It Convenient To Work With Structured Data. Pandas Supports Filtering, Sorting, Grouping, Joining, Aggregation, Reshaping, And Missing-Value Handling. It Can Read And Write Data From Formats Such As CSV, Excel, JSON, SQL Databases, And Other Sources. Data Scientists Frequently Use Pandas During Exploratory Data Analysis And Feature Engineering.
66. What Is NumPy?
Ans:
NumPy Is A Python Library Designed For Efficient Numerical And Scientific Computing. It Provides Powerful Multidimensional Array Structures Along With Functions For Mathematical Operations And Numerical Transformations. NumPy Array Operations Are Generally More Efficient Than Performing Large Numbers Of Individual Operations Using Pure Python Loops. It Supports Linear Algebra, Statistical Calculations, Random Number Generation, Broadcasting, And Array Manipulation.
67. What Is Exploratory Data Analysis?
Ans:
- Exploratory Data Analysis, Commonly Called EDA, Is The Process Of Understanding A Dataset Before Building Statistical Or Machine Learning Models.
- It Includes Examining Data Types, Distributions, Missing Values, Duplicates, Outliers, Relationships, And Potential Data Quality Issues.
- Summary Statistics, Histograms, Box Plots, Scatter Plots, Correlation Analysis, And Grouped Analysis Are Commonly Used During EDA. EDA Can Reveal Important Patterns That Influence Feature Engineering, Model Selection, And Business Interpretation.
68. How Does Detect Outliers?
Ans:
Outliers Can Be Detected Using Statistical Techniques, Visualization Methods, And Domain-Specific Rules. Box Plots Can Highlight Observations That Fall Far Outside The Typical Range Of A Numerical Variable. The Interquartile Range Method Identifies Potential Outliers Based On The First And Third Quartiles. Z-Scores Can Also Be Used To Identify Values That Are Far From The Mean When Their Statistical Assumptions Are Appropriate. Scatter Plots Are Useful For Detecting Unusual Observations In Relationships Between Two Variables. However, Statistical Detection Alone Is Not Enough Because Some Extreme Values May Represent Genuine And Important Business Events.
69. How Does Handle Outliers?
Ans:
Outliers Should First Be Investigated To Determine Whether They Are Data Errors, Measurement Problems, Or Genuine Extreme Observations. Incorrect Records Can Be Corrected Or Removed When Reliable Evidence Shows That They Are Invalid. Genuine Extreme Values Should Not Automatically Be Deleted Because They May Contain Important Business Information. Depending On The Situation, Outliers Can Be Retained, Capped, Transformed, Or Handled Using Robust Statistical And Machine Learning Methods. Transformations Such As Log Scaling Can Reduce The Influence Of Strongly Skewed Variables.
70. What Is Data Visualization?
Ans:
Data Visualization Is The Process Of Representing Data Graphically To Make Patterns, Relationships, Trends, And Distributions Easier To Understand. Common Visualization Types Include Bar Charts, Line Charts, Histograms, Scatter Plots, Box Plots, Heatmaps, And Other Analytical Charts. Visualization Can Help Identify Outliers, Changes Over Time, Correlations, And Differences Between Groups. It Is Also Useful For Communicating Analytical Results To Both Technical And Non-Technical Stakeholders
71. What Is A Time Series?
Ans:
A Time Series Is A Dataset In Which Observations Are Collected And Organized According To Time. Examples Include Daily Sales, Hourly Website Traffic, Monthly Revenue, Stock Prices, And Weekly Customer Orders. Time Series Data May Contain Trend, Seasonality, Cycles, And Random Variation. Forecasting Models Use Historical Patterns And Relevant Information To Estimate Future Values. Data Splitting For Time Series Problems Must Respect Chronological Order To Prevent Future Information From Entering The Training Process.
72. What Is Seasonality?
Ans:
Seasonality Refers To A Repeating Pattern That Occurs At Regular And Predictable Time Intervals In A Time Series. For Example, Retail Sales May Increase During Holiday Periods, While Website Traffic May Follow Different Patterns During Weekdays And Weekends. Seasonality Can Occur At Daily, Weekly, Monthly, Quarterly, Or Annual Intervals Depending On The Dataset. Identifying Seasonal Patterns Is Important For Demand Forecasting, Inventory Planning, Staffing, And Revenue Prediction.
73. What Is Forecasting?
Ans:
Forecasting Is The Process Of Using Historical And Relevant External Information To Estimate Future Outcomes. It Is Commonly Used For Sales, Product Demand, Inventory, Revenue, Website Traffic, Staffing, And Resource Planning. Time Order Is Important Because Future Information Should Not Be Used To Predict Past Observations During Model Training. Forecasting Can Use Statistical Techniques, Machine Learning Algorithms, Or Deep Learning Models Depending On The Complexity And Availability Of Data.
74. What Is A Recommendation System?
Ans:
A Recommendation System Is A Machine Learning Or Data-Driven System That Suggests Products, Content, Services, Or Actions That A User May Find Relevant. Recommendations Can Be Based On User Behavior, Product Attributes, Historical Interactions, Or A Combination Of Multiple Signals. Collaborative Filtering Uses Patterns In User-Item Interactions, While Content-Based Methods Use Characteristics Of Items To Generate Suggestions. Modern Recommendation Systems May Include Candidate Generation, Ranking, Personalization, And Business Rules.
75. What Is Collaborative Filtering?
Ans:
Collaborative Filtering Is A Recommendation Technique That Uses Historical Interactions Between Users And Items To Generate Personalized Recommendations. The Basic Idea Is That Users With Similar Preferences May Be Interested In Similar Products Or Content. User-Based Collaborative Filtering Finds Similar Users, While Item-Based Collaborative Filtering Finds Items That Have Similar Interaction Patterns. Matrix Factorization Techniques Can Represent Users And Items Using Lower-Dimensional Latent Factors.
76. What Is The Cold Start Problem?
Ans:
The Cold Start Problem Occurs In Recommendation Systems When There Is Little Or No Historical Information About A New User, Product, Or Content Item. A New User May Not Have Enough Clicks, Purchases, Ratings, Or Viewing History To Generate Accurate Personalized Recommendations. Similarly, A New Product May Have No Interaction Data To Determine Which Users Would Prefer It. Popularity-Based Recommendations, Content-Based Features, Demographic Information, And Initial User Preferences Can Help Address The Problem.
77. How Would Build A Customer Churn Model?
Ans:
Building A Customer Churn Model Starts By Clearly Defining What Churn Means And Specifying The Prediction Period. Historical Customer Records Can Then Be Collected And Labeled Based On Whether Customers Churned Within The Defined Future Window. Useful Features May Include Purchase Frequency, Recency, Spending, Product Usage, Customer Service Interactions, Complaints, And Engagement..
78. How Would Detect Fraud?
Ans:
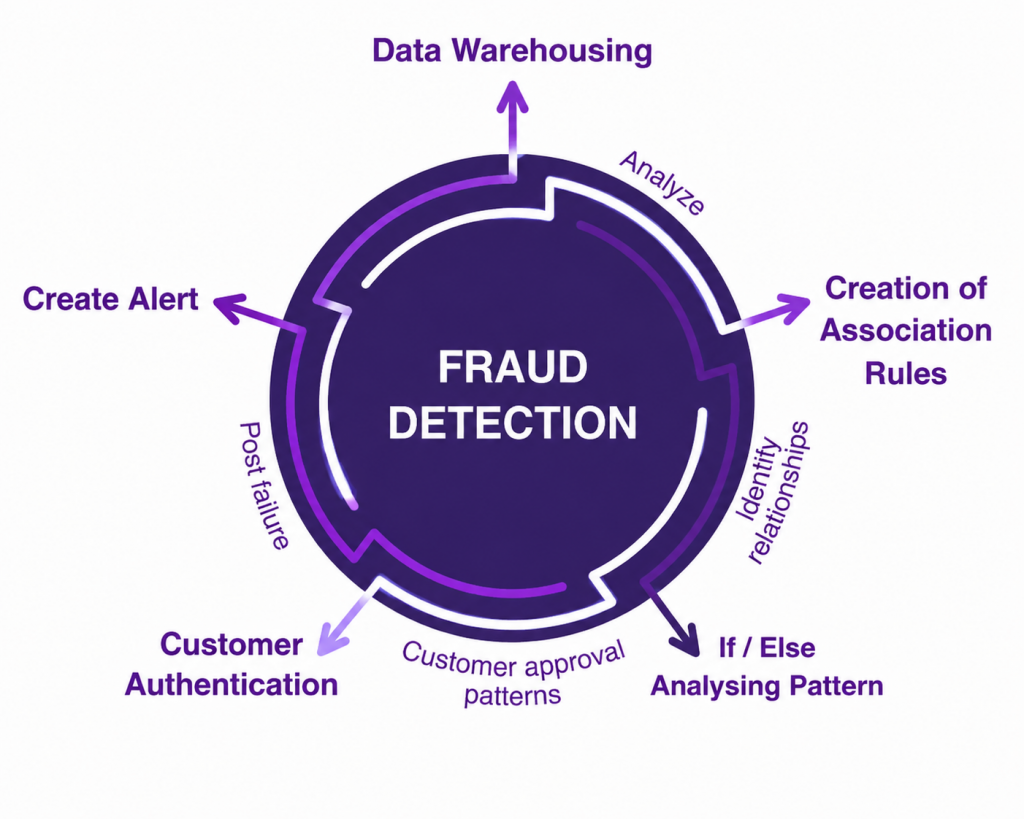
Fraud Detection Can Combine Historical Transaction Data, Customer Behavior, Account Information, Device Signals, And Real-Time Transaction Features. Useful Features May Include Transaction Amount, Transaction Frequency, Location, Device Information, Account Age, Previous Fraud History, And Unusual Behavioral Patterns. Supervised Classification Models Can Be Used When Reliable Historical Fraud Labels Are Available. When Labels Are Limited, Anomaly Detection Methods Can Help Identify Transactions That Differ Significantly From Normal Behavior. Precision, Recall, F1-Score, PR-AUC, And Cost-Based Metrics Are Important Because Fraud Datasets Are Often Highly Imbalanced
79. How Would Approach A Business Problem With Data?
Ans:
The First Step Is To Understand The Business Objective, Stakeholder Requirements, Constraints, And Measurable Definition Of Success. Relevant Data Sources Should Then Be Identified, Collected, Validated, And Assessed For Quality And Completeness. Exploratory Data Analysis Can Be Used To Understand Patterns, Relationships, Outliers, And Potential Causes Related To The Business Problem. A Suitable Statistical, Analytical, Or Machine Learning Approach Can Then Be Selected Based On The Objective And Available Data..
80. Explain A Machine Learning Model To A Non-Technical Person?
Ans:
- A Machine Learning Model Should Be Explained In Terms Of The Business Problem It Solves Rather Than Starting With Complex Mathematical Concepts.
- The Model Can Be Described As A System That Learns Patterns From Historical Examples And Uses Those Patterns To Make Predictions About New Cases.
- Important Inputs Can Be Explained Using Simple Business Examples That Stakeholders Can Easily Understand. Model Performance Should Be Presented Using Meaningful Metrics And Real-World Examples Rather Than Only Technical Measures.
81. What Is Model Interpretability?
Ans:
Model Interpretability Refers To The Ability To Understand How A Machine Learning Model Uses Input Features To Produce Its Predictions. Simple Models Such As Linear Regression And Decision Trees Are Often Easier To Interpret Than Complex Neural Networks Or Ensemble Systems. Techniques Such As SHAP, LIME, Partial Dependence, And Feature Importance Can Help Explain More Complex Models. Interpretability Can Help Identify Unexpected Behavior, Data Problems, Bias, And Important Predictive Factors
82. What Is SHAP?
Ans:
SHAP Stands For SHapley Additive Explanations And Is A Technique Used To Explain Machine Learning Model Predictions. It Assigns Contribution Values To Features To Show How Individual Features Influence A Particular Prediction. Positive Contributions Can Increase The Prediction, While Negative Contributions Can Decrease It Depending On The Model And Explanation Setup. SHAP Can Also Be Used To Analyze Feature Importance Across A Dataset And Understand General Model Behavior.
83. What Is Model Deployment?.
Ans:
Model Deployment Is The Process Of Making A Trained Machine Learning Model Available For Real-World Predictions And Applications. A Model Can Be Deployed Through A Real-Time API, Batch Processing Pipeline, Application Service, Or Other Production Architecture. Deployment Requires Packaging The Model Along With Required Libraries, Configuration, And Supporting Components. Production Systems Should Include Versioning, Logging, Monitoring, Error Handling, Security, And Rollback Capabilities
84. What Is Model Monitoring?
Ans:
Model Monitoring Is The Process Of Continuously Tracking A Machine Learning Model After It Has Been Deployed Into Production. Important Monitoring Metrics Can Include Prediction Accuracy, Latency, Error Rates, Data Quality, Feature Distributions, And Business Outcomes. Data Drift Occurs When The Distribution Of Production Input Data Changes Compared With The Training Data. Concept Drift Occurs When The Relationship Between Input Features And The Target Variable Changes Over Time
85. Find The Second Highest Number In A List Using Python?
Ans:
The Second Highest Number Can Be Found By Removing Duplicate Values And Sorting The Remaining Values In Descending Order.
- numbers = [10, 25, 15, 25, 30, 20]
- unique_numbers = list(set(numbers))
- unique_numbers.sort(reverse=True)
- print(unique_numbers[1])
86. Find Duplicate Elements In A List Using Python?
Ans:
Duplicate Elements Can Be Identified By Keeping Track Of Values That Have Already Been Encountered. A Set Can Store Previously Seen Values Efficiently. When An Element Appears Again, It Can Be Added To A Separate Set Of Duplicate Values.
- numbers = [10, 20, 30, 20, 40, 10, 50]
- seen = set()
- duplicates = set()
- for number in numbers:
- if number in seen:
- duplicates.add(number)
- else:
- seen.add(number)
- print(list(duplicates))
87. Count The Frequency Of Each Element In A List?
Ans:
The Frequency Of Each Element Can Be Calculated By Using A Python Dictionary. Each Element Is Used As A Dictionary Key, While Its Number Of Occurrences Is Stored As The Corresponding Value.
- numbers = [1, 2, 2, 3, 3, 3, 4]
- frequency = {}
- for number in numbers:
- frequency[number] = frequency.get(number, 0) + 1
- print(frequency)
88. Find The Maximum Value In A List Without Using The Max Function?
Ans:
The Maximum Value Can Be Found By Maintaining A Variable That Stores The Largest Value Encountered During Iteration. The Initial Value Can Be Set To The First Element Of The List.
- numbers = [15, 42, 8, 67, 23, 91, 34]
- maximum = numbers[0]
- for number in numbers:
- if number > maximum:
- maximum = number
- print(maximum)
89. Reverse A String Using Python?
Ans:
A String Can Be Reversed In Python Using Slicing With A Step Of Negative One. The Expression [::-1] Starts From The End Of The String And Moves Toward The Beginning.
- text = “Amazon”
- reversed_text = text[::-1]
- print(reversed_text)
90. Find The Average Of Numbers In A List Using Python?
Ans:
The Average Can Be Calculated By Dividing The Sum Of All Values By The Number Of Values In The List. Python Provides The sum() Function To Calculate The Total And len() To Determine The Number Of Elements.
- numbers = [10, 20, 30, 40, 50]
- average = sum(numbers) / len(numbers)
- print(average)