 LMS
LMS
Last updated on 31st Aug 2026| 6699

Deloitte Data Scientist Technical Interview Questions And Answers Are Designed To Assess Knowledge Of Data Science, Machine Learning, Statistics, Python, SQL, Data Analysis, And Model Development. The Technical Interview May Cover Fundamental Concepts Such As Data Preprocessing, Exploratory Data Analysis, Feature Engineering, Supervised Learning, Unsupervised Learning, And Model Evaluation. Candidates May Also Be Asked About Regression, Classification, Clustering, Ensemble Learning, Deep Learning, Natural Language Processing, And Time Series Analysis. Practical Questions Can Focus On Handling Missing Values, Outliers, Imbalanced Data, Feature Selection, Overfitting, And Data Leakage. Strong Knowledge Of Python Libraries Such As Pandas, NumPy, Matplotlib, Seaborn, And Scikit-Learn Can Be Important For Technical Discussions. SQL, Statistics, Data Visualization, And Problem-Solving Skills May Also Be Evaluated Through Scenario-Based Questions. This Collection Of 100 Deloitte Data Scientist Technical Interview Questions And Answers Helps Candidates Prepare For Technical Discussions And Build Confidence For Data Science Roles.
1. What Is Data Science?
Ans:
Data Science Is The Process Of Collecting, Processing, Analyzing, And Interpreting Data To Extract Useful Insights And Support Better Decision-Making. It Combines Statistics, Mathematics, Programming, Machine Learning, And Domain Knowledge To Solve Complex Business Problems. Data Scientists Work With Structured And Unstructured Data From Different Sources. The Process Usually Includes Data Collection, Data Cleaning, Exploratory Data Analysis, Model Building, And Evaluation. Python, SQL, Pandas, NumPy, And Machine Learning Libraries Are Commonly Used In Data Science Projects. Data Science Helps Organizations Identify Patterns, Predict Outcomes, Automate Decisions, And Improve Business Performance.
2. What Is The Difference Between Data Science And Data Analytics?
Ans:
| Aspect | Data Science | Data Analytics |
|---|---|---|
| Focus | Builds Predictive Models And Extracts Advanced Insights From Data. | Single running copy of SAP system |
| Techniques | Uses Machine Learning, Statistics, AI, And Predictive Modeling | Uses SQL, Statistics, Reporting, And Data Visualization |
| Purpose | Predicts Future Outcomes And Supports Complex Decision-Making. | Understands Past And Current Performance For Business Decisions |
| Tools | Python, R, Scikit-Learn, TensorFlow, Pandas, And SQL. | SQL, Excel, Tableau, Power BI, And Python. |
3. What Is Machine Learning?
Ans:
Machine Learning Is A Branch Of Artificial Intelligence That Enables Computers To Learn Patterns From Data Without Being Explicitly Programmed For Every Task. Machine Learning Algorithms Use Historical Data To Build Models That Can Make Predictions Or Decisions On New Data. The Main Types Of Machine Learning Are Supervised Learning, Unsupervised Learning, And Reinforcement Learning. Common Algorithms Include Linear Regression, Logistic Regression, Decision Trees, Random Forest, Support Vector Machines, And Neural Networks. Model Performance Is Evaluated Using Appropriate Metrics Based On The Business Problem.
4. What Is Supervised Learning?
Ans:
- Supervised Learning Is A Machine Learning Approach In Which An Algorithm Learns From A Dataset Containing Input Features And Known Target Values.
- The Model Attempts To Learn The Relationship Between Inputs And Outputs So That It Can Predict Results For New Data.
- Classification And Regression Are The Two Major Types Of Supervised Learning Problems. Classification Predicts Categories Such As Fraud Or Genuine Transactions, While Regression Predicts Continuous Values Such As Revenue Or House Prices. Common Algorithms Include Linear Regression, Logistic Regression, Decision Trees, Random Forest, And Support Vector Machine
5. What Is Unsupervised Learning?
Ans:
Unsupervised Learning Is A Machine Learning Technique Used When The Dataset Does Not Contain Predefined Target Labels. The Algorithm Attempts To Discover Hidden Patterns, Structures, Or Relationships Within The Data. Clustering And Dimensionality Reduction Are Common Applications Of Unsupervised Learning. Algorithms Such As K-Means, Hierarchical Clustering, DBSCAN, PCA, And Association Rule Mining Are Frequently Used. Unsupervised Learning Can Help Identify Customer Segments, Detect Unusual Behavior, And Explore High-Dimensional Datasets. It Is Particularly Useful During Exploratory Data Analysis And When Labeled Training Data Is Unavailable.
6. What Is Python Used For In Data Science?
Ans:
Python Is Widely Used In Data Science Because It Provides A Large Ecosystem Of Libraries For Data Processing, Visualization, Statistics, And Machine Learning. Pandas Is Commonly Used For Data Manipulation, While NumPy Supports Numerical Computation And Array Operations. Matplotlib And Seaborn Are Frequently Used For Visualization And Exploratory Analysis. Scikit-Learn Provides Implementations Of Many Classical Machine Learning Algorithms And Evaluation Tools. TensorFlow And PyTorch Are Commonly Used For Deep Learning Applications. Python Also Supports Automation, API Integration, Data Pipelines, And Model Deployment Workflows.
7. What Is Linear Regression?
Ans:
Linear Regression Is A Supervised Learning Algorithm Used To Predict A Continuous Dependent Variable From One Or More Independent Variables. It Assumes That The Relationship Between The Variables Can Be Represented Approximately By A Linear Equation. Simple Linear Regression Uses One Predictor, While Multiple Linear Regression Uses Several Predictors. The Model Estimates Coefficients That Minimize The Difference Between Actual And Predicted Values. Important Assumptions Include Linearity, Independence, Homoscedasticity, And Appropriate Treatment Of Multicollinearity. Linear Regression Is Commonly Used For Sales Forecasting, Price Prediction, Demand Estimation, And Trend Analysis.
8. What Is Logistic Regression?
Ans:
- Logistic Regression Is A Supervised Learning Algorithm Primarily Used For Classification Problems. Instead Of Directly Predicting A Continuous Value, It Estimates The Probability That An Observation Belongs To A Particular Class.
- The Logistic Or Sigmoid Function Converts The Model Output Into A Probability Between Zero And One. A Classification Threshold Is Then Used To Assign The Observation To A Class
- .Logistic Regression Is Commonly Used For Binary Classification Problems Such As Customer Churn, Fraud Detection, And Loan Default Prediction. Model Performance Can Be Evaluated Using Accuracy, Precision, Recall, F1-Score, ROC-AUC, And Confusion Matrix.
9. What Is A Decision Tree?
Ans:
A Decision Tree Is A Supervised Machine Learning Algorithm That Makes Predictions By Repeatedly Splitting Data Based On Feature Conditions. Each Internal Node Represents A Decision, Each Branch Represents An Outcome, And Each Leaf Represents A Prediction. Decision Trees Can Be Used For Both Classification And Regression Problems. Splitting Criteria Such As Gini Impurity, Entropy, Information Gain, Or Variance Reduction Can Be Used Depending On The Problem. Decision Trees Are Easy To Interpret And Can Handle Numerical And Categorical Features. However, Deep Trees Can Overfit Training Data, So Techniques Such As Pruning, Maximum Depth, And Minimum Samples Constraints Are Often Applied.
10. What Is Random Forest?
Ans:
Random Forest Is An Ensemble Machine Learning Algorithm That Combines Multiple Decision Trees To Produce More Robust Predictions. Each Tree Is Trained Using A Random Sample Of The Training Data And A Random Subset Of Features. The Final Prediction Is Usually Based On Majority Voting For Classification Or Averaging For Regression. Random Forest Reduces The Variance And Overfitting Risk Associated With Individual Decision Trees. It Can Handle Nonlinear Relationships, Feature Interactions, And High-Dimensional Data Effectively. Important Hyperparameters Include The Number Of Trees, Maximum Depth, Minimum Samples Split, And Number Of Features Considered At Each Split.
11. What Is Overfitting?
Ans:
Overfitting Occurs When A Machine Learning Model Learns The Training Data Too Closely, Including Noise And Irrelevant Patterns. Such A Model Usually Performs Very Well On Training Data But Performs Poorly On Unseen Data. Overfitting Can Occur When A Model Is Too Complex Relative To The Amount Or Quality Of Available Training Data. Techniques Such As Cross-Validation, Regularization, Pruning, Feature Selection, And Early Stopping Can Help Reduce Overfitting. Increasing The Amount Of Quality Training Data Can Also Improve Generalization. The Main Objective Is To Build A Model That Performs Consistently On Both Training And Unseen Data.
12. What Is Underfitting?
Ans:
- Underfitting Occurs When A Machine Learning Model Is Too Simple To Capture Important Patterns In The Training Data. An Underfitted Model Usually Performs Poorly On Both Training And Testing Datasets.
- It Can Result From Using An Oversimplified Algorithm, Insufficient Features, Excessive Regularization, Or Inadequate Training. Increasing Model Complexity Or Adding Relevant Features Can Help Address Underfitting.
- Reducing Excessive Regularization And Improving Feature Engineering May Also Improve Performance. The Goal Is To Find A Suitable Balance Between Model Complexity And Generalization.
13. What Is Bias And Variance?
Ans:
Bias Represents The Error Introduced When A Model Makes Oversimplified Assumptions About The Underlying Data. Variance Represents The Sensitivity Of A Model To Changes In The Training Dataset. A High-Bias Model Can Lead To Underfitting Because It Is Too Simple To Capture Important Patterns. A High-Variance Model Can Lead To Overfitting Because It Learns Noise From The Training Data. The Bias-Variance Tradeoff Involves Finding A Model Complexity That Generalizes Well To Unseen Data. Techniques Such As Cross-Validation, Regularization, Ensemble Methods, And Appropriate Feature Engineering Help Manage This Tradeoff.
14. What Is Cross-Validation?
Ans:
Cross-Validation Is A Model Evaluation Technique Used To Estimate How Well A Machine Learning Model Will Perform On Unseen Data. In K-Fold Cross-Validation, The Dataset Is Divided Into K Subsets Called Folds. The Model Is Trained On K-1 Folds And Validated On The Remaining Fold, Repeating The Process Until Every Fold Has Been Used For Validation. The Individual Scores Are Then Averaged To Obtain A More Reliable Performance Estimate. Cross-Validation Helps Detect Overfitting And Provides Better Use Of Limited Training Data. It Is Commonly Used For Model Selection, Hyperparameter Tuning, And Performance Comparison..
15. What Is Train-Test Split?
Ans:
- Train-Test Split Is A Technique Used To Divide A Dataset Into Separate Training And Testing Portions. The Training Dataset Is Used To Learn Model Parameters, While The Testing Dataset Is Reserved For Evaluating Performance On Unseen Data.
- A Common Split May Allocate Around 70 To 80 Percent Of The Data For Training And The Remaining Portion For Testing.
- The Exact Ratio Depends On Dataset Size And Project Requirements. The Test Data Should Not Be Used During Model Training Or Hyperparameter Optimization. Keeping The Test Set Separate Helps Provide A More Realistic Estimate Of Model Generalization.
16. What Is Feature Engineering?
Ans:
- Feature Engineering Is The Process Of Creating, Transforming, Selecting, Or Combining Variables To Improve Machine Learning Model Performance. Raw Data Often Does Not Directly Represent The Patterns Needed By A Machine Learning Algorithm.
- Techniques Can Include Extracting Date Components, Creating Ratios, Encoding Categories, Aggregating Transactions, And Transforming Numerical Variables. Good Features Can Improve Model Accuracy, Interpretability, And Training Efficiency.
- Feature Engineering Requires Understanding Both The Dataset And The Business Problem. It Is Often One Of The Most Important Steps In Building An Effective Data Science Solution.
17. What Is Feature Selection?
Ans:
Feature Selection Is The Process Of Identifying The Most Relevant Variables For A Machine Learning Model And Removing Unnecessary Features. Irrelevant Or Redundant Features Can Increase Model Complexity, Training Time, And The Risk Of Overfitting. Feature Selection Methods Include Filter Methods, Wrapper Methods, And Embedded Methods. Correlation Analysis, Mutual Information, Recursive Feature Elimination, And Feature Importance Are Common Approaches. Removing Unimportant Features Can Make Models Easier To Interpret And More Efficient. Feature Selection Should Be Performed Carefully To Avoid Removing Variables That Contain Important Predictive Information.
18. What Is Normalization?
Ans:
Normalization Is A Data Preprocessing Technique Used To Scale Numerical Features To A Common Range. A Common Method Is Min-Max Scaling, Which Typically Converts Values Into A Range Between Zero And One. Normalization Is Particularly Useful For Algorithms That Are Sensitive To Feature Magnitudes, Such As K-Nearest Neighbors, Neural Networks, And Some Gradient-Based Algorithms. Without Scaling, Features With Larger Numerical Values May Have An Unintended Influence On Model Training. Normalization Should Be Calculated Using Training Data Parameters To Avoid Data Leakage. The Same Transformation Is Then Applied To Validation, Testing, And Future Production Data.
19. What Is Standardization?
Ans:
Standardization Transforms A Numerical Feature So That It Has A Mean Of Approximately Zero And A Standard Deviation Of Approximately One. The Transformation Is Generally Performed By Subtracting The Mean And Dividing By The Standard Deviation. Standardization Is Useful For Algorithms Such As Logistic Regression, Support Vector Machines, K-Means, And Principal Component Analysis. It Helps Place Features On Comparable Scales Without Restricting Them To A Fixed Range. The Mean And Standard Deviation Should Be Calculated Only From The Training Data. The Same Training Transformation Must Then Be Applied To Validation, Test, And Production Data.
20. What Is Data Preprocessing?
Ans:
Data Preprocessing Is The Process Of Preparing Raw Data For Analysis And Machine Learning. It May Include Handling Missing Values, Removing Duplicates, Correcting Inconsistent Data, Encoding Categorical Variables, Scaling Numerical Features, And Treating Outliers. Proper Preprocessing Improves Data Quality And Helps Machine Learning Algorithms Produce Reliable Results. The Appropriate Techniques Depend On The Dataset, Algorithm, And Business Objective. Preprocessing Steps Should Be Designed Carefully To Prevent Data Leakage Between Training And Testing Data. A Well-Defined Preprocessing Pipeline Also Makes Model Deployment And Maintenance More Reliable.
21. What Is Exploratory Data Analysis?
Ans:
Exploratory Data Analysis Is The Process Of Investigating And Summarizing A Dataset To Understand Its Structure, Distribution, Relationships, And Potential Problems. It Usually Includes Descriptive Statistics, Missing Value Analysis, Duplicate Detection, Outlier Identification, And Visualization. Common Visualizations Include Histograms, Box Plots, Scatter Plots, Bar Charts, And Correlation Heatmaps. EDA Helps Identify Patterns And Relationships That Can Guide Feature Engineering And Model Selection. It Can Also Reveal Data Quality Issues Before Model Development Begins. Python Libraries Such As Pandas, Matplotlib, And Seaborn Are Commonly Used For EDA.
22. What Is A Confusion Matrix?
Ans:
A Confusion Matrix Is A Table Used To Evaluate The Performance Of A Classification Model. It Usually Contains Four Categories Called True Positive, True Negative, False Positive, And False Negative. True Positive And True Negative Represent Correct Predictions, While False Positive And False Negative Represent Incorrect Predictions. The Matrix Helps Understand Which Types Of Classification Errors A Model Is Making. Metrics Such As Accuracy, Precision, Recall, And F1-Score Can Be Calculated From These Values. Confusion Matrices Are Particularly Useful When The Costs Of Different Types Of Errors Are Not The Same.
23. What Is Precision?
Ans:
Precision Measures The Proportion Of Predicted Positive Observations That Are Actually Positive. It Is Calculated As True Positives Divided By The Sum Of True Positives And False Positives. High Precision Means That The Model Produces Relatively Few False Positive Predictions. Precision Is Important In Situations Where False Positive Results Can Be Costly Or Harmful. For Example, A Spam Detection System May Need High Precision To Avoid Incorrectly Marking Important Emails As Spam. Precision Is Usually Considered Along With Recall Because Optimizing One Metric Alone May Not Provide A Balanced Model.
24. What Is Recall?
Ans:
- Recall Measures The Proportion Of Actual Positive Observations That Are Correctly Identified By A Classification Model. It Is Calculated As True Positives Divided By The Sum Of True Positives And False Negatives.
- High Recall Means That The Model Successfully Identifies Most Of The Actual Positive Cases. Recall Is Particularly Important When Missing A Positive Case Has Significant Consequences.
- For Example, Fraud Detection And Certain Risk Detection Systems May Prioritize Identifying As Many Positive Cases As Possible. Recall Should Be Evaluated Along With Precision To Understand The Overall Classification Performance.
25. What Is F1-Score?
Ans:
- F1-Score Is A Classification Metric That Combines Precision And Recall Into A Single Measure. It Is Calculated As The Harmonic Mean Of Precision And Recall.
- F1-Score Is Especially Useful When A Dataset Is Imbalanced And Accuracy Alone May Be Misleading. A High F1-Score Indicates That The Model Achieves A Reasonable Balance Between False Positives And False Negatives.
- It Can Be Particularly Helpful In Problems Such As Fraud Detection, Spam Detection, And Medical Classification. However, The Best Evaluation Metric Should Always Be Selected According To The Business Objective And Cost Of Errors.
26. What Is Accuracy?
Ans:
Accuracy Measures The Proportion Of Total Predictions That A Classification Model Gets Correct. It Is Calculated As The Number Of Correct Predictions Divided By The Total Number Of Predictions. Accuracy Can Be Useful When Classes Are Relatively Balanced And The Costs Of Different Errors Are Similar. However, It Can Be Misleading For Highly Imbalanced Datasets. For Example, A Model That Predicts The Majority Class For Every Observation Can Have High Accuracy But Poorly Detect The Minority Class. Therefore, Precision, Recall, F1-Score, ROC-AUC, And Other Metrics Should Also Be Considered When Appropriate.
27. What Is ROC-AUC?
Ans:
ROC-AUC Is A Performance Metric Commonly Used To Evaluate Binary Classification Models Across Different Classification Thresholds. The ROC Curve Plots True Positive Rate Against False Positive Rate At Different Threshold Values. AUC Represents The Area Under The ROC Curve And Indicates How Well The Model Separates Positive And Negative Classes. A Value Near One Indicates Strong Discrimination, While A Value Around 0.5 Suggests Performance Similar To Random Classification. ROC-AUC Is Useful For Comparing Models Without Selecting A Single Threshold. However, For Highly Imbalanced Problems, Precision-Recall Curves May Sometimes Provide More Informative Evaluation.
28. What Is Mean Squared Error?.
Ans:
Mean Squared Error Is A Regression Evaluation Metric That Measures The Average Squared Difference Between Actual And Predicted Values. Squaring The Errors Gives Greater Weight To Larger Prediction Errors. A Lower MSE Generally Indicates Better Model Performance On The Evaluation Dataset. MSE Is Differentiable And Therefore Commonly Used As A Loss Function During Model Training. However, Its Squared Units Can Make Direct Interpretation Less Intuitive. MSE Is Useful When Large Errors Need To Be Penalized More Strongly Than Smaller Errors.
29. What Is Mean Absolute Error?
Ans:
Mean Absolute Error Measures The Average Absolute Difference Between Actual And Predicted Values In A Regression Problem. Unlike Mean Squared Error, MAE Gives Equal Linear Weight To Each Error. A Lower MAE Indicates That Predictions Are, On Average, Closer To The Actual Values. MAE Is Easier To Interpret Because Its Units Are The Same As The Target Variable. It Is Also Less Sensitive To Extreme Errors Than MSE. MAE Is Commonly Used In Forecasting, Demand Prediction, Revenue Prediction, And Other Regression Applications.
30. What Is R-Squared?
Ans:
- R-Squared Is A Regression Metric That Indicates How Much Of The Variation In The Target Variable Is Explained By The Model. Its Value Is Commonly Interpreted As The Proportion Of Variance Explained Relative To A Baseline Model.
- A Higher R-Squared Generally Indicates That The Model Explains More Variation In The Target Data. However, A High R-Squared Does Not Automatically Mean That The Model Is Appropriate Or Generalizes Well.
- Additional Metrics Such As MAE, RMSE, And Adjusted R-Squared Should Also Be Considered. R-Squared Should Always Be Interpreted In The Context Of The Dataset And Business Problem.
31. What Is K-Means Clustering?
Ans:
K-Means Is An Unsupervised Machine Learning Algorithm Used To Divide Data Into A Predefined Number Of Clusters. The Algorithm Assigns Observations To The Nearest Cluster Centroid And Recalculates Centroids Iteratively. This Process Continues Until The Cluster Assignments Or Centroids Stabilize According To The Stopping Criteria. The Number Of Clusters, Represented By K, Usually Needs To Be Selected Before Training. Methods Such As The Elbow Method And Silhouette Score Can Help Choose A Suitable K. K-Means Is Commonly Used For Customer Segmentation, Market Analysis, And Pattern Discovery.
32. What Is PCA?
Ans:
- Principal Component Analysis Is A Dimensionality Reduction Technique Used To Transform A Dataset With Many Correlated Features Into A Smaller Number Of Uncorrelated Components. The Principal Components Capture The Maximum Possible Variance In The Data In Descending Order.
- PCA Can Reduce Computational Complexity, Remove Redundant Information, And Help Visualize High-Dimensional Data. Numerical Features Usually Need Appropriate Scaling Before PCA Is Applied.
- The Number Of Components Can Be Selected Based On Explained Variance And Business Requirements. PCA Is Widely Used In Data Exploration, Visualization, Feature Compression, And Machine Learning Pipelines.
33. What Is Gradient Descent?
Ans:
Gradient Descent Is An Optimization Algorithm Used To Minimize A Model’s Loss Or Cost Function. It Works By Calculating The Gradient Of The Loss With Respect To Model Parameters And Updating Those Parameters In The Direction That Reduces The Loss. The Learning Rate Controls The Size Of Each Update. A Very Small Learning Rate Can Make Training Slow, While A Very Large Learning Rate Can Cause Unstable Training. Batch, Stochastic, And Mini-Batch Gradient Descent Are Common Variants. Gradient Descent Is Widely Used In Linear Models, Logistic Regression, Neural Networks, And Deep Learning Algorithms.
34. What Is Regularization?
Ans:
Regularization Is A Technique Used To Reduce Overfitting By Adding A Penalty For Model Complexity During Training. L1 Regularization Adds A Penalty Based On The Absolute Values Of Model Coefficients. L2 Regularization Adds A Penalty Based On The Squared Values Of Model Coefficients. L1 Regularization Can Encourage Some Coefficients To Become Zero, Which Can Support Feature Selection. L2 Regularization Generally Shrinks Coefficients Without Making Most Of Them Exactly Zero. Regularization Strength Must Be Selected Carefully, Often Through Cross-Validation, To Balance Fit And Generalization.
35. What Is L1 And L2 Regularization?
Ans:
L1 And L2 Are Two Common Regularization Techniques Used To Control Model Complexity And Reduce Overfitting. L1 Regularization Adds The Sum Of Absolute Coefficient Values As A Penalty To The Objective Function. Because Of Its Properties, L1 Can Produce Sparse Models By Setting Some Coefficients Exactly To Zero. L2 Regularization Adds The Sum Of Squared Coefficient Values And Generally Shrinks Coefficients Toward Zero. L2 Is Often Useful When Many Features Contribute To The Prediction And Multicollinearity Exists. The Choice Between L1, L2, Or A Combination Depends On The Dataset And Modeling Requirements.
36. What Is Hyperparameter Tuning?
Ans:
Hyperparameter Tuning Is The Process Of Finding Suitable Configuration Values For A Machine Learning Algorithm Before Or During Model Training. Hyperparameters Include Values Such As Learning Rate, Tree Depth, Number Of Trees, Regularization Strength, And Number Of Neighbors. Common Search Methods Include Grid Search, Random Search, And Bayesian Optimization. Cross-Validation Is Often Used To Compare Different Hyperparameter Combinations. Proper Tuning Can Improve Model Performance And Generalization. Hyperparameter Selection Should Be Performed Using Training And Validation Data Without Repeatedly Evaluating Against The Final Test Dataset.
37. What Is Grid Search?
Ans:
Grid Search Is A Hyperparameter Optimization Technique That Tests A Predefined Set Of Parameter Combinations. Every Combination In The Specified Search Grid Is Evaluated Using A Chosen Performance Metric. Cross-Validation Is Commonly Combined With Grid Search To Obtain More Reliable Estimates. Grid Search Can Be Easy To Implement And Understand For Small Search Spaces. However, It Can Become Computationally Expensive When Many Hyperparameters And Values Are Included. Random Search Or Bayesian Optimization May Be More Efficient For Large Or Complex Hyperparameter Spaces.
38. What Is Random Search?
Ans:
- Random Search Is A Hyperparameter Optimization Technique That Randomly Samples Parameter Combinations From Defined Distributions Or Search Ranges. Unlike Grid Search, It Does Not Evaluate Every Possible Combination.
- Random Search Can Explore Large Hyperparameter Spaces More Efficiently When Only Some Parameters Have Strong Influence On Model Performance.
- The Number Of Iterations Can Be Controlled According To Available Computational Resources. Cross-Validation Can Be Used To Evaluate Each Sampled Configuration. It Is Often A Practical Alternative To Grid Search For Complex Machine Learning Models.
39. What Is Ensemble Learning?
Ans:
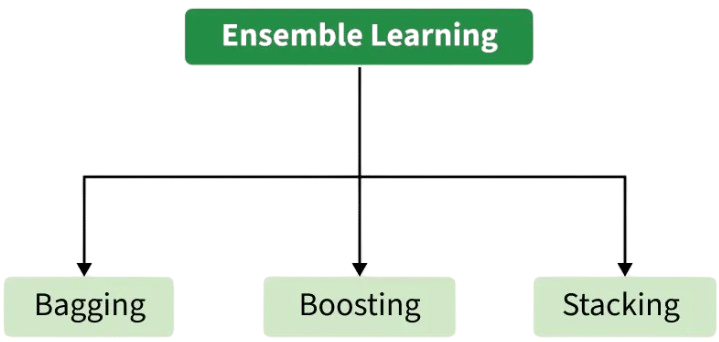
- Ensemble Learning Combines Multiple Machine Learning Models To Produce A Stronger Overall Prediction. The Basic Idea Is That Different Models May Make Different Errors, And Combining Them Can Improve Generalization.
- Bagging, Boosting, And Stacking Are Common Ensemble Techniques. Random Forest Is An Example Of Bagging, While Gradient Boosting And AdaBoost Are Examples Of Boosting.
- Ensemble Methods Can Improve Accuracy, Stability, And Robustness Compared With Individual Models. However, They May Increase Computational Cost And Sometimes Reduce Model Interpretability.
40. What Is Boosting?
Ans:
Boosting Is An Ensemble Learning Technique That Builds Models Sequentially So That Later Models Focus More On Errors Made By Earlier Models. Each New Model Attempts To Correct Weaknesses In The Existing Ensemble. Popular Boosting Algorithms Include AdaBoost, Gradient Boosting, XGBoost, LightGBM, And CatBoost. Boosting Can Produce Highly Accurate Models For Structured Tabular Data. However, Excessive Complexity Or Poor Hyperparameter Selection Can Cause Overfitting. Learning Rate, Number Of Estimators, Tree Depth, And Regularization Are Important Parameters In Many Boosting Algorithms.

41. What Is XGBoost?
Ans:
XGBoost Is A Gradient Boosting Algorithm Designed For Efficient And High-Performance Machine Learning On Structured Data. It Builds Decision Trees Sequentially, With Each New Tree Improving The Errors Of The Existing Ensemble. XGBoost Includes Regularization And Several Optimization Techniques To Improve Performance And Reduce Overfitting. It Can Handle Missing Values And Supports Various Objective Functions For Classification And Regression. Important Hyperparameters Include Learning Rate, Maximum Tree Depth, Number Of Estimators, Subsample, And Column Sampling. XGBoost Is Frequently Used In Competitions And Business Applications Involving Tabular Data.
42. What Is Data Leakage?
Ans:
Data Leakage Occurs When Information That Should Not Be Available During Model Training is Used Directly Or Indirectly By The Model. This Can Cause Unrealistically High Validation Or Test Performance That Does Not Reflect Real-World Performance. Leakage Can Happen Through Incorrect Preprocessing, Using Future Information, Duplicate Records, Or Calculating Features Using Target-Related Information. For Example, Scaling The Entire Dataset Before Splitting Can Allow Test Information To Influence Training Transformations. Preventing Leakage Requires Separating Training And Evaluation Data And Applying Transformations Using Training Data Only. Data Leakage Is A Critical Concern In Reliable Machine Learning Development.
43. What Are Missing Values?
Ans:
Missing Values Represent Data Points That Are Not Available, Not Recorded, Or Not Applicable In A Dataset. They Can Occur Because Of Data Entry Errors, System Failures, Optional Fields, Or Data Integration Problems. Missing Values Can Be Handled Through Deletion, Statistical Imputation, Model-Based Imputation, Or Domain-Specific Rules. Numerical Values May Be Imputed Using Mean, Median, Or More Advanced Methods. Categorical Values Can Sometimes Be Replaced With The Mode Or A Dedicated Unknown Category. The Appropriate Strategy Depends On The Missingness Pattern, Data Distribution, Business Meaning, And Modeling Objective.
44. How Does Handle Outliers?
Ans:
- Outliers Are Observations That Differ Significantly From The General Pattern Of A Dataset. They Can Represent Genuine Rare Events, Measurement Errors, Data Entry Problems, Or Unusual Business Cases.
- Common Detection Methods Include Box Plots, Z-Scores, Interquartile Range, And Isolation Forest. Depending On The Context, Outliers Can Be Removed, Capped, Transformed, Or Retained.
- Removing Valid Rare Events Can Damage A Model, Especially In Fraud Detection And Risk Analysis. Therefore, Outlier Treatment Should Be Based On Statistical Evidence And Domain Understanding Rather Than Automatic Removal.
45. What Is Imbalanced Data?
Ans:
Imbalanced Data Occurs When The Classes In A Classification Dataset Have Very Different Numbers Of Observations. For Example, A Fraud Dataset May Contain Many Genuine Transactions And Relatively Few Fraudulent Transactions. In Such Cases, Accuracy Can Give A Misleading Impression Of Model Performance. Techniques Such As Oversampling, Undersampling, SMOTE, Class Weights, And Appropriate Threshold Selection Can Help Address Imbalance. Metrics Such As Precision, Recall, F1-Score, And Precision-Recall AUC Are Often More Informative. The Appropriate Technique Depends On The Business Cost Of False Positives And False Negatives.
46. What Is SMOTE?
Ans:
SMOTE, Or Synthetic Minority Over-Sampling Technique, Is Used To Address Class Imbalance In Classification Problems. Instead Of Simply Duplicating Existing Minority Samples, SMOTE Generates Synthetic Minority Examples Based On Neighboring Minority Observations. This Can Help Increase The Representation Of The Minority Class During Model Training. SMOTE Should Generally Be Applied Only To The Training Portion Of The Dataset. Applying It Before The Train-Test Split Can Cause Data Leakage And Inflated Evaluation Results. The Technique Should Also Be Used Carefully When The Minority Class Contains Noise Or Overlapping Class Boundaries.
47. What Is One-Hot Encoding?
Ans:
One-Hot Encoding Is A Technique Used To Convert Categorical Variables Into Numerical Binary Features. Each Unique Category Is Represented By A Separate Column, And An Observation Receives A Value Of One For Its Category And Zero For Other Categories. For Example, A City Variable Containing Three Categories Can Become Three Binary Columns. One-Hot Encoding Is Useful For Many Machine Learning Algorithms That Cannot Directly Process Text Categories. It Can Increase The Number Of Features When A Variable Has Many Unique Categories. Techniques Such As Feature Hashing Or Target Encoding May Be Considered For High-Cardinality Categorical Variables.
48. What Is Label Encoding?
Ans:
Label Encoding Converts Categorical Values Into Integer Labels. For Example, Categories Such As Red, Blue, And Green May Be Represented By Numerical Codes Such As Zero, One, And Two. It Can Be Suitable For Ordinal Variables Where The Categories Have A Meaningful Order. For Nominal Variables, Arbitrary Numerical Ordering Can sometimes mislead algorithms into assuming relationships that do not exist. Therefore, One-Hot Encoding Is Often Preferred For Nominal Features In Many Models. The Encoding Mapping Should Be Consistent Between Training And Production Data.
49. What Is Multicollinearity?
Ans:
Multicollinearity Occurs When Two Or More Independent Variables In A Dataset Are Highly Correlated With Each Other. It Can Make Regression Coefficients Unstable And Make Individual Feature Effects Difficult To Interpret. Multicollinearity Can Be Detected Using Correlation Analysis Or Metrics Such As Variance Inflation Factor. Removing Redundant Variables, Combining Related Features, Or Applying Regularization Can Help Reduce Its Impact. Tree-Based Models Are Generally Less Sensitive To Multicollinearity Than Traditional Linear Models. Addressing Multicollinearity Is Particularly Important When Model Interpretability And Coefficient Analysis Are Required.
50. What Is A Data Pipeline?
Ans:
A Data Pipeline Is A Series Of Automated Steps Used To Collect, Transform, Process, Store, And Deliver Data For Analysis Or Machine Learning. A Typical Pipeline May Include Data Ingestion, Validation, Cleaning, Transformation, Feature Engineering, Model Processing, And Data Storage. Pipelines Can Integrate Data From Databases, APIs, Cloud Storage, Streaming Systems, And Enterprise Applications. Automation Helps Improve Reproducibility, Reliability, And Scalability. Tools Such As Apache Airflow, Spark, AWS Services, Azure Services, And Various ETL Platforms Can Be Used To Build Pipelines. A Well-Designed Pipeline Also Includes Monitoring, Logging, Error Handling, And Data Quality Checks.
51. What Is ETL?
Ans:
- ETL Stands For Extract, Transform, And Load, And It Is A Process Used To Move And Prepare Data For Analysis Or Storage. During Extraction, Data Is Collected From Sources Such As Databases, APIs, Files, Or Enterprise Applications.
- During Transformation, Data Is Cleaned, Standardized, Joined, Validated, And Converted Into The Required Format. During Loading, The Process Stores The Transformed Data In A Target System Such As A Data Warehouse.
- ETL Helps Organizations Consolidate Data From Multiple Sources Into A Consistent Structure. It Is Commonly Used In Business Intelligence, Reporting, Analytics, And Data Science Workflows.
52. What Is ELT?
Ans:
- ELT Stands For Extract, Load, And Transform, And It Differs From ETL In The Order Of Processing. Data Is First Extracted From Source Systems And Loaded Into A Target Data Platform.
- Transformation Is Then Performed Within The Target Platform Using Its Processing Capabilities. ELT Is Commonly Used With Modern Cloud Data Warehouses And Data Lakes Because They Can Handle Large Processing Workloads.
- It Can Provide Greater Flexibility For Analysts And Data Scientists Because Raw Data Can Be Retained. The Choice Between ETL And ELT Depends On Data Volume, Architecture, Security, Processing Requirements, And Business Needs.
53. What Is SQL?
Ans:
SQL, Or Structured Query Language, Is Used To Manage And Query Relational Databases. Data Scientists Commonly Use SQL To Extract, Filter, Aggregate, Join, And Analyze Data Before Applying Statistical Or Machine Learning Techniques. Important SQL Commands Include SELECT, WHERE, GROUP BY, HAVING, ORDER BY, JOIN, INSERT, UPDATE, And DELETE. SQL Can Also Support Window Functions, Common Table Expressions, Subqueries, And Advanced Analytical Queries. Strong SQL Skills Are Important Because Much Of The Data Used In Data Science Projects Is Stored In Relational Systems. SQL Also Helps Validate Data Quality And Investigate Business Problems.
54. What Is A SQL Join?
Ans:
A SQL Join Combines Rows From Two Or More Tables Based On A Related Column Or Join Condition. Common Types Include INNER JOIN, LEFT JOIN, RIGHT JOIN, And FULL OUTER JOIN. INNER JOIN Returns Matching Records From Both Tables, While LEFT JOIN Retains All Records From The Left Table And Matching Records From The Right Table. Joins Are Commonly Used To Combine Customer, Transaction, Product, Employee, And Other Related Data. Incorrect Join Conditions Can Produce Duplicate Rows Or Missing Information. Therefore, Understanding Keys, Cardinality, And Relationships Between Tables Is Important When Using Joins.
55. What Is A Window Function In SQL?
Ans:
A Window Function Performs Calculations Across Related Rows Without Collapsing The Result Into A Single Row. Common Window Functions Include ROW_NUMBER, RANK, DENSE_RANK, LAG, LEAD, SUM, AVG, And COUNT. The OVER Clause Defines The Partitioning And Ordering Used By The Function. Window Functions Are Useful For Ranking, Running Totals, Moving Averages, Period Comparisons, And Identifying Previous Or Next Records. They Are Particularly Valuable In Analytical Queries And Data Science Data Preparation. Unlike GROUP BY, Window Functions Preserve The Individual Rows While Adding Calculated Information.
56. What Is The Difference Between Classification And Regression?
Ans:
| Aspect | Classification | Regression |
|---|---|---|
| Purpose | Predicts Discrete Categories Or Classes | Predicts Continuous Numerical Values |
| Output | Labels Such As Yes/No, Fraud/Genuine | Values Such As Price, Salary, Or Sales |
| Example | Email Spam Detection Or Customer Churn Prediction | House Price Or Revenue Forecasting |
| Evaluation Metrics | Accuracy, Precision, Recall, F1-Score | MAE, MSE, RMSE, R-Squared |
57. What Is Pandas?
Ans:
Pandas Is A Python Library Designed For Data Manipulation And Analysis. Its Main Data Structures Include Series And DataFrame, Which Allow Data Scientists To Work With Tabular And Time-Series Data Efficiently. Pandas Provides Functions For Filtering, Sorting, Grouping, Joining, Reshaping, Aggregating, And Cleaning Data. It Can Read Data From Formats Such As CSV, Excel, JSON, And SQL Sources. Pandas Is Frequently Used During Data Cleaning And Exploratory Data Analysis. It Works Well With Other Python Libraries Such As NumPy, Matplotlib, Seaborn, And Scikit-Learn.
58. What Is NumPy?
Ans:
NumPy Is A Python Library Used For Numerical Computing And Efficient Array-Based Operations. Its Main Data Structure Is The Multidimensional NumPy Array, Which Supports Fast Mathematical And Statistical Operations. NumPy Provides Functions For Linear Algebra, Random Number Generation, Mathematical Computation, And Array Manipulation. Many Data Science Libraries Use NumPy Internally To perform Numerical Operations Efficiently. It Can Often Perform Array Calculations Faster Than Traditional Python Loops. NumPy Forms A Fundamental Part Of The Python Data Science Ecosystem And Works Closely With Pandas And Machine Learning Libraries.
59. What Is Matplotlib?
Ans:
- Matplotlib Is A Python Visualization Library Used To Create Charts And Graphs For Data Analysis. It Supports Visualizations Such As Line Charts, Bar Charts, Histograms, Scatter Plots, Box Plots, And Pie Charts.
- Data Scientists Use Matplotlib To Explore Data Distributions, Trends, Relationships, And Model Results. It Provides Detailed Control Over Figure Size, Labels, Axes, Titles, And Annotations. Matplotlib Can Be Combined With Pandas And Other Visualization Libraries.
- Effective Visualization Helps Convert Complex Data Into Understandable Patterns And Supports Better Analytical Decisions.
60. What Is Seaborn?
Ans:
- Seaborn Is A Python Data Visualization Library Built On Top Of Matplotlib. It Provides High-Level Functions For Creating Statistical Graphics With Less Code.
- Common Seaborn Visualizations Include Heatmaps, Pair Plots, Box Plots, Violin Plots, Histograms, And Regression Plots.
- It Is Particularly Useful During Exploratory Data Analysis Because It Makes Relationships And Distributions Easier To Visualize.

Learn Data Science Course with Advanced Concepts By Industry Experts
- Instructor-led Sessions
- Real-life Case Studies
- Assignments
61. What Is Scikit-Learn?
Ans:
Scikit-Learn Is A Popular Python Machine Learning Library Used For Classical Machine Learning And Data Preprocessing. It Provides Algorithms For Classification, Regression, Clustering, Dimensionality Reduction, And Model Selection. It Also Includes Tools For Scaling, Encoding, Feature Selection, Cross-Validation, And Hyperparameter Tuning. Common Models Available In Scikit-Learn Include Linear Regression, Logistic Regression, Decision Trees, Random Forest, SVM, K-Means, And Gradient Boosting. Its Consistent API Makes It Convenient To Build Reproducible Machine Learning Workflows. Scikit-Learn Is Widely Used For Prototyping And Production-Oriented Machine Learning Development..
62. What Is Deep Learning?
Ans:
Deep Learning Is A Subfield Of Machine Learning That Uses Neural Networks With Multiple Layers To Learn Complex Patterns From Data. Deep Learning Models Can Automatically Learn Representations From Raw Inputs With Less Manual Feature Engineering In Many Applications. Common Architectures Include Convolutional Neural Networks, Recurrent Neural Networks, Transformers, And Multilayer Perceptrons. Deep Learning Is Widely Used In Computer Vision, Natural Language Processing, Speech Recognition, Recommendation Systems, And Generative AI. Training Often Requires Significant Computational Resources And Large Datasets. Frameworks Such As TensorFlow And PyTorch Are Commonly Used For Deep Learning Development.
63. What Is A Neural Network?
Ans:
A Neural Network Is A Machine Learning Model Composed Of Connected Computational Units Called Neurons. These Neurons Are Organized Into Input, Hidden, And Output Layers. Each Connection Has A Weight, And Activation Functions Introduce Nonlinearity Into The Model. During Training, The Network Adjusts Its Weights To Reduce A Defined Loss Function. Backpropagation And Optimization Algorithms Such As Gradient Descent Are Commonly Used For Training. Neural Networks Can Learn Complex Nonlinear Relationships And Are Widely Used In Image Recognition, Text Processing, Forecasting, And Classification.
64. What Is A CNN?
Ans:
A Convolutional Neural Network Is A Deep Learning Architecture Commonly Used For Processing Image And Spatial Data. CNNs Use Convolutional Layers To Automatically Learn Local Features Such As Edges, Shapes, And Textures. Pooling Layers Can Reduce Spatial Dimensions And Computational Requirements. Deeper Layers Learn More Complex Representations From Features Detected In Earlier Layers. CNNs Are Widely Used For Image Classification, Object Detection, Facial Recognition, And Medical Image Analysis. Their Ability To Learn Hierarchical Spatial Features Makes Them Effective For Many Computer Vision Applications.
65. What Is An RNN?
Ans:
- A Recurrent Neural Network Is A Neural Network Architecture Designed For Sequential Or Time-Dependent Data. RNNs Maintain A Hidden State That Allows Information From Earlier Time Steps To Influence Later Predictions.
- They Have Been Used For Applications Such As Text Processing, Time-Series Forecasting, Speech Recognition, And Sequence Classification.
- Traditional RNNs Can Experience Vanishing Or Exploding Gradient Problems During Training. Architectures Such As LSTM And GRU Were Developed To Better Capture Long-Term Dependencies
66. What Is NLP?
Ans:
Natural Language Processing Is A Field Of Artificial Intelligence Focused On Enabling Computers To Understand, Process, Analyze, And Generate Human Language. NLP Techniques Can Be Used For Text Classification, Sentiment Analysis, Named Entity Recognition, Machine Translation, Question Answering, And Summarization. Traditional Approaches Include Tokenization, Stop-Word Removal, Stemming, Lemmatization, And TF-IDF. Modern NLP Frequently Uses Transformer-Based Models And Embeddings To Capture Contextual Meaning. Data Scientists Apply NLP To Customer Reviews, Chat Logs, Documents, Emails, And Social Media Data. Effective NLP Systems Depend On High-Quality Text Processing And Appropriate Evaluation Methods.
67. What Is Tokenization?
Ans:
Tokenization Is The Process Of Breaking Text Into Smaller Units Called Tokens. Depending On The NLP Task, Tokens Can Represent Words, Subwords, Characters, Or Sentences. Tokenization Converts Unstructured Text Into A Form That Machine Learning Models Can Process. Traditional NLP Pipelines Often Tokenize Text Into Words Or Sentences. Modern Transformer Models Commonly Use Subword Tokenization To Handle Large Vocabularies And Unseen Words. Proper Tokenization Is Important Because It Influences Vocabulary Size, Computational Cost, And The Model’s Understanding Of Text.
68. What Is TF-IDF?
Ans:
TF-IDF Stands For Term Frequency-Inverse Document Frequency And Is A Technique Used To Represent Text Numerically. Term Frequency Measures How Frequently A Word Appears Within A Document. Inverse Document Frequency Reduces The Importance Of Words That Appear Frequently Across Many Documents. Multiplying These Components Produces A Weight That Reflects The Importance Of A Term To A Particular Document. TF-IDF Is Commonly Used For Document Classification, Information Retrieval, Search, And Text Similarity. Although Modern NLP Often Uses Embeddings, TF-IDF Remains A Useful And Interpretable Baseline Technique.
69. What Are Word Embeddings?
Ans:
Word Embeddings Are Numerical Vector Representations Of Words That Capture Aspects Of Their Meaning And Relationships. Words With Similar Contexts Tend To Have Similar Vector Representations In Many Embedding Methods. Traditional Approaches Include Word2Vec, GloVe, And FastText. Modern NLP Models Often Produce Contextual Embeddings Where The Representation Of A Word Can Change Based On Its Surrounding Text. Embeddings Can Be Used For Similarity Search, Classification, Recommendation, Clustering, And Natural Language Applications. They Convert Textual Information Into Numerical Features That Machine Learning Models Can Process.
70. What Is Time Series Analysis?
Ans:
- Time Series Analysis Is The Study Of Data Collected Sequentially Over Time. It Focuses On Understanding Components Such As Trend, Seasonality, Cycles, And Random Variation.
- Common Applications Include Sales Forecasting, Demand Prediction, Stock Analysis, Traffic Forecasting, And Resource Planning. Traditional Methods Include Moving Averages, Exponential Smoothing, ARIMA, And Seasonal Models.
- Modern Approaches May Use Gradient Boosting, Recurrent Neural Networks, Or Transformer-Based Models. Time-Based Data Requires Special Validation Strategies Because Randomly Shuffling Observations Can Cause Future Information To Leak Into Training.
71. What Is ARIMA?
Ans:
ARIMA Stands For AutoRegressive Integrated Moving Average And Is A Statistical Model Used For Time Series Forecasting. The Model Uses Past Observations, Differencing, And Past Forecast Errors To Represent Time-Dependent Patterns. Its Main Parameters Are Commonly Represented As P, D, And Q. P Controls The Autoregressive Component, D Represents Differencing, And Q Represents The Moving Average Component. Seasonal Extensions Such As SARIMA Can Handle Repeating Seasonal Patterns. ARIMA Works Best When Its Assumptions And Time-Series Characteristics Are Properly Analyzed Before Modeling.
72. What Is A/B Testing?
Ans:
A/B Testing Is An Experimental Method Used To Compare Two Versions Of A Product, Feature, Website, Or Business Process. Users Are Typically Divided Into Groups That Receive Different Variants Under Controlled Conditions. A Defined Metric Is Then Compared Between The Groups To Determine Whether The Change Produces A Meaningful Effect. Statistical Significance And Practical Business Impact Should Both Be Considered When Interpreting Results. Proper Randomization Helps Reduce Selection Bias Between Groups. A/B Testing Is Commonly Used For Website Optimization, Marketing Campaigns, Product Features, And User Experience Decisions.
73. What Is Hypothesis Testing?
Ans:
Hypothesis Testing Is A Statistical Method Used To Determine Whether There Is Sufficient Evidence To Support A Claim About A Population. It Typically Starts With A Null Hypothesis And An Alternative Hypothesis. Sample Data Is Used To Calculate A Test Statistic And A P-Value Or Compare It Against A Critical Value. A Significance Level Such As 0.05 May Be Used As A Decision Threshold. Rejecting The Null Hypothesis Does Not Prove The Alternative With Absolute Certainty; It Indicates That The Observed Evidence Is Unlikely Under The Null Assumption. The Test Selection Should Depend On The Data Type, Distribution, Sample Size, And Research Question.
74. What Is A P-Value?
Ans:
A P-Value Represents The Probability Of Observing Results At Least As Extreme As Those Obtained, Assuming The Null Hypothesis Is True. A Small P-Value Can Provide Evidence Against The Null Hypothesis Under The Chosen Statistical Test. A Common Significance Level Is 0.05, Although The Appropriate Threshold Depends On The Context. A P-Value Does Not Measure The Probability That The Null Hypothesis Is True. It Also Does Not Directly Measure The Practical Importance Of A Result. Statistical Significance Should Therefore Be Considered Alongside Effect Size, Confidence Intervals, And Business Relevance.
75. What Is A Confidence Interval?
Ans:
A Confidence Interval Provides A Range Of Values Used To Estimate An Unknown Population Parameter Based On Sample Data. A 95 Percent Confidence Interval Is Commonly Used In Statistical Analysis. The Interval Reflects Sampling Uncertainty And Provides More Information Than A Single Point Estimate. Wider Intervals Generally Indicate Greater Uncertainty, While Narrower Intervals Suggest More Precise Estimates. Confidence Intervals Can Be Used For Means, Proportions, Regression Coefficients, And Other Statistical Parameters. Their Interpretation Must Be Based On The Statistical Procedure And Assumptions Used To Construct Them.
76. What Is Sampling?
Ans:
- Sampling Is The Process Of Selecting A Subset Of Observations From A Larger Population For Analysis. It Is Often Used When Collecting Or Processing The Entire Population Is Expensive, Time-Consuming, Or Impractical.
- Common Sampling Methods Include Random Sampling, Stratified Sampling, Systematic Sampling, Cluster Sampling, And Convenience Sampling.
- A Good Sampling Strategy Should Represent The Population Relevant To The Business Question.
77. What Is Statistical Significance?
Ans:
Statistical Significance Indicates Whether An Observed Result Is Unlikely To Have Occurred By Random Variation Under A Specified Null Hypothesis. It Is Often Evaluated Using A P-Value Compared With A Predefined Significance Level. Statistical Significance Does Not Automatically Mean That The Result Is Practically Important Or Valuable To The Business. A Very Large Dataset Can Produce Statistically Significant Results For Very Small Effects. Therefore, Effect Size, Confidence Intervals, Business Impact, And Experimental Design Should Also Be Considered. Proper Interpretation Helps Prevent Misleading Conclusions From Statistical Tests.
78. What Is Data Visualization?
Ans:
Data Visualization Is The Process Of Representing Data Graphically To Make Patterns, Trends, Relationships, And Outliers Easier To Understand. Common Visualizations Include Bar Charts, Line Charts, Scatter Plots, Histograms, Box Plots, Heatmaps, And Dashboards. The Choice Of Visualization Should Depend On The Data Type And Analytical Objective. Effective Visualization Can Help Data Scientists Communicate Complex Findings To Both Technical And Non-Technical Stakeholders. Poor Visualization Can Create Confusion Or Misinterpretation Even When The Underlying Data Is Correct. Clear Labels, Appropriate Scales, And Relevant Context Are Important For Effective Data Communication.
79. What Is Tableau?
Ans:
Tableau Is A Business Intelligence And Data Visualization Platform Used To Explore Data And Build Interactive Dashboards. It Can Connect To Various Data Sources Including Databases, Files, Cloud Platforms, And Data Warehouses. Users Can Create Charts, Filters, Calculated Fields, Dashboards, And Reports Without Writing Extensive Code. Tableau Is Often Used To Communicate Analytical Results To Business Stakeholders. Data Scientists May Use It Alongside Python And SQL To Present Model Results And Business Insights. Effective Tableau Dashboards Should Focus On Relevant Metrics, Clear Visual Design, And Actionable Insights.
80. What Is Power BI?
Ans:
Power BI Is A Business Intelligence And Analytics Platform Used To Connect, Transform, Visualize, And Share Data. It Supports Data Sources Such As Databases, Files, Cloud Services, And Business Applications. Power BI Provides Interactive Reports, Dashboards, Data Models, And Calculated Measures Using DAX. Data Scientists Can Use Power BI To Present Analytical Results And Model Outputs To Business Users. It Can Complement Python, SQL, And Machine Learning Workflows. Effective Power BI Solutions Require Good Data Modeling, Appropriate Visualizations, Reliable Data Refresh, And Clear Business Metrics.
81. What Is Big Data?
Ans:
- Big Data Refers To Datasets That Are Too Large, Fast, Diverse, Or Complex To Be Easily Managed Using Traditional Data Processing Approaches. Big Data Is Commonly Described Using Characteristics Such As Volume, Velocity, Variety, Veracity, And Value.
- Organizations Generate Big Data From Transactions, Sensors, Applications, Social Media, Logs, And Connected Devices.
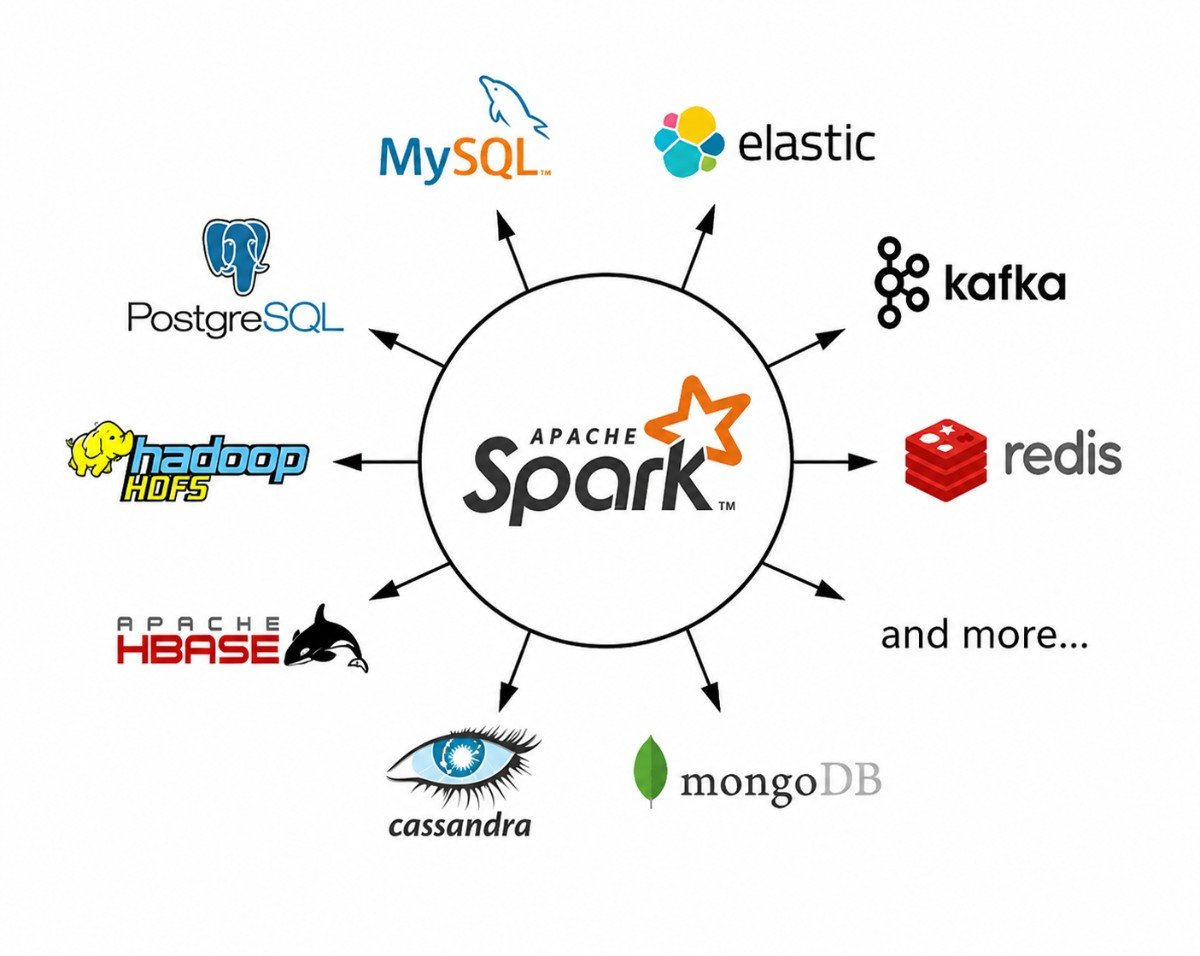
- Technologies Such As Hadoop, Spark, Kafka, Cloud Data Lakes, And Distributed Databases Help Process Large Datasets.
82. What Is Apache Spark?
Ans:
Apache Spark Is A Distributed Data Processing Framework Designed For Large-Scale Data Processing And Analytics. It Provides APIs For Python, Scala, Java, And SQL, Making It Accessible To Data Engineers And Data Scientists. Spark Can Perform Batch Processing, Streaming, Machine Learning, Graph Processing, And SQL Analytics. Its In-Memory Processing Capabilities Can Improve Performance For Certain Workloads Compared With Traditional Disk-Based Processing. PySpark Allows Python Users To Work With Spark’s Distributed Computing Features. Spark Is Commonly Used For Large-Scale Data Transformation, Feature Engineering, ETL, And Machine Learning Pipelines.
83. What Is A Data Warehouse?
Ans:
A Data Warehouse Is A Centralized System Designed To Store Structured Data For Reporting, Business Intelligence, And Analytical Processing. It Usually Integrates Data From Multiple Operational And External Sources. Data Is Cleaned, Transformed, And Organized To Support Analytical Queries And Historical Reporting. Common Data Warehouse Concepts Include Fact Tables, Dimension Tables, Schemas, ETL Or ELT Pipelines, And Data Modeling. Cloud Platforms Have Expanded Data Warehouse Capabilities With Elastic Compute And Large-Scale Storage. Data Scientists Often Query Warehouses Using SQL To Obtain Reliable Data For Analytics And Machine Learning.
84. What Is A Data Lake?
Ans:
A Data Lake Is A Storage Environment Designed To Store Large Amounts Of Raw And Processed Data In Various Formats. It Can Store Structured, Semi-Structured, And Unstructured Data Such As Tables, JSON, Logs, Images, And Documents. Unlike Traditional Warehouses, Data Lakes Often Retain Raw Data Before Extensive Transformation. They Can Support Data Engineering, Machine Learning, Analytics, And Advanced Processing Workloads. Governance, Metadata Management, Security, And Data Quality Are Important To Prevent A Data Lake From Becoming Difficult To Manage. Cloud Object Storage Is Commonly Used As The Foundation For Modern Data Lakes..
85. Write A Python Program To Find The Second Largest Number In A Lis
Ans:
The Program Removes Duplicate Values Using set() And Converts The Result Back Into A List. The sort() Function Arranges The Numbers In Ascending Order. The Second Largest Number Is Obtained Using The [-2] Index
- numbers = [10, 25, 8, 45, 30, 45]
- unique_numbers = list(set(numbers))
- unique_numbers.sort()
- print(“Second Largest Number:”, unique_numbers[-2])
86. Write A Python Program To Count The Frequency Of Each Element In A List.
Ans:
The Program Uses A Dictionary To Store The Frequency Of Each Number In The List. The get() Method Returns The Existing Count Or Zero When The Number Appears For The First Time. Each Occurrence Increases The Corresponding Count By One.
- numbers = [1, 2, 2, 3, 3, 3, 4, 4]
- frequency = {}
- for number in numbers:
- frequency[number] = frequency.get(number, 0) + 1
- print(frequency)
87. Write A Python Program To Check Whether A String Is A Palindrome.
Ans:
The Program Checks Whether The Given String Reads The Same Forward And Backward. The Slicing Expression [::-1] Reverses The String. The Original String Is Then Compared With Its Reversed Version.
- text = “madam”
- if text == text[::-1]:
- print(“Palindrome”)
- else:
- print(“Not A Palindrome”)
88. Write A Python Program To Find Missing Values In A Pandas DataFrame.
Ans:
The Program Creates A Pandas DataFrame Containing Name, Age, And Salary Columns. The isnull() Function Identifies Missing Values In The DataFrame
- import pandas as pd
- data = {
- “Name”: [“A”, “B”, “C”, “D”],
- “Age”: [25, None, 30, None],
- “Salary”: [30000, 40000, None, 50000]
- }
- df = pd.DataFrame(data)
- print(df.isnull().sum())
89. Write A SQL Query To Find The Second Highest Salary.
Ans:
The Inner Query Finds The Highest Salary From The Employees Table. The Outer Query Filters Out The Highest Salary Using The WHERE Condition.
- SELECT MAX(Salary) AS Second_Highest_Salary
- FROM Employees
- WHERE Salary < (
- SELECT MAX(Salary)
- FROM Employees
- );
90. Write A Python Program To Calculate The Mean Of A List Of Numbers
Ans:
The Program Calculates The Arithmetic Mean Of A List Of Numerical Values. The sum() Function Calculates The Total Of All Values In The List.
- numbers = [10, 20, 30, 40, 50]
- mean = sum(numbers) / len(numbers)
- print(“Mean:”, mean)