Last updated on 08th May 2025| 9488
- Introduction to Datastage
- Why Choose Datastage?
- Getting Started with Datastage
- Running and Debugging Jobs
- Key Components of Datastage
- Creating Your First Datastage Job
- Handling Errors and Troubleshooting
- Best Practices and Tips for Datastage Beginners
- Conclusion
Introduction
IBM DataStage is a powerful ETL (Extract, Transform, Load) tool that is used to integrate, transform, and process data from a variety of sources. It allows businesses to move and manipulate data from one system to another efficiently, enabling them to maintain clean, consistent, and accessible data across their platforms. With its flexible design and scalability, Datastage is widely used in large enterprises, particularly for data warehousing and business intelligence applications. DataStage is part of the IBM InfoSphere suite, offering high-performance data integration, parallel processing, and data cleansing capabilities. Business Analyst Training supports various data integration tasks, from extracting data from multiple sources to transforming it into a usable format, and finally, loading it into target systems such as data warehouses, databases, or analytics platforms. This step-by-step tutorial will guide beginners through the fundamentals of Datastage. By the end, you’ll understand how to create simple data integration jobs, process data, and troubleshoot errors.
Why Choose Datastage?
Datastage is a reliable tool that stands out in the data integration landscape for a number of reasons, Given these features, DataStage is an essential tool for businesses that require high-performance, scalable ETL operations.- Parallel Processing: Datastage supports parallel processing, allowing it to handle large datasets efficiently. This makes it ideal for enterprises dealing with massive amounts of data.
- Connectivity: Business Analytics with Excel Fundamentals provides connectivity to numerous databases and file formats, including flat files, relational databases, Hadoop, and cloud storage.
- Scalability: As organizations grow, so does the need for more complex data processing. Datastage can scale up to handle large workloads, making it suitable for both small and large enterprises.
- Graphical Interface: Its user-friendly interface allows users to design data workflows visually without needing to write complex code.
- Data Transformation: Datastage offers powerful tools for transforming raw data into clean, actionable insights, which is crucial for data warehousing, analytics, and business intelligence.
Unlock your potential in Business Analyst with this Business Analyst Training .
Getting Started with Datastage
Installing DatastageL:
- System Requirements: Ensure that your system meets the hardware and software requirements for Datastage. Typically, Datastage requires a 64-bit operating system and adequate RAM and storage capacity to process large datasets.
- Download Datastage: Obtain the IBM InfoSphere DataStage software from the official IBM website or through a licensed distributor. Ensure you download the correct version based on your operating system.
- Run the Installer: Launch the Datastage installation file. The installer will guide you through the setup process. Follow the prompts, and be sure to install any necessary components such as database connectors and other utilities.
- License Key: You’ll be prompted to Introduction to SAP- HANA a valid license key during the installation process. If you don’t have one, contact IBM or your software distributor to obtain the appropriate license.
- Complete Installation: After installation, restart your system if required, and launch Datastage from the program menu.
- Project: Datastage operates within a “project.” A project contains all your jobs, stages, and other resources. You can have multiple projects in Datastage.
- Repository: The repository stores all the metadata related to the jobs you create, including source and target definitions, transformations, and stage properties.
- Designer: The Designer interface allows you to build data jobs visually. You can drag and drop stages onto the canvas, connect them, and configure their properties.
- Parallel Jobs: Business Analyst Training jobs use parallel processing to enhance performance. They are typically used for handling large volumes of data.
- Server Jobs: These jobs run on a single server and are ideal for small datasets.
- Sequencer Jobs: These jobs automate the execution of multiple jobs in a specific sequence, enabling complex data workflows.
- Source Stages: Predictive Analytics are used to read data from various sources, such as databases (DB2, Oracle, SQL Server), flat files, and cloud storage.
- Processing Stages: These stages are used for data transformation, such as filtering, sorting, and aggregating data.
- Target Stages: These stages are used to load data into target systems or databases.
- link connects: A link connects two stages and represents the flow of data between them. Links define how data is passed from one stage to another, and they can be configured with various properties, such as data type and transformation rules. Links play a crucial role in ensuring data integrity and consistency as it moves through different stages of processing. They can also help optimize performance by controlling data flow and minimizing bottlenecks. Proper configuration of links is essential for accurate and efficient data pipeline execution.
- Open the Designer: Start by opening the Designer interface in Datastage. Navigate to the project where you want to create the job.
- Create a New Job: Select “New” to create a new job. Choose the job type (e.g., Parallel or Server Job) based on your needs.
- Add Source and Target Stages: Drag and drop the appropriate source stage (e.g., Flat File or Database) onto the ECBA vs CCBA vs CBAP. Do the same for the target stage (e.g., a database like Oracle or SQL Server).
- Link the Stages: Connect the source stage to the target stage with a link, representing the flow of data.
- Configure Stages: Double-click on each stage to configure the source and target properties. Specify file locations, database connections, or transformation logic.
- Add Transformations: Use processing stages such as Filter, Transformer, or Aggregator to perform necessary data transformations between the source and target stages.
- Validate and Compile: Once the job is designed, validate the job to ensure there are no errors. Then, compile the job to make it ready for execution.
- Check the Logs: Always review the job logs to understand what went wrong. Logs provide step-by-step details of job execution and pinpoint where failures occurred.
- Validate Data Types: Ensure that data types are consistent across stages. Mismatched data types can cause errors during transformation or loading.
- File Permissions: Ensure that the required files and databases are accessible and that permissions are correctly set.
- Handle Missing Data: Use the Null Handling features in Datastage to manage missing or invalid data gracefully
- Start with Simple Jobs: Begin with simple data integration tasks and gradually add complexity as you get more comfortable with the tool.
- Use Naming Conventions: Maintain clear naming conventions for jobs, stages, and variables to make it easier to understand and maintain your ETL processes.
- Optimize Jobs for Performance: Avoid unnecessary transformations and use parallel processing where possible to speed up data processing.
- Version Control: Use version control systems to manage changes in your Datastage jobs, especially in a team environment.
- Regular Testing: Continuously test jobs during development to ensure they perform as expected and handle edge cases.
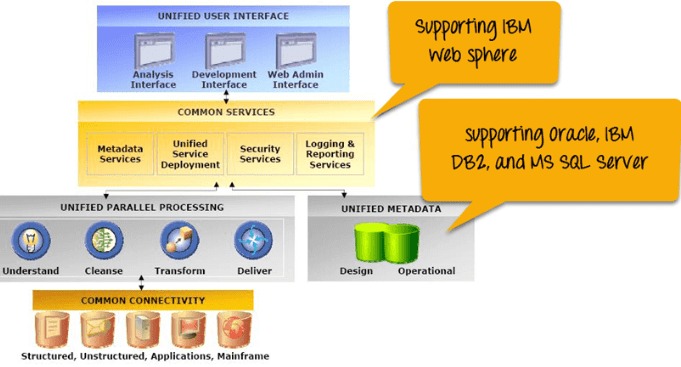
Understanding the Datastage Interface
The core of DataStage revolves around designing ETL jobs, so let’s now move on to key components involved in creating and designing jobs.
Start your journey in Business Analyst by enrolling in this Business Analyst Training .
Running and Debugging Jobs
Once your job is designed and compiled, you can run it from the Datastage Director or directly within the Designer interface. Here’s how: Run the Job From the Designer, click the “Run” button to execute the Upgraded Version of Tableau. You can monitor the job’s progress in real-time. Check the Log Datastage provides detailed logs that show the execution flow and any errors encountered during the job run. Debugging If the job fails, use the debugger to identify where the issue occurred. Common errors include missing or incorrect file paths, database connection issues, or transformation mistakes.

Key Components of Datastage
Jobs: A job in Datastage refers to a specific data integration process or workflow. Jobs are created and managed through the Designer interface. There are three primary types of jobs in Datastage:
Stages: A stage is a building block of a Datastage job. Each stage performs a specific function, such as extracting data from a source, transforming data, or loading it into a target system. Datastage provides a wide range of pre-built stages, such as:
Links:
Aspiring to lead in Business Analyst? Enroll in ACTE’s Business Intelligence Master Program Training Course and start your path to success!
Creating Your First Datastage Job
Job Design and Development through creating your first simple job in Datastage, which extracts data from a flat file, performs a basic transformation, and loads it into a target database.
Preparing for Business Analyst interviews? Visit our blog for the best Business Analyst Interview Questions and Answers!
Handling Errors and Troubleshooting
DataStage provides robust tools for handling errors, Tableau vs Looker detailed logging and debugging options. Here are a few tips for troubleshooting common issues:
Best Practices and Tips for Datastage Beginners
To become proficient in Datastage and optimize your workflows, here are some best practices:
Conclusion
In this Datastage tutorial for beginners, we’ve covered the fundamental concepts, tools, and techniques you need to get started with Business Analyst Training powerful ETL tool. From installation to creating and running jobs, Datastage simplifies the complex process of data integration and transformation. By following this guide, you should now have a solid understanding of how to use Datastage for efficient data processing and decision-making.