Last updated on 07th May 2025| 8863
- Introduction
- What is QlikView?
- What is Tableau?
- Cost and Licensing
- Key Differences Between QlikView and Tableau
- Performance and Scalability
- Use Cases and Applications
- Conclusion: Which Tool Should You Choose?
Introduction
Business Intelligence (BI) tools are at the heart of modern data analysis, enabling organizations to make informed decisions based on actionable insights from their data. Among the most popular BI solutions are QlikView and Tableau, which offer potent data visualization, reporting, and analysis features. However, while both tools are used to make sense of complex data, they fundamentally differ in their approaches, capabilities, and target audiences. Business Analyst Training article will compare QlikView and Tableau across key aspects such as architecture, ease of use, data handling capabilities, visualizations, integrations, cost, scalability, and more. By the end of this article, you will clearly understand which BI tool reigns supreme for your organization’s needs.
What is QlikView?
QlikView, developed by Qlik, is a powerful and established Business Intelligence platform that provides interactive data visualization, analytics, and reporting. Known for its associative model, QlikView allows users to explore data freely and make associations across various datasets without limitations. It enables users to create highly customizable dashboards and reports. Lean Management with Role and Concepts of Lean Management primarily targets enterprise environments and is ideal for users who need complete control over their data models and visualizations. The platform has been around since 1993, making it one of the pioneers in the BI space. Its in-memory data processing allows users to handle large datasets and provides rapid querying and analysis.
Key Features of QlikView:
- Associative Data Model: QlikView’s associative engine allows users to explore data by making dynamic connections between datasets.
- In-Memory Analytics: Provides fast data processing by loading entire datasets into memory.
- Customizable Dashboards: Users can design fully customizable dashboards and reports.
- ETL Integration: Extracts, transforms, and loads (ETL) data from various sources.
Learn the fundamentals of Business Analyst with this Business Analyst Training .
What is Tableau?
Tableau, developed by Tableau Software, is another widely used Business Intelligence platform known for its powerful data visualization capabilities and intuitive user interface. BI solutions allows users to connect to a wide range of data sources and create interactive visualizations and dashboards with minimal effort. Tableau is often seen as one of the most user-friendly BI tools, suitable for both technical and non-technical users. Slowly Changing Dimensions and Its Types drag-and-drop functionality and responsive design have helped it become a go-to choice for organizations looking to generate insights from their data quickly.
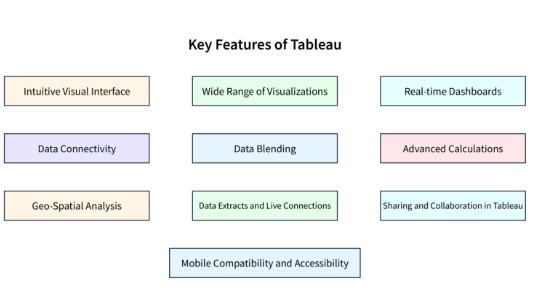
Key Features of Tableau:
- Drag-and-Drop Interface: Makes data visualization easy even for non-technical users.
- Interactive Dashboards: Allows users to create dynamic, real-time dashboards.
- Data Connectivity: Offers a broad range of connectors to cloud services, databases, and other data sources.
- Advanced Visualizations: Provides sophisticated chart types such as heatmaps, geographic maps, and treemaps.
Dive into Business Analyst by enrolling in this Business Analyst Training today.
Cost and Licensing
When it comes to cost and licensing, both QlikView and Tableau offer flexible options depending on the organization’s size and needs.
- QlikView: QlikView typically follows a per-user or per-server licensing model. It is often more expensive, especially for larger deployments, requiring a dedicated infrastructure.
- Tableau: Tableau offers a more affordable pricing structure, with various options like Tableau Desktop, Tableau Server, and Tableau Online. Business Analyst Training also provides subscription-based pricing, which is more cost-effective for smaller organizations.
- Verdict: Tableau generally offers more affordable and flexible pricing options, especially for smaller teams and organizations.

Key Differences Between QlikView and Tableau
Now that we have a basic understanding of QlikView and Tableau let’s explore how these platforms compare in several key areas.
Architecture:
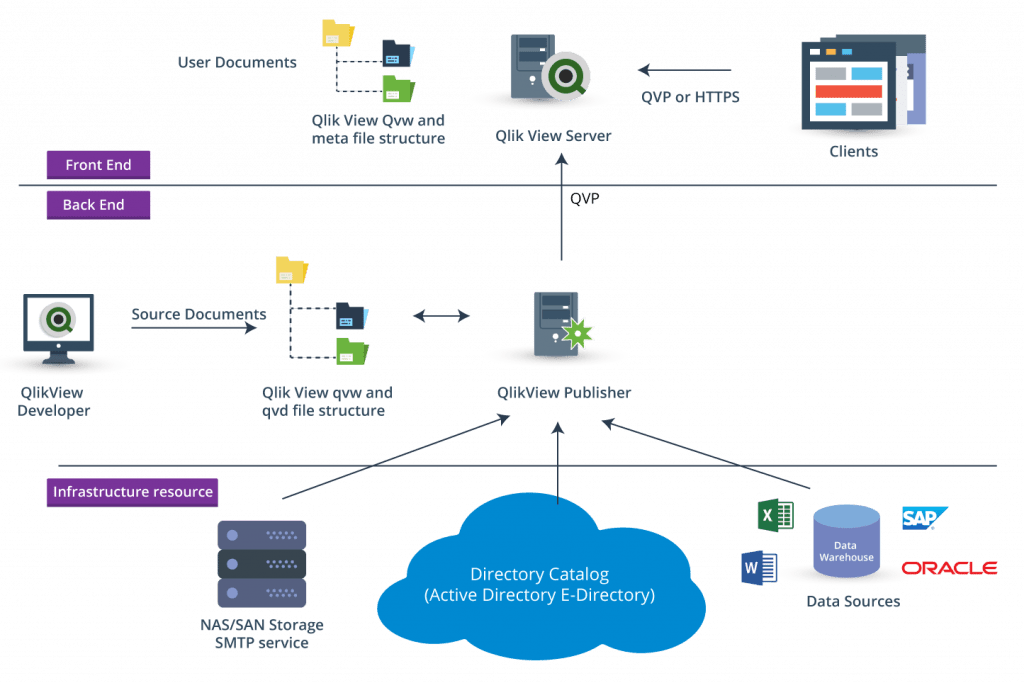
- QlikView Architecture: QlikView is based on a client-server architecture where the data resides on a server, and the client interacts with the server to retrieve data and generate reports. It uses an in-memory engine that allows for fast data processing and querying.
- Tableau Architecture: Tableau can be deployed on-premises and in the cloud, offering a more flexible architecture. Depending on the setup, Tableau’s data processing is often done through live connections or via data extracts. Tableau is highly cloud-oriented, with several features built to support cloud environments.
- Verdict: QlikView is better suited for large-scale, on-premises deployments, while Tableau offers more flexibility for cloud-based implementations.
- QlikView: While QlikView is powerful, LookML Projects and Developer Mode has a steeper learning curve, particularly for users unfamiliar with BI tools. Its user interface can be overwhelming for beginners, and setting up data models and custom visualizations requires more technical expertise.
- Tableau: Tableau is known for its intuitive drag-and-drop interface. Even non-technical users can quickly create reports and dashboards without requiring a background in data modeling, which has been one of the key reasons for its widespread adoption.
- Verdict: Tableau is generally easier to use, especially for non-technical users, while QlikView requires more specialized knowledge.
- QlikView: Due to its in-memory data processing, QlikView handles large volumes of data efficiently. It also uses its associative data model to allow users to explore data freely and make connections between disparate datasets.
- Tableau: Tableau allows users to connect to various data sources through live connections or extracts. While it can handle big data, it often requires optimized data sources and extracts for better performance, especially when dealing with massive datasets.
- Verdict: QlikView is superior for handling large datasets and providing flexible data exploration. Meanwhile, Basic Quality Improvement Ishikawa Tools excels in handling real-time connections and offering smoother user interactions with its data visualizations.
- QlikView: QlikView offers a high degree of customization in visualizations, allowing users to build highly tailored reports and dashboards. However, creating sophisticated visualizations may require more time and expertise.
- Tableau: Tableau excels at creating beautiful and interactive visualizations. Its wide variety of built-in charts, geospatial maps, and advanced visualization options make it a leader in this area. Users can create interactive dashboards that provide immediate insights from the data.
- Verdict: Tableau is often considered the superior choice for visualizations and interactive dashboards, thanks to its pre-built templates and rich visual options.
- QlikView: QlikView provides integration with a wide range of What is Power BI and Its Applications , including SQL databases, flat files, cloud services, and other enterprise systems. However, integration with modern cloud platforms might require more manual effort.
- Tableau: Tableau is highly compatible with many data sources, including cloud-based platforms such as Google BigQuery, AWS, and Salesforce. It also offers native support for modern big data technologies such as Hadoop, Spark, and NoSQL databases.
- Verdict: Tableau has an edge in modern data integration, particularly with cloud-based platforms and significant data sources.
Ease of Use:
Data Handling Capabilities:
Visualizations and Dashboards:
Integration and Compatibility:
Take charge of your Business Analyst career by enrolling in ACTE’s Business Intelligence Master Program Training Course today!
Performance and Scalability
- QlikView: QlikView offers high performance through its in-memory processing, allowing lightning-fast queries even with large datasets. However, scaling QlikView to accommodate massive datasets might require robust hardware.
- Tableau: Tableau’s performance largely depends on the underlying data architecture, such as data extracts or live connections. While it can handle large datasets, its performance can be slower than QlikView when processing massive amounts of data modeling in real time.
- Verdict: QlikView excels in performance and scalability, particularly for large enterprise deployments with complex data exploration needs.
Want to ace your Business Analyst interview? Read our blog on Business Analyst Interview Questions and Answers now!
Use Cases and Applications
- QlikView: QlikView is best suited for organizations that require advanced data modeling, customized reporting, and enterprise-scale BI solutions. It is ideal for businesses with complex data structures that need deep analytics and custom visualizations. It also excels in guided analytics environments where centralized control over data models is essential. QlikView’s associative data engine enables users to explore data relationships quickly, revealing insights that might be missed with traditional query-based tools.
- Tableau: Tableau is perfect for organizations prioritizing self-service analytics, data exploration, and interactive dashboards. Complete List of SAP Modules user-friendly interface and BI solutions allow users to rapidly generate insights, making it a popular choice across various industries. It is especially effective for real-time data visualization and storytelling through dashboards. Tableau’s wide range of integration options with cloud and on-premises data sources enhances its flexibility and usability for diverse business needs.
- Verdict: QlikView is better suited for complex, enterprise-level applications, while Tableau is ideal for businesses looking for an intuitive, interactive, and visual data analysis experience.
Conclusion: Which Tool Should You Choose?
Both QlikView and Tableau are excellent BI tools, but they to different needs: Choose QlikView if:
- You need advanced data modeling and highly customized reports.
- You work with complex, large datasets that require robust in-memory processing.v
- You have a technical team capable of handling its steeper learning curve. Choose Tableau if:
- You prioritize ease of use and need to generate interactive Business Analyst Training and dashboards quickly.
- You require seamless integration with cloud-based data sources.
- You are looking for a more cost-effective and user-friendly solution for business users.
Ultimately, the choice between QlikView and Tableau depends on your organization’s specific needs. QlikView may be the best fit if deep customization and data exploration are essential. However, if you are looking for an intuitive tool with excellent visualization capabilities and ease of use, Tableau might reign supreme for your business.