
Last updated on 04th Jul 2025| 9795
- Introduction to Data Types
- Definition of Ordinal Data
- Characteristics of Ordinal Data
- Examples in Real Life
- Comparison with Nominal Data
- Scales and Measurements
- Statistical Methods
- Visualization Techniques
- Pros and Cons
- Common Use Cases
- Misinterpretations to Avoid
- Importance in Data Analysis
- Conclusion
Introduction to Data Types
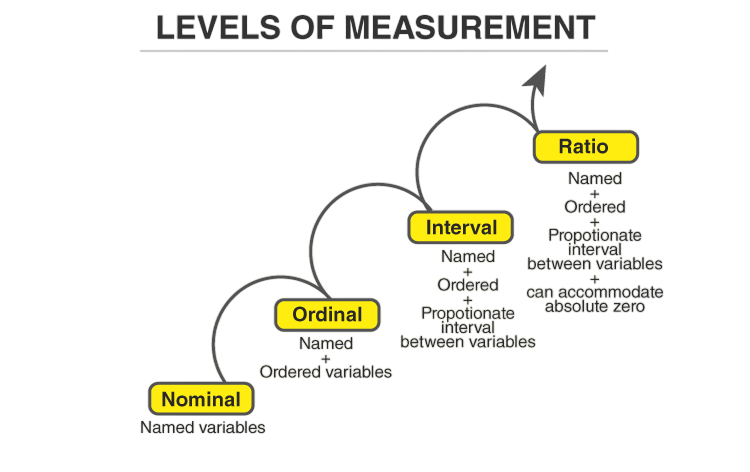
What is Ordinal Data? Data is the foundation of any research, analysis, or system-driven decision-making. It comes in various forms and is categorized based on how it can be measured and interpreted. Broadly, data is classified into four main types: nominal, ordinal, interval, and ratio. Each of these types has specific characteristics that determine how it can be analyzed and used. Understanding what is ordinal data is essential for applying appropriate analytical techniques. Ordinal data is one of the most frequently encountered types in surveys, social sciences, market research, and health sciences. It provides a way to rank-order items or variables, giving analysts and researchers insights into preferences, attitudes, and perceptions.
Are You Interested in Learning More About Web Developer Certification? Sign Up For Our Web Developer Certification Courses Today!
Definition of Ordinal Data
Ordinal data is a type of categorical data with a meaningful order or ranking among the categories. Unlike nominal data, which merely categorizes items without any implied order, ordinal data suggests a relative position of items. For example, if a survey asks respondents to rate their satisfaction as “Very Unsatisfied,” “Unsatisfied,” “Neutral,” “Satisfied,” and “Very Satisfied,” these responses represent ordinal data. While you know that “Very Satisfied” is better than “neutral”, the exact magnitude of the difference is not quantifiable. Ordinal data does not allow for precise mathematical operations like addition or subtraction because the intervals between values are not uniformly defined. It is more qualitative in nature but with an intrinsic ranking.

Characteristics of Ordinal Data
- Order Matters: The primary feature of ordinal data is that the order of values is significant.
- No Standard Interval: The distance between two categories is unknown or unequal.
- Non-numeric Labels: Ordinal data can be represented by words (e.g., poor, fair, good) or numbers (e.g., 1, 2, 3), but the numbers merely denote order.
- Limited Mathematical Operations: Median and mode can be computed, but not mean or standard deviation.
- Categorical Yet Ranked: While it is a categorical type, ordinal data implies a hierarchy.
- Education Levels: High School, Bachelor’s, Master’s, PhD.
- Customer Satisfaction: Very Unsatisfied to Very Satisfied.
- Socioeconomic Status: Lower class, middle class, upper class.
- Military Ranks: Private, Corporal, Sergeant, Lieutenant.
- T-shirt Sizes: Small, Medium, Large, Extra Large.
- 5-point Likert Scale: Strongly Disagree to Strongly Agree
- Frequency Scale: Never, Rarely, Sometimes, Often, Always
- Mode (most frequent value)
- Median (middle value)
- Chi-Square Test
- Mann-Whitney U Test
- Kruskal-Wallis Test
- Spearman’s Rank Correlation
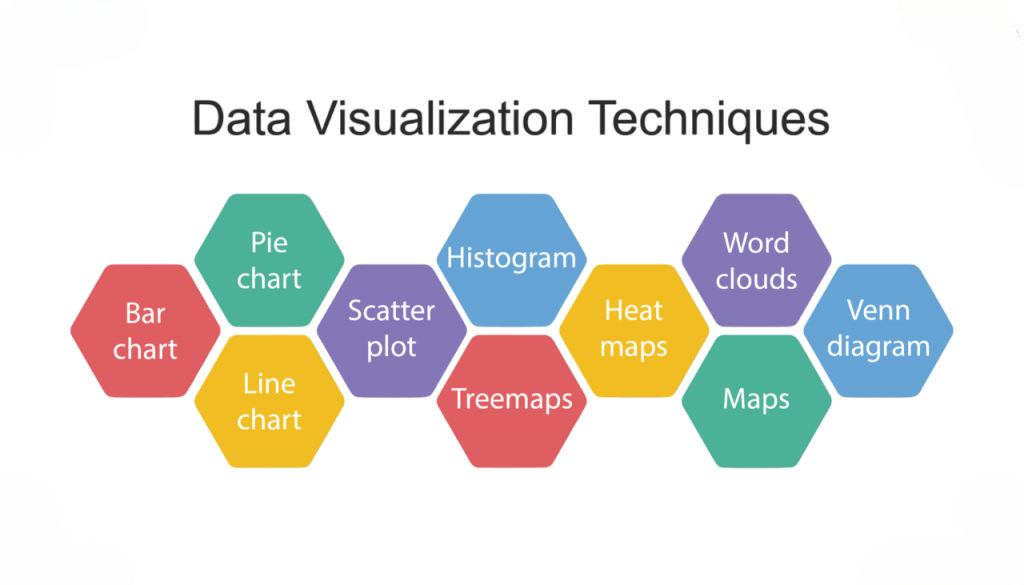
- Bar Charts: The most frequently used method, displaying categories in order.
- Stacked Bar Charts: Useful for showing distributions across groups.
- Box Plots: Occasionally used for larger ordinal datasets.
- Heat Maps: Effective in survey analysis.
- Customer Feedback Surveys: Measuring Service Quality.
- Employee Performance Reviews: Grading Competencies and Traits.
- Health Assessments: Pain levels, mobility status.
- Product Ratings: From poor to excellent.
- Psychological Research: Measuring attitudes, behaviors, or satisfaction.
- Assuming Equal Intervals: Avoid calculating means or standard deviations.
- Overuse of Parametric Tests: Use appropriate non-parametric tests instead.
- Incorrect Graphs: Avoid pie charts if the goal is to show order.
- Ambiguity in Labels: Ensure that category labels clearly indicate rank.
Excited to Obtaining Your web developer Certificate? View The web developer course Offered By ACTE Right Now!
Examples in Real Life
These examples illustrate how ordinal data is used to represent a hierarchy without assuming equal intervals between ranks.
Comparison with Nominal Data
| Feature | Nominal Data | Ordinal Data |
|---|---|---|
| Order | No | Yes |
| Interval | Not Defined | Not Defined |
| Examples | Gender, Religion | Satisfaction Level, Education |
| Analysis | Mode | Mode, Median |
Nominal data categories are purely labels with no intrinsic ranking, whereas ordinal data allows for ordered comparisons. However, both do not quantify the distance between categories.
Interested in Pursuing web developer certification Program? Enroll For Web developer course Today!
Scales and Measurements
Ordinal data is often measured using Likert scales, which present a range of responses for questions based on agreement, frequency, or importance. Common formats include:
These scales are extensively used in psychology, education, and business research. Although responses can be encoded numerically, this is only for the sake of computation, not to imply a quantifiable distance between the responses.
Statistical Methods
Given the qualitative and ordered nature of ordinal data, the statistical methods that are appropriate include:
Descriptive Statistics:
Inferential Statistics:
These non-parametric tests are suitable because they do not assume normal distribution or equal variance among groups, which aligns with the nature of ordinal data.
Visualization Techniques
Visualizing ordinal data helps communicate patterns and insights effectively. Common techniques include:
Ensure that any visual representation maintains the logical order of categories to avoid misinterpretation.
Pros and Cons
Pros: Ordinal data is easier to collect than more complex types like interval or ratio data. This is especially true when asking participants for their opinions, satisfaction levels, or preferences. It is useful for creating rankings and priorities. This allows analysts to determine the order of items based on stakeholder input. Cons: Ordinal data has limitations. It does not show how much difference there is between the ranks. You can know the order, but you cannot tell how much better one item is compared to another. Its use in statistics and mathematics is limited. This often forces analysis to rely on non-parametric methods. Additionally, if the criteria for ranking are not clearly defined, interpretation can become unclear. This can lead to inconsistent or misleading conclusions.
Common Use Cases
Ordinal data forms the backbone of many qualitative studies and is integral to data collection in both academic and commercial settings.
Misinterpretations to Avoid
Misinterpreting ordinal data can lead to incorrect conclusions and flawed decision-making, especially when treating it as interval data.
Importance in Data Analysis
Ordinal data is crucial for understanding human behavior, opinions, and preferences. It offers structure to qualitative feedback and enables better decision-making. While it lacks the precision of interval or ratio data, its ability to convey ranking and sentiment makes it indispensable in fields like education, marketing, sociology, and healthcare. Moreover, modern analytical platforms increasingly offer robust tools to analyze ordinal data more effectively, leveraging machine learning models, NLP tools, and visualization dashboards tailored for survey and opinion data.
Conclusion
What is Ordinal Data and why does it matter in analytics? Ordinal data bridges the gap between qualitative and quantitative analysis. By offering a way to rank observations while retaining categorical identity, it provides insights that are both structured and interpretable. Analysts, researchers, and decision-makers must understand the strengths and limitations of ordinal data to apply the right statistical tools and draw accurate conclusions. Whether it’s used in customer feedback, academic surveys, or health assessments, understanding what is ordinal data ensures proper application and interpretation. As data analytics evolves, the methods to analyze ordinal data are also becoming more sophisticated, enabling better and more nuanced insights into human responses and behavior.