Last updated on 28th Oct 2025| 10785
- Intro To Power BI Tool
- What is Power BI?
- Features of Power BI
- Power BI Desktop
- Power BI Service
- Power BI Mobile
- Power BI Components
- Integration with Excel
- Data Visualization with Power BI
- Power BI vs Other Tools
- Conclusion
Intro To Power BI Tool
In today’s data-driven world, organizations rely heavily on data analysis and visualization to make informed decisions. As businesses generate large volumes of data daily, the need for advanced business intelligence Power BI Tool has grown rapidly. Microsoft Power BI has emerged as one of the leading BI tools that helps enterprises transform raw data into meaningful insights. To gain the skills required to turn data into strategic decisions using Power BI, explore Business Analyst Training a hands-on program that teaches data modeling, visualization, and reporting techniques tailored for real-world business environments. It allows organizations to monitor business performance, identify patterns, and support decision-making processes in real time. Power BI’s ease of use, wide range of features, and seamless integration with Microsoft products make it one of the most popular choices for professionals, analysts, and enterprises across industries.
What is Power BI?
Power BI is a business intelligence and data visualization tool developed by Microsoft. It enables users to connect to multiple data sources, prepare datasets, and create interactive reports and dashboards. Unlike traditional Power BI Tool solutions, Power BI is user-friendly and designed for both technical and non-technical users. The platform empowers decision-makers by converting complex datasets into visually appealing charts, graphs, and dashboards that are easy to understand. To explore how Power BI’s accessibility and visualization strengths compare with enterprise-grade BI frameworks, visit MSBI vs Power BI Key Differences a detailed comparison that highlights architecture, integration, scalability, and usability across both platforms. One of Power BI’s strengths lies in its ability to integrate with diverse data sources ranging from Excel spreadsheets and SQL databases to cloud services such as Azure, Salesforce, and Google Analytics. Users can analyze data from multiple systems in a single dashboard, eliminating the need for manual reporting. This unification of data provides a holistic view of business performance and enables more accurate, data-backed decisions.
Interested in Obtaining Your Business Analyst Certificate? View The Business Analyst Training Offered By ACTE Right Now!
Features of Power BI
Power BI offers a wide range of features that make it one of the most versatile BI tools available. Some of its standout features include real-time dashboards, AI-powered insights, seamless Excel integration, and support for custom visuals. To explore how Power BI compares with other leading platforms in terms of functionality, scalability, and user experience, visit Business Intelligence Tools a curated guide that highlights top BI solutions and helps professionals choose the right tool for their analytics needs.
- Interactive Dashboards: Users can create dashboards with dynamic, interactive visualizations that update in real time.
- Customizable Reports: Reports can be tailored to specific business needs with drag-and-drop functionality and custom visuals.
- Natural Language Queries: Power BI allows users to ask questions in plain English using its Q&A feature, and it automatically generates relevant visualizations.
- AI and Machine Learning Integration: Built-in AI capabilities help detect trends, make predictions, and automate insights.
- Data Security: With Microsoft’s strong security framework, Power BI ensures secure access, data governance, and compliance.
- Cloud and On-Premises Data Access: Users can connect to on-premise databases and cloud-based services seamlessly.
- Mobile Accessibility: Dashboards can be accessed from smartphones and tablets, making insights available on the go.
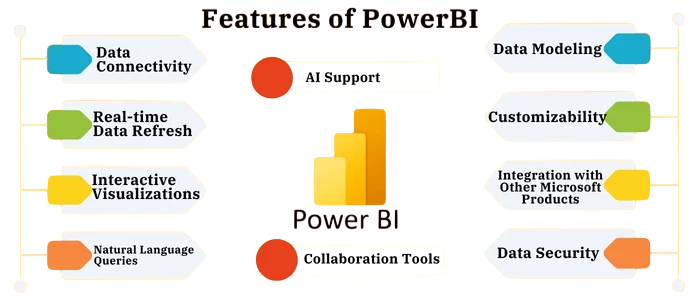
These features make Power BI not only powerful but also flexible for enterprises of all sizes.
To Earn Your Business Analyst Certification, Gain Insights From Leading Data Science Experts And Advance Your Career With ACTE’s Business Analyst Training Today!
Power BI Desktop
Power BI Desktop is a free application installed on Windows computers that allows users to build reports and data models. It is often the starting point for BI professionals and analysts who need to work with raw data before publishing reports to the Power BI Service. To understand how each component from Desktop to Service to Gateway fits into the broader ecosystem, explore Power BI Architecture Explained a structured guide that breaks down the flow of data, report lifecycle, and deployment strategies across the Power BI platform.
Key functions of Power BI Desktop include:
- Data Preparation: Cleaning and transforming data using Power Query.
- Data Modeling: Creating relationships between datasets and defining measures with DAX (Data Analysis Expressions).
- Visualization: Designing reports using various charts, tables, and custom visuals.
BI professionals prefer Power BI Desktop for its flexibility in handling complex data models and building reports offline before publishing them online for wider access.

Develop Your Skills with Business Analyst Online Training
Weekday / Weekend BatchesSee Batch DetailsPower BI Service
The Power BI Service is a cloud platform where people can share, work together on, and view reports and dashboards. Unlike Power BI Desktop, which is mostly for creating these items, the Power BI Service helps with sharing and teamwork. Companies can share dashboards with people inside and outside the company, so everyone has the info they need. The service also lets you set up automatic data updates, so reports stay current without needing someone to do it by hand. To learn how to manage data refresh cycles and collaborate through shared dashboards, explore Business Analyst Training a practical program that teaches professionals how to build, automate, and distribute insights using Power BI’s full suite of tools. Access and permissions can be set for different groups, which keeps sensitive info safe while still allowing teamwork. Real-time tools let team members work together easily, encouraging teamwork and new ideas. Also, the cloud setup of the Power BI Service means it can grow with your business, handling data for small teams or big companies. Because of all this, the Power BI Service is key for companies that want to improve their data analysis and reporting.
Want to Pursue a Business Analyst Master’s Degree? Enroll For Business Analyst Master Program Training Course Today!
Power BI Mobile
More people are working remotely and using mobile devices, Microsoft created Power BI Mobile. This app lets users view important dashboards on their phones and tablets. It works on both iOS and Android, so leaders can see real-time business data wherever they are. A main advantage of Power BI Mobile is that it lets you check business reports on the move, helping you stay up-to-date and able to react fast. To build mobile-responsive dashboards and deliver insights across devices, explore Become a Power BI Developer a step-by-step guide that teaches professionals how to design scalable reports, optimize performance, and deploy analytics solutions for dynamic business environments. The app also sends push notifications for important updates, so you don’t miss crucial info. If you don’t have internet, Power BI Mobile lets you view reports you’ve already downloaded. The app’s touch-friendly design makes it easier to work with data on smaller screens. Power BI Mobile helps organizations be more agile, allowing managers to make quick, data-driven choices even when they’re traveling.
Go Through These Business Analyst Interview Questions and Answers to Excel in Your Upcoming Interview.
Power BI Components
Power BI is not just a single tool but a collection of services and applications. Its key components include:
- Power Query: Used for data extraction, transformation, and loading (ETL).
- Power Pivot: Used for data modeling and creating relationships between datasets.
- Power View: For creating interactive reports and visualizations.
- Power Map: A 3D data visualization tool for geographic and spatial data.
- Power Q&A: Allows natural language queries for intuitive data exploration.
- Power BI Gateway: Bridges on-premises data sources with the Power BI Service for real-time access.
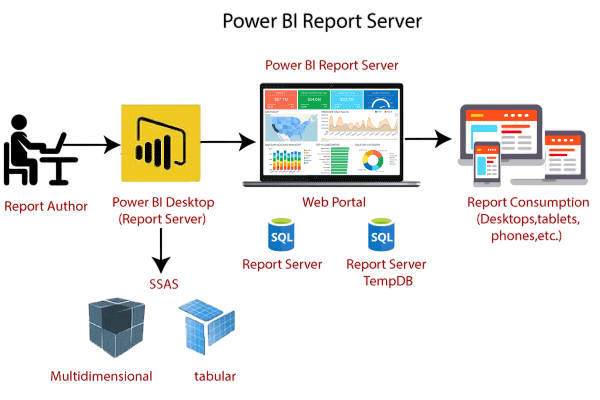
- Power BI Report Server: Enables hosting and sharing of reports on-premises for organizations that cannot move to the cloud.
Together, these components provide an end-to-end BI solution for data collection, transformation, modeling, analysis, and visualization.
Integration with Excel
Excel has been a cornerstone of data analysis for decades, and Power BI builds upon its strengths. Many businesses already rely heavily on Excel for reporting and analytics, which makes the transition to Power BI easier. Power BI integrates with Excel in the following ways: seamless data import, formula compatibility, and shared visuals. To compare how Tableau approaches these integrations differently and what advantages it offers, explore How Tableau is Better Than Power BI a strategic comparison that highlights performance, flexibility, and visualization depth across both platforms.
- Importing existing Excel reports into Power BI.
- Using Power Query and Power Pivot models built in Excel.
- Analyzing Power BI datasets directly within Excel.
- Publishing Excel workbooks as Power BI reports.
This deep integration allows organizations to leverage their existing Excel expertise while moving toward more advanced, interactive BI solutions.
Data Visualization with Power BI
One of the core strengths of Power BI is its data visualization capability. The tool provides a wide variety of built-in visualizations such as bar charts, pie charts, line graphs, scatter plots, maps, and more. Additionally, users can import custom visuals from Microsoft’s AppSource marketplace to meet specialized needs. To dive deeper into these features and understand how to build impactful reports from scratch, explore Exploring Power BI Desktop a comprehensive guide that walks through report creation, data modeling, and visualization customization using Power BI’s desktop interface.
With its drag-and-drop interface, creating professional-grade visualizations is simple even for non-technical users. Interactive filters, slicers, and drill-down features enable deeper exploration of data. For example, a sales manager can view total sales performance and then drill down into specific regions, products, or sales representatives all within the same dashboard. This interactivity transforms raw data into actionable insights, enabling businesses to identify opportunities and challenges quickly.
Power BI vs Other Tools
Power BI competes with other popular BI tools such as Tableau, QlikView, and Google Data Studio. While each tool has its strengths, Power BI stands out due to its seamless integration with Microsoft products, intuitive interface, and robust visualization capabilities. To learn how professionals leverage these strengths to deliver enterprise-grade analytics solutions, explore Power BI Consultant a career guide that outlines the skills, tools, and strategic mindset required to thrive in BI consulting roles across industries.
- Ease of Use: Its intuitive interface and integration with Microsoft products make adoption easier.
- Affordability: Power BI is significantly cheaper than many competitors, especially for small businesses.
- Integration: Deep compatibility with Excel, Azure, and Microsoft 365 provides an advantage for enterprises already in the Microsoft ecosystem.
- Community and Support: A large community of users and Microsoft’s continuous updates ensure long-term support and innovation.
While Tableau is often praised for advanced visualizations and Qlik for strong data modeling, Power BI offers the best balance between usability, cost, and enterprise features.
Conclusion
Power BI has become one of the most essential tools in the field of business intelligence and data visualization. Its wide range of features, affordability, and seamless integration with existing Microsoft products make it suitable for organizations of all sizes. Whether it is through Power BI Desktop for data preparation, Power BI Service for collaboration, or Power BI Mobile for on-the-go access, the tool provides a comprehensive ecosystem for data analysis. As businesses continue to generate more data, the demand for tools like Power BI will only grow. To build the skills needed to harness this ecosystem effectively, explore Business Analyst Training a hands-on program that teaches data modeling, visualization techniques, and strategic analytics using Power BI across desktop, service, and mobile platforms. Its ability to turn complex datasets into actionable insights helps organizations stay competitive, innovate, and build a data-driven culture. Power BI is not just a reporting tool but a powerful enabler of smarter decision-making in the modern digital era.