
Last updated on 21st Apr 2025| 9139
- What is Two Columns in Excel?
- Why Is It Useful to Compare Two Columns in Excel?
- How Do We Compare Two Columns in Excel?
- IF Condition
- Using Equal Operator
- Conditional Formatting
- VLOOKUP Function
- EXACT Function
- Conclusion
Excel is an incredibly versatile tool, used for managing, analyzing, and comparing large datasets. One of the most common tasks performed in Excel is comparing two columns of data. Whether you’re dealing with sales figures, employee records, or customer data, comparing columns helps to identify duplicates, inconsistencies, and matches. In this guide, Data Science Course Training will walk through some of the best methods to compare two columns in Excel, including both simple and advanced techniques. From basic formulas to built-in tools, these methods will help you efficiently identify common, unique, and mismatched data between two columns.
What is Two Columns in Excel?
Comparing two columns in Excel refers to the process of checking and identifying differences or similarities between the data in two separate columns. This is often done to ensure data consistency, detect errors, or perform data validation. When comparing two columns, you can determine if the values in each row of one column match the corresponding row in another column. SQL Intersect provides several tools and functions to facilitate this comparison, such as using logical formulas like IF, conditional formatting to visually highlight differences, or functions like VLOOKUP and MATCH. Comparing columns can be particularly useful in scenarios like finding duplicate values, cross-referencing data from different datasets, or validating entries in a dataset. The goal is to make it easier to spot inconsistencies and ensure the accuracy of your data analysis.
Enhance your knowledge in Data Science. Join this Data Science Online Course now.
Why Is It Useful to Compare Two Columns in Excel?
Comparing two columns in Excel is essential for several reasons:
- Identifying Duplicate or Missing Data: One of the main reasons for comparing two columns is to check if data appears in both columns. This is helpful when you need to find duplicates or missing data points between two lists or datasets.
- Data Cleansing: When cleaning data, it’s important to ensure that the records are accurate and consistent. Comparing columns helps highlight discrepancies that need to be corrected.
- Data Validation: Comparing columns can help validate information by ensuring that two datasets match as expected. For example, comparing sales data from two different systems or comparing names in different columns to Checkbox in Excel for spelling consistency.
- Analysis: In data analysis, comparing two columns might be required to find common values (e.g., customers who bought products in both 2023 and 2024), assess data trends, or evaluate performance metrics.
How Do We Compare Two Columns in Excel?
There are several ways to compare two columns in Excel. Some methods are simple and intuitive, while others are more advanced. Let’s dive into the top methods you can use to compare two columns in Excel. Whether you are comparing lists of names, numbers, dates, or other data types, Excel offers a variety of techniques that can help you identify matches, differences, or duplicates between two columns. For example, you may need to identify missing data, duplicates, or even common values between two datasets. Each method offers unique advantages depending on the nature of your data and the result you want to achieve. Some methods, like the IF condition and EXACT function, are suitable for straightforward comparisons. Others, like VLOOKUP and Conditional Formatting, offer more flexibility when working with large datasets or needing to highlight specific rows. Additionally, combining multiple techniques can improve your results. For instance, using Conditional Formatting alongside an Data Science Course Training can visually highlight mismatches while providing detailed text information. Excel’s ability to compare data efficiently makes it an indispensable tool for anyone who deals with large amounts of structured data. Let’s explore these methods further to see how you can make the most of Excel’s powerful comparison features.
Learn the fundamentals of Data Science with this Data Science Online Course .
F Condition
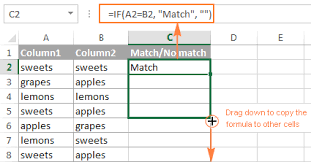
The IF function is widely used for comparing two columns in Excel as it allows you to specify conditions and perform actions based on whether those conditions are met. This method is ideal for straightforward comparisons and HLOOKUP in Excel you customize the output depending on whether the values in the two columns match. For example, if two columns have matching data, you can display “Match”; if not, display “No Match.” It is easy to understand and customize, making it an excellent tool for comparing datasets.
Why It’s Useful:
- Easy to use and understand, even for beginners.
- Customizable output that helps with reporting and analysis.
- Can handle more complex comparisons if necessary, allowing for logical tests based on different criteria.

Using Equal Operator (=)
The equal sign (=) is a simple and quick way to compare two columns in Excel. This method checks if the values in two cells are equal and returns either TRUE or FALSE. It’s effective for finding exact matches between the data in two columns and is suitable for smaller Missing Data where you need to identify direct comparisons without additional formatting or complex logic.
Why It’s Useful:
- Simple and fast for checking equality.
- Effective for small datasets and basic comparisons.
- Works well for exact matches, where only identical values should be flagged.
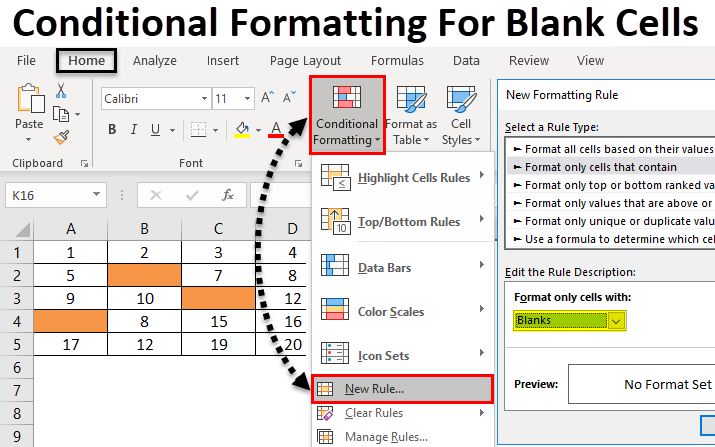
Conditional Formatting:
Conditional Formatting allows you to visually highlight differences between two columns, making it easier to spot mismatches, duplicates, or inconsistencies. By applying a rule that highlights cells in one column if Data Science Career Path differ from the corresponding cells in another column, you can instantly see where the discrepancies lie without manually scanning through rows.
Why It’s Useful:
- Provides a visual representation of differences, making mismatches easy to identify.
- Highly customizable with various formatting options like colors and font styles.
- Ideal for large datasets where scanning values manually would be inefficient.
VLOOKUP Function
The VLOOKUP function is helpful when comparing data across two different columns or datasets. This function allows you to search for a value in one column and check if it exists in another. Types of Data Visualization is especially useful when working with large tables or when you need to match values from separate lists and pull related data from other columns.
Why It’s Useful:
- Great for comparing data from different datasets or large tables.
- Efficient for cross-referencing values and retrieving additional related information.
- Useful for matching data across multiple columns in a structured table format.
EXACT Function
The EXACT function is specifically designed to Techniques for Dimension Reduction text strings in Excel, returning TRUE if the two values are identical and FALSE if they are not. This function is case-sensitive, making it ideal for comparing strings that may differ only in letter casing, such as “apple” vs. “Apple.”
Why It’s Useful:
Each of these methods provides a unique way to compare columns, from simple boolean checks to more advanced data cross-referencing and visual highlighting. Understanding when and how to apply these methods can greatly improve your efficiency when working with Excel, whether you’re cleaning data, performing audits, or simply verifying records.
Best practice for comparing two columns
Here’s a recap of the most effective methods for comparing two columns in Excel:
- IF Condition: Allows you to specify custom actions based on whether two values match.
- Equal Operator (=): A quick and simple way to check for exact matches.
- Conditional Formatting: Visually highlights differences between two columns.
- VLOOKUP: Useful for comparing data across different datasets or lists.
- EXACT: A case-sensitive method for comparing two text strings.
The method you choose will depend on your MIS Reports in Excel . For basic comparisons, the equal operator or IF function works well. For larger or more complex datasets, tools like VLOOKUP or conditional formatting offer more flexibility and efficiency.
Preparing for a job interview? Explore our blog on Data Science Interview Questions and Answers!
Conclusion
Comparing two columns in Excel is a common yet essential task for many users, whether you’re performing data analysis, validation, or cleaning. Excel offers various methods for comparing data, ranging from simple formulas like IF and =, to more advanced tools like VLOOKUP, EXACT, and conditional formatting. Data Science Course Training , Excel provides a robust set of tools to compare two columns, each catering to different requirements. By understanding and utilizing these methods, you can significantly improve your data management and analysis capabilities.