 LMS
Last updated on 07th Oct 2026| 13683

- Introduction to Data Analytics Skills Required by Top MNCs
- Why MNCs Prefer Freshers with Strong Analytical Skills
- Essential Excel and Spreadsheet Skills for Data Analytics Jobs
- SQL and Database Management Skills for Data Analysts
- Python Programming and Data Manipulation Skills
- Power BI, Tableau, and Data Visualization Technologies
- Statistics, Data Cleaning, and Problem-Solving Skills
- Business Intelligence, Communication, and Reporting Skills
- Practical Data Analytics Projects, Certifications, and Portfolio Building
- Conclusion: Preparing for Data Analytics Careers in Leading MNCs
Introduction to Data Analytics Skills Required by Top MNCs
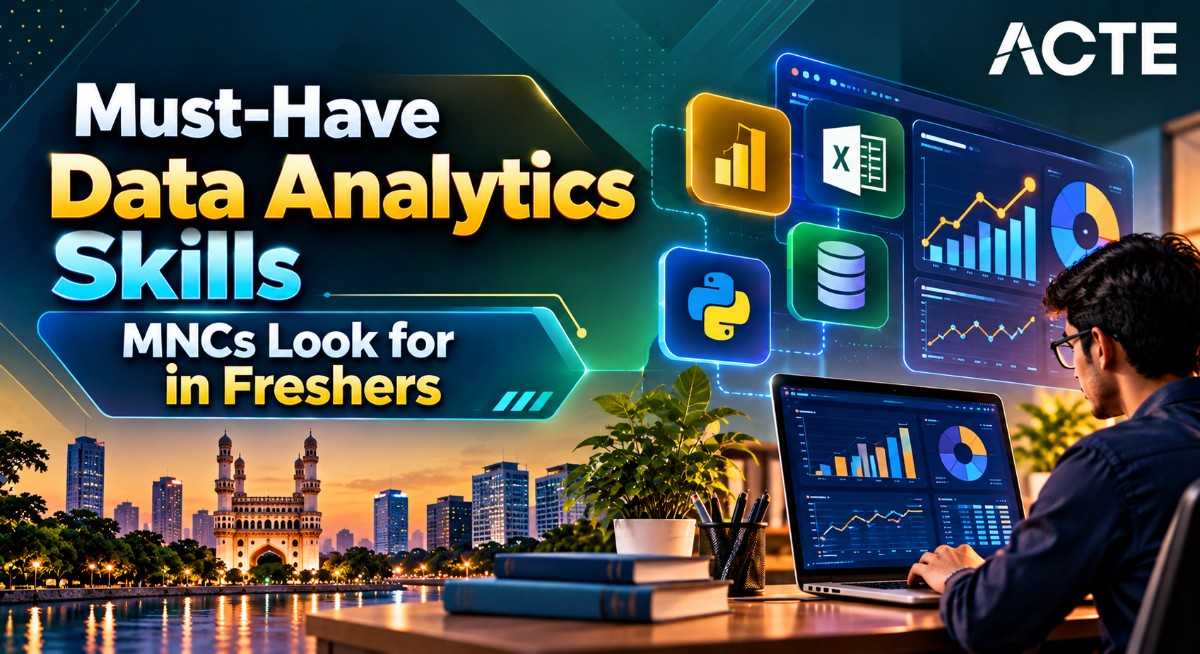
Data Analytics has become an important career field for freshers seeking opportunities in multinational companies across India. Leading organizations such as TCS, Infosys, Accenture, Cognizant, Wipro, Capgemini, IBM, and Deloitte use data analytics to support business decisions, improve operational efficiency, and understand customer behavior. Candidates interested in entry-level Data Analyst, Business Intelligence Analyst, Reporting Analyst, and MIS Analyst roles should develop practical knowledge of Microsoft Excel, SQL, Python, Power BI, Tableau, and statistical analysis. Enrolling in a Data Analytics Course can help learners strengthen their technical knowledge through practical exercises and project-based learning. Understanding data cleaning, data visualization, database management, and business reporting can further strengthen their technical foundation. MNCs may also evaluate communication, logical reasoning, problem-solving, and the ability to interpret business requirements. Freshers who complete practical projects, build interactive dashboards, and demonstrate analytical thinking can improve their readiness for data analytics interviews and entry-level career opportunities.
Why MNCs Prefer Freshers with Strong Analytical Skills
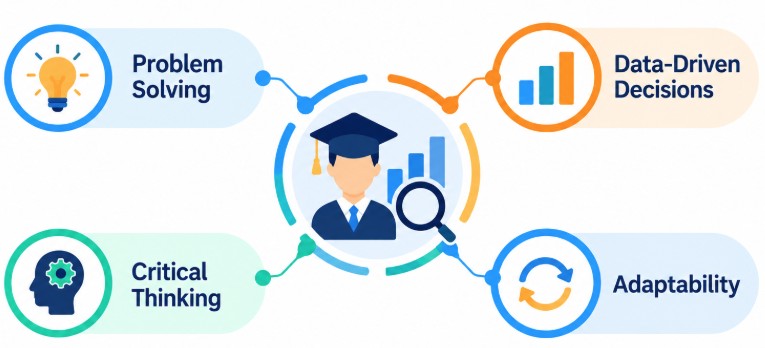
Multinational companies value freshers with strong analytical skills because they can interpret information, identify business problems, recognize patterns, and support evidence-based decision-making. Data analytics professionals frequently work with large datasets, financial records, and operational metrics to discover meaningful insights. Employers look for candidates who can use Excel, SQL, Python, and visualization tools to organize information, investigate trends, and communicate findings accurately. Strong analytical thinking also helps freshers identify data inconsistencies, evaluate possible solutions, and understand how business processes affect performance.
Essential Excel and Spreadsheet Skills for Data Analytics Jobs
| Excel Skill | Description | Key Topics to Learn |
|---|---|---|
| Excel Formulas and Functions | Freshers should understand essential formulas for calculations, data analysis, and business reporting. | SUM, AVERAGE, COUNT, IF, SUMIF, COUNTIF |
| Data Cleaning and Formatting | Excel helps analysts organize raw datasets, correct inconsistencies, and prepare accurate information for analysis. | Remove Duplicates, TRIM, Text to Columns |
| PivotTables and PivotCharts | PivotTables allow analysts to summarize large datasets and identify trends across different business categories. | PivotTables, PivotCharts, Slicers |
| Lookup Functions | Lookup functions help retrieve and combine information from multiple tables for reporting and analysis. | VLOOKUP, XLOOKUP, INDEX, MATCH |
| Conditional Formatting | Conditional formatting highlights important values, unusual patterns, and performance differences within datasets. | Color Scales, Data Bars, Highlight Rules |
| Data Sorting and Filtering | Sorting and filtering enable analysts to organize records and identify relevant information efficiently. | Advanced Filters, Custom Sorting |
| Excel Charts and Visualization | Charts help freshers present business trends, comparisons, and performance indicators in an understandable format. | Bar Charts, Line Charts, Pie Charts |
| Power Query | Power Query supports importing, cleaning, transforming, and combining data from multiple sources. | Data Import, Merge, Append, Transformations |
| Excel Dashboard Development | Interactive dashboards allow analysts to monitor KPIs and communicate business performance through visual reports. | KPI Cards, Charts, Slicers, Dashboards |
| Data Validation and Error Checking | Validation and error-checking techniques improve data accuracy and reduce mistakes in analytical reports. | Drop-Down Lists, IFERROR, Validation Rules |
| Statistical Analysis in Excel | Statistical functions help analysts evaluate distributions, relationships, and patterns within datasets. | MEDIAN, STDEV, CORREL, Percentiles |
| Excel Reporting and Automation | Reporting and automation skills help analysts reduce repetitive work and prepare consistent business reports. | Excel Tables, Power Query, Macros |
Get Your Data Analytics Certification by Learning from Industry-Leading Experts and Advancing Your Career with ACTE’s Data Analytics Course.
SQL and Database Management Skills for Data Analysts
- SQL Queries and Data Retrieval: Freshers should understand SQL commands such as SELECT, WHERE, ORDER BY, DISTINCT, and LIMIT to retrieve information from databases. These skills help analysts extract relevant records, filter datasets, and prepare information for business reporting.
- SQL Joins and Table Relationships: SQL joins help analysts combine information from multiple database tables. Candidates should practice INNER JOIN, LEFT JOIN, RIGHT JOIN, primary keys, and foreign keys to understand relationships between business datasets.
- Database Fundamentals and Data Management: Understanding relational databases, tables, schemas, normalization and database constraints helps freshers work with structured information and maintain accurate analytical datasets. Building these skills through practical exercises in a Data Analytics Course can help aspiring analysts prepare for real-world database tasks and entry-level analytics roles.
- Aggregate Functions and Data Grouping: Aggregate functions help summarize large datasets and calculate business metrics. Freshers should learn COUNT, SUM, AVG, MIN, MAX, GROUP BY, and HAVING to analyze sales, customer activities, and operational performance.
- Subqueries, CTEs, and Window Functions: Advanced SQL concepts help analysts solve complex reporting problems. Knowledge of subqueries, Common Table Expressions, ROW_NUMBER, RANK, and window functions can strengthen analytical capabilities.

Learn Advanced Data Analytics Certification Training Course to Build Your Skills
Weekday / Weekend BatchesSee Batch DetailsPython Programming and Data Manipulation Skills
- Python Programming Fundamentals: Freshers should understand Python syntax, variables, data types, loops, functions, conditional statements, and exception handling. These concepts provide a foundation for data analysis, automation, and analytical programming.
- Pandas for Data Analysis: Pandas helps analysts load, filter, clean, transform, and summarize structured datasets. Candidates should practice DataFrames, grouping, merging, sorting, missing-value handling, and CSV or Excel operations. Learning to Master Excel Formulas for Smarter Data Analysis can also help freshers understand spreadsheet-based analysis and complement their Python skills.
- NumPy for Numerical Operations: NumPy supports numerical calculations and efficient array operations. Understanding arrays, indexing, mathematical functions, and statistical calculations can help freshers process numerical datasets.
- Data Cleaning and Transformation: Python enables analysts to identify missing values, remove duplicates, correct inconsistent formats, and transform raw information. These skills help prepare reliable datasets for reporting and visualization.
- Python Data Visualization: Libraries such as Matplotlib and Seaborn help analysts create charts and explore relationships within datasets. Freshers should practice line charts, bar charts, histograms, scatter plots, and data distribution analysis.

Get JOB Oriented Data Analytics Training for Beginners By MNC Experts
- Instructor-led Sessions
- Real-life Case Studies
- Assignments
Power BI, Tableau, and Data Visualization Technologies
- Power BI Dashboard Development: Power BI helps analysts create interactive dashboards and business reports. Freshers should learn data connections, report design, filters, slicers, KPI cards, and dashboard publishing to present business insights effectively.
- Power Query and Data Transformation: Power Query supports importing and transforming information from different sources. Understanding its transformation features helps analysts prepare structured datasets for visualization. Freshers can also explore Metabase Is a Powerful Tool for Data Analysts to learn about alternative business intelligence tools and their reporting capabilities.
- DAX and Data Modeling: DAX enables calculations in Power BI, while data modeling establishes relationships between tables. Candidates should practice measures, calculated columns, relationships, and basic time intelligence.
- Tableau Visualization Skills: Tableau allows analysts to explore datasets and build interactive reports. Freshers should understand dimensions, measures, calculated fields, filters, parameters, charts, and dashboard development.
- Data Storytelling and Dashboard Design: Effective visualization requires more than creating charts. Analysts should learn to select appropriate visuals, highlight important KPIs, explain trends, and communicate actionable findings to business stakeholders.
Want to Master Data Analytics? Explore the Data Analytics Master Program Offered at ACTE Today!
Statistics, Data Cleaning, and Problem-Solving Skills
- Descriptive Statistics: Freshers should understand mean, median, mode, variance, standard deviation, and percentiles. These concepts help analysts summarize datasets, identify distributions, and interpret business performance.
- Probability and Statistical Analysis: Knowledge of probability, sampling, correlation, hypothesis testing, and confidence intervals helps analysts evaluate patterns, compare results, and make evidence-based recommendations.
- Analytical Thinking and Problem-Solving: MNCs value candidates who can understand business questions, investigate underlying causes, compare possible explanations, and recommend solutions supported by data. Developing these skills through a Data Analytics Course can help freshers build practical analytical knowledge and prepare for entry-level data analytics opportunities.
- Data Cleaning and Quality Assessment: Data cleaning involves identifying duplicate records, missing values, inconsistent formats, incorrect entries, and outliers. Strong data-quality practices improve the accuracy and reliability of analytical results.
- Exploratory Data Analysis: Exploratory Data Analysis helps professionals investigate datasets before developing reports. Analysts use summary statistics, charts, grouping, and comparisons to identify trends, relationships, and unusual patterns.
Business Intelligence, Communication, and Reporting Skills
- Business Reporting and Documentation: Analysts prepare reports that communicate business performance and operational trends. Candidates should develop skills in report formatting, data validation, documentation, and presenting accurate analytical findings.
- Communication and Presentation Skills: Strong communication helps Data Analysts explain technical findings to non-technical audiences. Freshers should practice presenting dashboards, summarizing insights, and delivering clear business recommendations.
- Business Intelligence Fundamentals: Business Intelligence involves collecting, organizing, analyzing, and presenting information to support organizational decisions. Freshers should understand KPIs, business metrics, dashboards and performance measurement. Exploring Future Trends in Data Analytics can help candidates understand how evolving analytics technologies influence business intelligence and data-driven decision-making.
- Business Requirement Analysis: Understanding business requirements helps analysts identify relevant datasets, select appropriate metrics, and develop useful reports. Candidates should learn how to gather requirements and translate them into analytical tasks.
- Teamwork and Stakeholder Collaboration: Data Analysts often collaborate with business teams, developers, managers, and other stakeholders. Strong teamwork, active listening, time management, and professional communication support successful analytical projects.
Want to Learn About Data Analytics? Explore Our Data Analytics Interview Questions and Answers Featuring the Most Frequently Asked Questions in Job Interviews.
Practical Data Analytics Projects, Certifications, and Portfolio Building
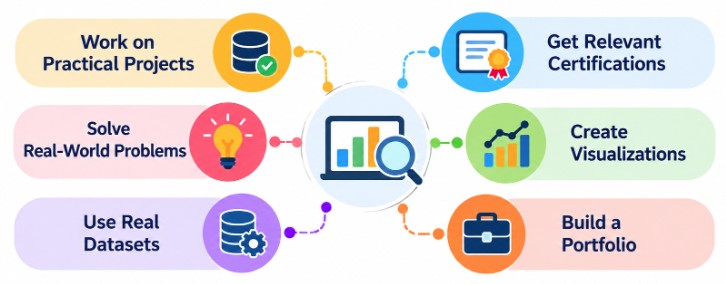
Practical Data Analytics projects, professional certifications, and a well-organized portfolio can help freshers demonstrate their technical abilities when applying for opportunities at leading MNCs. Candidates should develop real-world projects involving sales analysis, customer segmentation, financial reporting, employee performance dashboards, inventory management, and business forecasting. Using Excel, SQL, Python, Power BI, and Tableau in these projects helps demonstrate data cleaning, transformation, visualization, and analytical problem-solving skills. Industry-recognized certifications in Data Analytics, Microsoft Power BI, SQL, Python, or business intelligence can strengthen professional profiles when supported by practical knowledge.
Conclusion: Preparing for Data Analytics Careers in Leading MNCs
Preparing for Data Analytics careers in leading MNCs requires a strong combination of technical expertise, analytical thinking and professional communication skills. Freshers should begin by mastering Excel, SQL, statistics, and data cleaning before progressing toward Python, Power BI, Tableau, and advanced business intelligence concepts. Understanding database management, data visualization, reporting, and business problem-solving can help candidates meet the expectations of entry-level analytics positions. Enrolling in a Data Analytics Course can help aspiring professionals strengthen their technical foundation and gain practical exposure to industry-relevant tools. Practical projects, internships, certifications, and a professional portfolio can demonstrate the ability to transform raw datasets into meaningful business insights. Candidates should also prepare for technical interviews involving SQL queries, Excel functions, Python programming, statistical concepts, dashboard interpretation, and analytical case studies. Continuous learning, attention to detail, teamwork, and effective communication can strengthen employability. By consistently improving their skills and applying them to practical business problems, freshers can build a foundation for long-term Data Analytics careers in multinational organizations.