- Are you struggling to comprehend your data?
- Importance of Data Visualization
- Features of Google Data Studio
- Connecting Data Sources
- Creating Dashboards
- Data Blending in Studio
- Sharing & Collaboration
- Custom Reports
- Real-time Reporting
- Benefits for Businesses
- Alternatives to Google Data Studio
- Conclusion
Are you struggling to comprehend your data?
In today’s digital world, organizations depend on data to make better, faster decisions. However, handling large amounts of raw data from spreadsheets, databases, and marketing platforms can be daunting. To interpret this data effectively, you need visualization. Business Analyst Training. This process changes complex datasets into easy-to-understand visual reports. Google Data Studio, now called Looker Studio, is a game-changer in this area. Google Data Studio is a free, web-based tool for data visualization and google reporting. It enables users to create customizable dashboards and reports from various data sources, including google tool Analytics, Google Ads, BigQuery, and external databases. Whether you’re a digital marketer evaluating campaign results, a business owner tracking sales, or a student studying analytics, Google Data Studio offers a strong, user-friendly way to convert raw data into valuable insights.
Importance of Data Visualization
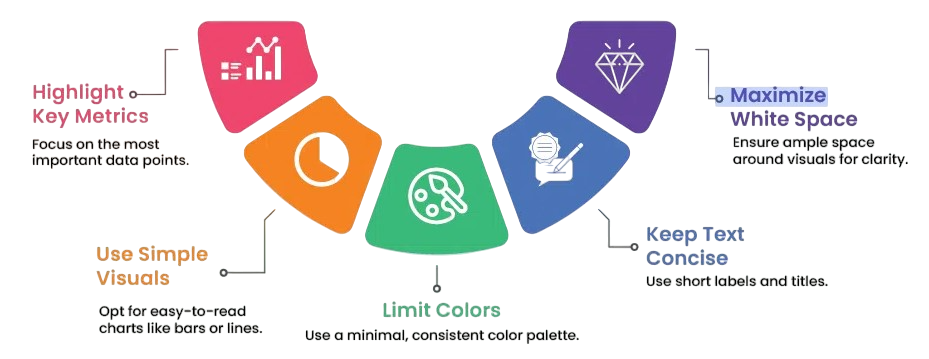
Data visualization links complex data with actionable understanding. It turns spreadsheets filled with numbers into engaging creating simple dashboards that uncover patterns, correlations, and performance trends. In today’s data-driven business landscape, visualization is essential for interpreting data, communicating findings, and making strategic decisions. Consider a marketing manager reviewing monthly campaign results. Instead of sifting through endless spreadsheet rows, a visual reports dashboard can quickly show performance trends, such as the link between ad spending and website traffic. This rapid insight allows teams to make informed decisions more quickly. Data visualization tools like Google Data Studio make this process easier by providing lively data visuals, real-time updates, and interactivity. These features improve understanding and engagement among teams. When stakeholders can see the story behind the data, collaboration and strategic focus naturally increase.
Interested in Obtaining Your Business Analyst Certificate? View The Business Analyst Training Offered By ACTE Right Now!
Features of Google Data Studio
Google Data Studio (Looker Studio) comes with features that emphasize both simplicity and power. Here are some of its most valuable capabilities:
- Drag-and-Drop Interface – Users without technical backgrounds can create attractive creating simple dashboards by simply dragging charts, tables, and filters onto the canvas.
- Interactive Dashboards – Users can engage with data visuals using dynamic controls like filters, date ranges, drop-down menus, and clickable charts.
- Customization Options – Reports can be fully branded with company logos, colors, and design themes to fit corporate identity.
- Integration with Google Ecosystem – It connects easily with Google products such as Analytics, Ads, Sheets, BigQuery, and YouTube Analytics.
- Pre-built Templates – google tool offers ready-made templates for different use cases like marketing performance, e-commerce tracking, and website analytics.
- Collaboration & Sharing – Multiple team members can edit or comment on creating simple dashboards at the same time, similar to google tool Docs.
- Scheduled Reporting – Reports can be set to update automatically and sent to stakeholders via email on a defined schedule.
- Free of Cost – Unlike many business intelligence tools, Google Data Studio provides professional-quality visualization features at no cost.
These features make Google Data Studio a highly accessible and robust tool for individuals, small businesses, and large enterprises.
Connecting Data Sources
One of Google Data Studio’s strongest features is its ability to connect multiple data sources into one unified dashboard. This integration allows businesses to consolidate their analytics efforts and remove data silos.
Supported connections include:
- Google Data Sources: Google Analytics, Google Ads, Search Console, Google Sheets, YouTube Analytics, BigQuery, and Google Cloud SQL.
- Databases: MySQL, PostgreSQL, and other relational databases.
- Third-party Connectors: Tools like Supermetrics and Power My Analytics offer integration with non-Google platforms such as Facebook Ads, LinkedIn Ads, HubSpot, Shopify, and others.

For instance, a company running campaigns on Google Ads and Facebook Ads can blend the data in one dashboard. This creates a complete view of marketing performance without the need for manual data merging. The time saved on data collection allows for more focus on analyzing insights that directly affect business growth.
Creating Dashboards
Creating creating simple dashboards in Google Data Studio is straightforward. Once you connect your data source, you can start designing the report using an easy drag-and-drop interface. You can include a variety of visualization components such as:
- Time series charts to show data trends over time.
- Pie charts to represent distribution or composition.
- Tables with conditional formatting for detailed performance metrics.
- Scorecards for high-level KPIs like revenue or conversion rate.
- Geo maps to visualize regional performance.
Users can adjust the layout to emphasize what’s most important, such as creating executive creating simple dashboards that summarize KPIs at a glance or more detailed reports that delve into granular metrics. Plus, interactive filters allow viewers to explore data dynamically, such as filtering by region, campaign, or time frame. This interactivity turns reports from static snapshots into tools for exploration and decision-making.
Want to Pursue a Business Analyst Master’s Degree? Enroll For Business Analyst Master Program Training Course Today!
Data Blending in Studio
Data blending is one of the most powerful features in Google Data Studio Business Analyst Training. It enables users to combine data from multiple sources into one chart or table for comparative or relational analysis.
For example:
- A digital marketer can blend Google Analytics (website sessions) with Google Ads (cost data) to analyze cost per session or ROI.
- An e-commerce store can merge Shopify sales data with Google Analytics sessions to calculate conversion rates and measure customer acquisition effectiveness.
This unified view helps businesses uncover insights that might remain hidden in separate datasets. Data blending supports complex google reporting use cases, making it possible to analyze metrics across marketing channels, customer databases, and sales platforms at the same time.
Sharing & Collaboration
Google Data Studio excels at real-time collaboration—an important feature for modern, distributed teams. Since reports are web-based, they can be shared easily with a simple reports link, and updates are applied immediately.
Permissions can be customized so that:
- Team members can edit dashboards together.
- Stakeholders can view or comment on reports.
- Clients can get read-only access to monitor progress.
Everyone works on the same live report, so there’s no confusion over versions or outdated data. This seamless collaboration cuts down on friction and ensures that decision-makers always have access to the latest insights.
To Earn Your Business Analyst Certification, Gain Insights From Leading Data Science Experts And Advance Your Career With ACTE’s Business Analyst Training Today!
Custom Reports
Customization is central to Google Data Studio’s design. Users can adjust every aspect of a report—from fonts, color schemes, and chart types to custom metrics and calculated fields.
Some common custom report examples include:
- Marketing agencies designing client dashboards that show campaign KPIs in branded formats.
- Sales teams creating performance simple reports that highlight revenue, targets, and pipeline health.
- Educators and students building academic research dashboards for data-driven insights.
Advanced users can also create calculated metrics (e.g., “ROI = Revenue / Ad Spend”) or apply filters and dimensions to refine how data is displayed. This flexibility allows Google Data Studio to work for simple reports google reporting needs as well as complex analytical projects.
Go Through These Business Analyst Interview Questions and Answers to Excel in Your Upcoming Interview.
Real-time Reporting
Real-time reporting is a significant advantage of Google Data Studio. Since the tool links directly to live data sources, dashboards update automatically as new data comes in, eliminating the need for manual refreshes.
For instance:
This immediate availability of insights makes organizations more agile and responsive to market shifts or operational changes.
Benefits for Businesses
Google Data Studio offers numerous benefits that appeal to various industries and company sizes.
- Cost-Effective; The tool is completely free, making it accessible to startups and small businesses needing strong analytics without high costs.
- Ease of Use; Its user-friendly interface allows non-technical users to create professional dashboards without coding.
- Improved Decision-Making; Interactive data visuals let decision-makers assess trends and performance metrics at a glance.
- Time Efficiency; Automated updates and real-time connections reduce the time spent on compiling and formatting reports.
- Cross-Department Collaboration; Teams from marketing, sales, finance, and operations can share unified data insights.
- Scalability; From single-user projects to enterprise-level data systems, Google Data Studio scales effortlessly.
- Data Integration; The ability to connect multiple data sources ensures a complete view of business performance.
- Tableau – A leading business intelligence platform known for advanced visual analytics, predictive modeling, and enterprise integration but comes with a higher price.
- Microsoft Power BI – Integrates smoothly with Microsoft Office 365 while offering robust data modeling and AI-driven insights.
- Qlik Sense – Known for its associative data exploration, enabling users to uncover hidden links in large datasets.
- Zoho Analytics – A cost-effective option for small and medium businesses that integrates well with CRM systems and cloud applications.
- Looker (Enterprise Version) – Google’s advanced enterprise analytics tool that offers deeper integration with Google Cloud and data modeling via LookML.
-
The best choice depends on factors like company size, data complexity, budget, and existing infrastructure. For many small and medium-sized businesses, Google Data Studio provides a good balance of cost, usability, and functionality.
Business Analyst Sample Resumes! Download & Edit, Get Noticed by Top Employers! DownloadConclusion
Google Data Studio (Looker Studio) has changed how people visualize, analyze, and share data. It connects complex data systems with actionable insights through customizable dashboards, real-time updates, and collaborative features, all for free. As data drives strategies across marketing, sales, and customer engagement, tools like Data Studio make analytics accessible, enabling everyone to create powerful visual reports without specialized training. Whether tracking marketing ROI, analyzing website performance, or presenting KPIs to stakeholders, Google Data Studio turns raw information into clarity and guidance— Business Analyst Training. As businesses continue to embrace data-driven decision-making, tools simplifying visualization, like Google Data Studio, will remain essential in modern analytics. It’s not just about looking at data anymore; it’s about understanding the story that data tells.

By helping users see data as a coherent story instead of scattered figures, Data Studio supports organizations in becoming more data-driven, efficient, and strategically focused.
Alternatives to Google Data Studio
While Google Data Studio is powerful and free, some businesses might want more advanced or specialized analytics tools. Here are some popular alternatives:


