
Last updated on 30th Oct 2025| 9502
- Business Intelligence (BI)
- Business Analytics (BA)
- Key Differences Between BI and BA
- Focus on Past vs. Predictive Analysis
- Tools Used in BI vs. BA
- Data Sources for BI vs. BA
- Role of Machine Learning in BI and BA
- Performance Measurement in BI vs. BA
- Decision-Making Process in BI vs. BA
- Which One is More Suitable for Your Business?
- Future Trends in BI and Business Analytics
- Conclusion
Business Intelligence (BI)
Business Intelligence (BI) refers to the technologies, strategies, and tools used to collect, analyze, and visualize business data for better decision-making. BI systems transform large amounts of raw information into meaningful reports and dashboards that highlight key performance indicators (KPIs) and business trends, forming a crucial part of Business Analyst Training . The primary purpose of BI is descriptive analysis it helps organizations answer questions such as “What happened?” and “Why did it happen?”. It consolidates data from multiple departments like finance, marketing, and operations to provide a unified view of business performance. Modern BI platforms such as Microsoft Power BI, Tableau, Qlik Sense, and Looker Studio allow even non-technical users to access, explore, and visualize data in real time. Through these insights, managers can monitor operations, identify inefficiencies, and make quick, data-backed decisions.
Are You Interested in Learning More About Business Analyst? Sign Up For Our Business Analyst Training Today!
Business Analytics (BA)
Business Analytics (BA) takes data analysis a step further by focusing on predictive and prescriptive insights. While BI shows what has already happened, BA aims to discover why something happened and what is likely to happen next. BA uses advanced statistical models, algorithms, and machine learning techniques to forecast future trends, identify opportunities, and optimize business strategies, while understanding the Difference between OLTP vs OLAP helps analysts manage data processing and analytical tasks more effectively. It is more exploratory and data science-driven compared to BI. Common tools for business analytics include Python, R, SAS, IBM SPSS, and RapidMiner, which allow analysts to perform regression analysis, time-series forecasting, and predictive modeling. The outcomes help organizations not just understand their data, but act on it predicting customer behavior, minimizing risks, and improving profitability.
Key Differences Between BI and Data Analytics
Although BI and BA share the goal of improving business performance, their focus, methods, and outcomes differ significantly.
| Aspect | Business Intelligence (BI) | Business Analytics (BA) |
|---|---|---|
| Focus | Descriptive and diagnostic – explains past and present | Predictive and prescriptive – forecasts and optimizes future outcomes |
| Objective | Improve operational efficiency | Drive innovation and strategic growth |
| Techniques | Data visualization, reporting, dashboards | Statistical modeling, data mining, machine learning |
| Users | Business executives, managers, decision-makers | Data scientists, analysts, strategists |
| Output | Reports, KPIs, performance summaries | Predictions, recommendations, simulations |
In essence, BI looks backward and inward it helps businesses monitor performance while BA looks forward and outward it helps businesses plan for the future.
Focus on Past vs Predictive Analysis
One of the most notable distinctions between BI and BA is their temporal focus.
- BI focuses on the past and present.- It compiles historical data and presents it through dashboards, charts, and reports. For example, a retail store might use BI to analyze last quarter’s sales performance, monitor stock levels, and identify top-selling products.
- BA focuses on the future.- It uses statistical algorithms and predictive models to forecast demand, customer churn, or revenue growth. Using the same retail example, BA can predict which products will trend next season or which customers are likely to switch brands.
In other words, BI is reactive; it helps you respond to what has already occurred, whereas BA is proactive; it helps you prepare for what’s to come. Understanding how to use DAX In Power BI further enhances this process by enabling users to create advanced calculations and derive deeper insights from their data.
Tools Used in BI vs. BA
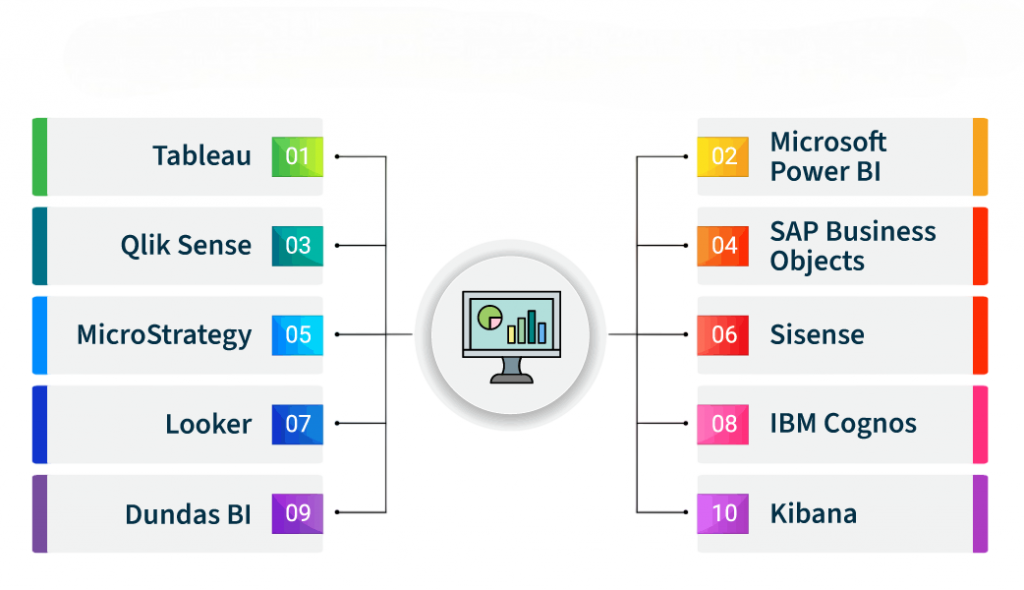
- BI Tools:
- Microsoft Power BI: Provides interactive dashboards and seamless integration with Excel and Azure.
- Tableau: Known for user-friendly visual analytics and storytelling dashboards.
- Qlik Sense: Enables associative data exploration for deeper insights.
- Google Looker Studio: Ideal for creating real-time, collaborative reports. BA Tools: Business Analytics tools focus on data exploration, statistical computation, and machine learning. Widely used tools include Tableau vs Looker for interactive data visualization, as well as Python, R, SAS, and RapidMiner for advanced analytics and predictive modeling.
- Python and R: Open-source programming languages for data manipulation and modeling.
- SAS and IBM SPSS: Used for complex statistical and predictive analysis.
- RapidMiner and KNIME: Visual workflow tools for data mining and machine learning.
- Apache Spark: Handles large-scale data processing for real-time analytics.
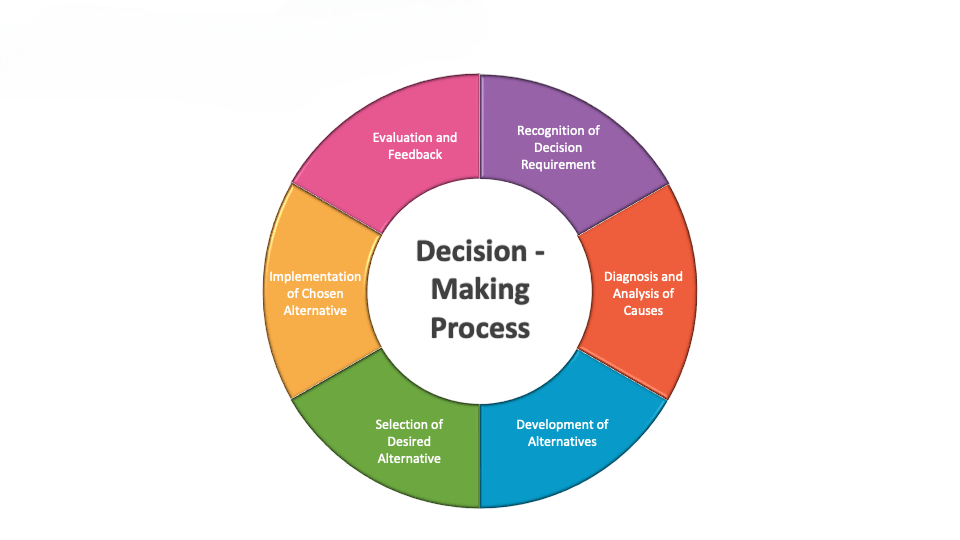
- In BI: Decisions are made based on reports and dashboards that provide clear, real-time data visibility. Managers use this information to address current issues, allocate resources, or improve efficiency. The decision-making is primarily operational and short-term in nature, and understanding What is Power BI can help managers leverage interactive dashboards and real-time data for more effective day-to-day decisions.
- In BA:Decisions are strategic and long-term, focusing on optimization and innovation. Business Analytics helps answer questions like “What if we expand into a new market?” or “How can we reduce churn by 15% next quarter?” By simulating scenarios and predicting outcomes, BA enables executives to make bold, data-informed strategic moves. In essence, BI supports decision support, while BA drives decision transformation.
- Your organization needs better visibility into existing operations.
- You want to make data accessible to all departments through dashboards and reports.
- You’re focused on improving efficiency and monitoring KPIs, and understanding MicroStrategy vs Power BI can help determine which platform best supports your organization’s reporting and analytics needs. Choose BA if:
- You aim to predict trends and make strategic, data-driven decisions.
- Your business handles complex data and requires advanced modeling.
- You want to use AI and ML for automation, forecasting, and optimization.
- Augmented Analytics: AI-driven analytics that automatically prepares data and generates insights without manual intervention.
- Real-Time Data Processing: Integration with IoT and cloud platforms for instant data updates and alerts.
- Natural Language Processing (NLP): BI tools now allow users to ask questions in plain English and receive instant visual answers, making it important to understand Qlik Sense vs Power BI when choosing the right platform for interactive analytics.
- Embedded Analytics: Analytics integrated directly into business applications for seamless insights.
- Predictive BI: BI platforms incorporating BA capabilities to forecast and simulate outcomes.
- Data Democratization: Making advanced analytics accessible to all employees, not just data scientists.
Business Intelligence tools prioritize data visualization, ease of use, and real-time reporting. Popular tools include:
While BI tools empower non-technical users to visualize data easily, BA tools require technical expertise to interpret and act upon advanced analytical results.

Data Sources for BI vs. BA
Business Intelligence primarily uses structured data stored in relational databases and data warehouses. Examples include CRM systems, ERP systems, and financial transaction records. The focus is on accuracy and consistency, ensuring the data reflects real-time or historical performance. Business Analytics, however, draws from a broader range of data sources, including both structured and unstructured data, making skills in Business Analytics with Excel Fundamentals essential for efficiently organizing, analyzing, and interpreting complex datasets. This can involve social media feeds, sensor data (IoT), website logs, and customer feedback. By combining multiple sources, BA provides a more holistic view of business behavior and market dynamics. For instance, a BI dashboard may show that sales declined in a certain region, while BA can analyze social media sentiment to uncover the reasons such as negative customer reviews or changing preferences.
Role of Machine Learning in BI and BA
Machine learning (ML) plays a central role in Business Analytics and an emerging role in Business Intelligence. In BI, machine learning is increasingly used to automate data preparation, anomaly detection, and trend forecasting. Modern BI tools integrate AI-powered features such as natural language queries, predictive visualizations, and automated insights, which are essential components of Business Analyst Training . For example, Power BI’s “Quick Insights” feature uses ML to automatically detect patterns in data. In BA, machine learning is a core component. It drives predictive analytics, customer segmentation, recommendation engines, and fraud detection. By training algorithms on historical data, businesses can predict outcomes such as demand fluctuations or credit risk with high accuracy. Thus, while BI uses ML to enhance reporting, BA uses ML to transform decision-making through predictive and prescriptive intelligence.
Looking to master Business Analyst? Sign up for ACTE’s Business Intelligence Master Program Training Course and begin your journey today!
Performance Measurement in BI vs. BA
Performance measurement is a critical aspect of both BI and BA, though their methods and outcomes differ. BI focuses on tracking and visualizing KPIs that measure the success of business operations. These may include revenue growth, profit margins, customer satisfaction, or employee productivity. BI dashboards allow managers to monitor progress against targets and take corrective actions when deviations occur, linking closely to the principles of What is Lean Management? to streamline processes and improve operational efficiency. BA, in contrast, emphasizes performance optimization. It uses predictive models to determine how changes in strategy might influence future results. For example, analytics can simulate how increasing marketing spend could impact sales conversions or how adjusting prices might influence demand. While BI evaluates “what is happening,” BA tests “what could happen” making it a more experimental and forward-thinking discipline.
Decision-Making Process in BI vs. BA
The decision-making process enabled by BI and BA also varies in scope and depth.
Preparing for Business Analyst interviews? Visit our blog for the best Business Analyst Interview Questions and Answers
Which One is More Suitable for Your Business?
Choosing between BI and BA depends on your business goals, maturity, and data capabilities.
- Choose BI if:
For most organizations, the ideal approach is a hybrid strategy combining BI’s reporting power with BA’s predictive intelligence. Together, they create a data ecosystem that enables both short-term performance management and long-term strategic growth.
Future Trends in BI and Business Analytics
As technology evolves, BI and BA are converging, powered by advancements in AI, cloud computing, and automation. Key trends include:
In the near future, businesses won’t have to choose between BI and BA they will operate within a unified, intelligent system that continuously learns, predicts, and guides decisions.
Conclusion
In summary, Business Intelligence and Business Analytics are complementary pillars of modern business strategy. BI provides a clear understanding of what’s happening through reports and dashboards, while BA dives deeper into why it’s happening and what will happen next. BI empowers organizations to monitor their present performance efficiently; BA enables them to predict the future and innovate confidently. Together, they form a complete cycle of data intelligence from descriptive insights to prescriptive actions. In Business Analyst Training , professionals learn how to apply both BI and BA concepts to transform raw data into strategic business value. They gain hands-on experience with tools like Power BI, Tableau, and Python to analyze, visualize, and forecast business outcomes. This combination of BI and BA skills helps analysts make data-driven decisions, improve organizational performance, and drive long-term growth. As data continues to grow exponentially, the integration of BI and BA will define how successful, adaptive, and competitive a business can be in the digital age.