Last updated on 07th Nov 2025| 11860
- What is Business Statistics?
- Importance of Business Statistics
- Descriptive vs. Inferential Statistics in Business
- Data Collection Methods in Business Analytics
- Measures of Central Tendency (Mean, Median, Mode)
- Measures of Dispersion (Variance, Standard Deviation)
- Probability and Its Role in Business Statistics
- Hypothesis Testing in Business Decision-Making
- Regression Analysis in Business Statistics
- Time Series Analysis for Business Forecasting
- Statistical Tools for Business Intelligence (BI)
- Conclusion
What is Business Statistics?
Business Statistics is a specialized branch of applied statistics that focuses on collecting, analyzing, interpreting, and presenting data to support decision-making in business environments. It enables organizations to convert raw data into meaningful insights that guide strategies, improve performance, and optimize operations. To explore how structured learning equips professionals with the skills to bridge data analysis and business strategy, explore Business Analyst Training a comprehensive program that covers requirement gathering, stakeholder communication, process optimization, and analytics-driven decision-making for modern enterprises. Business Statistics provides the tools to understand market trends, forecast sales, measure performance, and identify risks. It combines mathematics, economics, and data analysis to help business professionals make evidence-based decisions rather than relying on intuition or guesswork. In today’s data-driven world, Business Statistics plays a vital role in various functions such as marketing, finance, production, and human resources. Whether determining customer satisfaction, estimating future demand, or analyzing profitability, statistical methods form the foundation for strategic planning and operational efficiency.
Importance of Business Statistics
The term Business Statistics can be defined as the “application of statistical techniques to business data to make informed decisions.” To explore how professionals leverage statistical methods, analytical frameworks, and decision-support tools to drive organizational success, explore Business Analysis Careers a comprehensive guide that highlights the integration of business statistics with analytics, skill requirements, and evolving career opportunities in modern enterprises. It involves both the descriptive and inferential aspects of statistics to summarize and interpret data for real-world business applications.
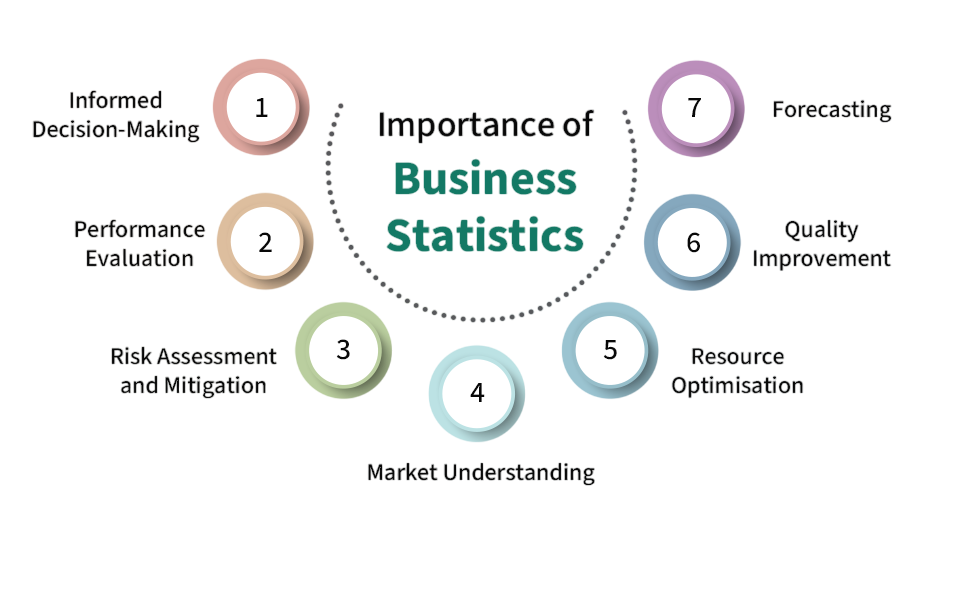
The importance of Business Statistics lies in its ability to provide clarity and confidence in decision-making. By understanding numerical data, businesses can minimize risks, control variability, and identify opportunities for growth. Business Statistics is important in today’s business world. It helps managers make informed decisions based on data, not just guesses. By using data, they can make choices that reflect real evidence. Companies also use statistical methods to predict future trends like demand, pricing, and sales. This helps them stay competitive in a changing market. Quality control is another area where statistics matter. Businesses use methods like control charts to keep product quality high, which leads to happier customers. Additionally, organizations use statistical measures to assess performance, looking at efficiency, employee productivity, and overall customer satisfaction.
Interested in Obtaining Your Business Analyst Certificate? View The Business Analyst Training Offered By ACTE Right Now!
Descriptive vs. Inferential Statistics in Business
- Business Statistics is broadly divided into Descriptive and Inferential statistics. Descriptive Statistics involves methods of organizing, summarizing, and presenting data in a meaningful way. Common tools include tables, charts, graphs, and summary measures such as mean, median, and standard deviation. For instance, a company may use descriptive statistics to show last quarter’s sales by region or summarize customer satisfaction ratings. It provides a clear snapshot of what has already happened but does not predict or generalize beyond the data.
- Inferential Statistics, on the other hand, deals with making predictions or inferences about a population based on a sample of data. It uses probability theory to estimate population parameters and test hypotheses. For example, a business may analyze a sample of customer feedback to infer overall market satisfaction. Techniques like confidence intervals, hypothesis testing, regression, and correlation are key components of inferential statistics. Both types complement each other. Descriptive statistics summarize the data, while inferential statistics help make decisions and predictions for the future.
- Surveys and Questionnaires: Common in marketing research to understand customer preferences.
- Interviews: Direct interaction with individuals to gain in-depth insights.
- Experiments: Controlled environments to test hypotheses or new strategies.
- Observation: Monitoring consumer behavior or production processes.
- Focus Groups: Discussions among selected individuals to understand perceptions and attitudes.
- Mean (Average): It is the sum of all data values divided by their number. The mean is widely used in business for calculating average sales, expenses, or profits. However, it can be affected by extreme values (outliers).
- Median: The middle value when data is arranged in order. The median is particularly useful when data is skewed for instance, when analyzing employee salaries where a few high values can distort the mean.
- Mode: The most frequently occurring value in a dataset. It is helpful in identifying popular products, most common customer ratings, or preferred payment methods.
- In finance, probability helps assess the risk of investment returns.
- In marketing, it estimates the likelihood of a customer purchasing a product.
- In supply chain management, it predicts stock shortages or delivery delays.
- Formulating a null hypothesis (H₀): An assumption that there is no effect or difference.
- Setting an alternative hypothesis (H₁): Stating that an effect or difference exists.
- Collecting data and calculating a test statistic.
- Comparing the result with a significance level (α) to decide whether to reject H₀.
- Forecasting: Predicting future sales or demand based on past data.
- Pricing: Understanding how price changes affect revenue.
- Performance Analysis: Measuring the impact of operational factors on profit.
- Identify trends (long-term movement).
- Recognize seasonal patterns (like festive demand spikes).
- Detect cyclical variations (economic booms or recessions).
- Microsoft Excel: Basic statistical functions and pivot tables for small-scale analysis.
- R and Python: Advanced statistical computing and predictive analytics.
- Tableau and Power BI: Visualization tools that present data insights through interactive dashboards.
- SPSS and SAS: Professional-grade software for statistical modeling and forecasting.
Business Statistics:
Inferential Statistics:
To Earn Your Business Analyst Certification, Gain Insights From Leading Data Science Experts And Advance Your Career With ACTE’s Business Analyst Training Today!
Data Collection Methods in Business Analytics
Accurate and reliable data collection is the foundation of Business Statistics. Businesses rely on both primary and secondary data sources. To explore how structured training equips professionals to transform raw data into actionable insights bridging statistical methods with business strategy explore Business Analyst Training a comprehensive program that covers data collection techniques, requirement analysis, stakeholder communication, and analytics-driven decision-making for modern enterprises.
Primary data is collected firsthand for a specific purpose using methods such as:
Secondary data refers to data collected earlier for other purposes but used for current analysis. It includes internal company records, government publications, trade journals, and online databases. In business analytics, the choice of data collection method depends on the objective, available time, and cost. The accuracy and credibility of the collected data directly influence the reliability of statistical conclusions.

Develop Your Skills with Business Analyst Online Training
Weekday / Weekend BatchesSee Batch DetailsMeasures of Central Tendency (Mean, Median, Mode)
Measures of central tendency summarize data by identifying the central or typical value within a dataset. To explore how professionals apply these statistical techniques to transform raw data into actionable insights for decision-making, explore Business Intelligence Analyst a comprehensive guide that covers data summarization, visualization, reporting, and the evolving role of BI analysts in modern enterprises.
Together, these measures give businesses a quick understanding of general trends and average behavior, helping in pricing, budgeting, and planning decisions.
Want to Pursue a Business Analyst Master’s Degree? Enroll For Business Analyst Master Program Training Course Today!
Measures of Dispersion (Variance, Standard Deviation)
Central tendency provides valuable insight into the average of a data set, but it is the measures of dispersion that truly illuminate the extent of variability or spread within that data. Understanding this variability is essential for businesses, as it enables them to assess risk and consistency more effectively. To explore how structured analytics training empowers professionals to interpret variability, manage risk, and drive consistent performance, explore Learn Business Analytics a comprehensive guide that covers statistical foundations, predictive modeling, and real-world applications for modern enterprises. Variance, for instance, measures the average squared deviation of data points from the mean. A high variance indicates that the data points are widely spread, suggesting potential instability in processes or markets. In practical terms, the standard deviation derived from the square root of variance serves as a crucial metric, representing the average amount by which observations deviate from the mean. This statistic is frequently utilized in finance to gauge investment risk or market volatility.
Go Through These Business Analyst Interview Questions and Answers to Excel in Your Upcoming Interview.
Probability and Its Role in Business Statistics
Probability is a key concept that helps businesses deal with uncertainty. It measures the likelihood of an event occurring, expressed as a number between 0 and 1. To explore how professionals apply probability and other analytical methods to optimize processes, reduce risks, and support strategic decisions, explore Business Systems Analyst a practical guide that highlights essential skills, process improvement strategies, and the evolving role of analysts in modern enterprises. In business applications, probability is used to estimate risks, forecast demand, and evaluate outcomes under uncertain conditions. For instance:
Probability distributions, such as normal, binomial, and Poisson distributions, are used extensively to model random business events. Understanding probability enables decision-makers to plan for multiple outcomes, minimize losses, and maximize profits.
Hypothesis Testing in Business Decision-Making
Hypothesis testing is a statistical method used to make inferences or draw conclusions about a population based on sample data. Businesses use it to test assumptions and validate decisions.
The process typically involves:
For example, a retailer may test whether a new advertising campaign has significantly increased sales. If the hypothesis test shows a statistically significant difference, management can confidently implement the campaign on a larger scale. Thus, hypothesis testing transforms assumptions into measurable conclusions that guide business strategy.
Regression Analysis in Business Statistics
Regression analysis examines the relationship between one dependent variable and one or more independent variables. It helps businesses understand how changes in certain factors influence an outcome. The simple linear regression model explores the effect of one independent variable, such as how advertising spending affects sales. Multiple regression, on the other hand, includes several variables for instance, sales as a function of advertising, price, and customer income.
Regression is widely used for:
By quantifying relationships among variables, regression analysis allows businesses to make data-driven predictions and strategic adjustments.
Time Series Analysis for Business Forecasting
Time Series Analysis involves studying data points collected over time to identify patterns, trends, and seasonal variations. To explore how professionals leverage these analytical techniques to forecast demand, manage risks, and drive strategic decisions, explore Become A Business Analyst a comprehensive guide that highlights essential skills, practical applications, and career pathways for analysts in modern enterprises. It is one of the most valuable tools for business forecasting.
For Example:
Methods such as moving averages, exponential smoothing, and ARIMA models are used to forecast future values. Time series analysis helps businesses anticipate demand, allocate resources efficiently, plan production schedules, and make better investment decisions. Accurate forecasting based on time series data ensures preparedness for market fluctuations and changing consumer behavior.
Statistical Tools for Business Intelligence (BI)
Business Intelligence (BI) integrates statistical tools and data visualization techniques to transform raw data into actionable insights. To explore how professionals streamline workflows, analyze processes, and align BI-driven insights with organizational goals, explore Business Process Analyst Do a practical guide that highlights responsibilities, required skills, and the evolving role of process analysts in modern enterprises. These tools help organizations make faster and more accurate decisions.
Some popular tools and techniques include:
These tools automate complex analyses, making it easier for decision-makers to interpret results without deep statistical expertise. In modern enterprises, BI supported by statistics enhances transparency, agility, and competitiveness.
Conclusion
Business Statistics is an indispensable tool for modern organizations aiming to thrive in a competitive environment. From understanding consumer behavior to forecasting demand and managing risks, statistical methods provide the foundation for intelligent decision-making. To explore how structured training empowers professionals to apply statistical techniques, interpret data, and align insights with business goals, explore Business Analyst Training a comprehensive program that covers consumer analysis, demand forecasting, risk management, and analytics-driven strategies for modern enterprises. By effectively collecting, analyzing, and interpreting data, businesses can turn uncertainty into opportunity. Whether used in marketing, finance, or operations, Business Statistics transforms raw numbers into strategic knowledge empowering organizations to grow, adapt, and succeed in the data-driven world.