Last updated on 28th Oct 2025| 10739
- What is Business Intelligence?
- Evolution of BI
- Importance of BI in Enterprises
- Components of BI
- Data Warehousing Basics
- Reporting & Dashboards
- BI Tools Overview
- Role of BI in Decision Making
- BI for Small Businesses
- Trends in BI
- Challenges in BI Adoption
- Conclusion
What is Business Intelligence?
Business Intelligence (BI) refers to the technologies, strategies, and practices that organizations use to collect, analyze, and present data in a meaningful way. Business Analyst Training helps businesses turn raw data into actionable insights that support decision-making, optimize processes, and drive growth. In today’s data-driven world, BI is no longer a luxury but a necessity for companies that want to stay competitive and innovative.Organisations can use BI data analysis to turn unprocessed data into insights that can be used to inform strategic choices. Businesses may assess performance, spot patterns, and streamline procedures across several departments with BI data analysis. Businesses can improve efficiency, innovation, and long-term growth by using BI Data Analysis to better understand their operations.
Are You Interested in Learning More About Business Analyst? Sign Up For Our Business Analyst Training Today!
Evolution of BI
The concept of BI has evolved significantly over the past few decades. Initially, businesses relied on manual reporting systems and spreadsheets to analyze their operations. With the rise of databases and enterprise systems in the 1980s and 1990s, BI solutions became more sophisticated, focusing on data warehousing and reporting.
- Today, BI has reached a new level with the integration of artificial intelligence (AI), machine learning, and advanced analytics.
- The use of Heatmaps in Power BI has allowed businesses not only to understand past performance but also to predict future outcomes with greater accuracy.
A BI dashboard offers a centralised platform for real-time visualisation of company analytics and key performance indicators. Organisations may track developments, identify trends, and make data-driven choices more effectively with the help of a BI dashboard. Teams may increase cooperation, transparency, and guarantee that stakeholders have prompt access to precise and significant insights by utilising a BI dashboard.
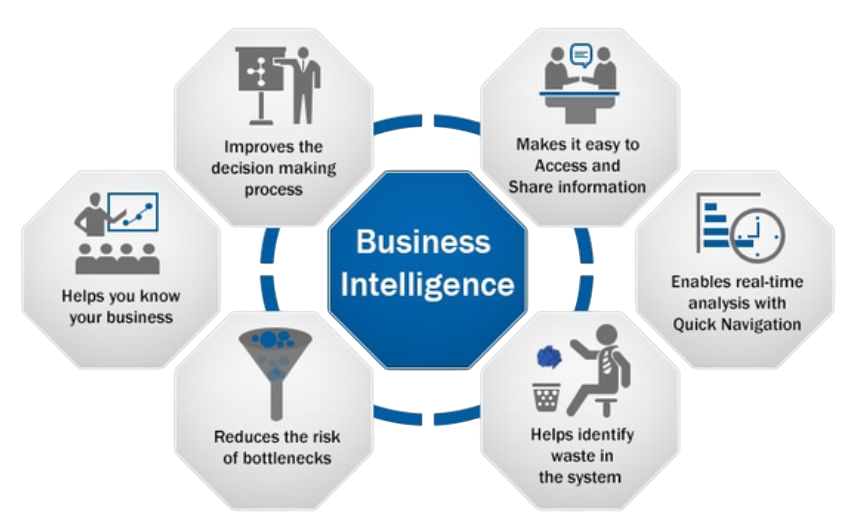
Importance of BI in Enterprises
BI plays a critical role in modern enterprises by providing leaders with the insights they need to make data-driven decisions. It enables organizations to identify market trends, measure performance, track customer behavior, and optimize internal processes. For example, retailers use BI to analyze purchasing patterns, while financial institutions use it to detect fraud. By leveraging BI, enterprises can reduce risks, increase efficiency, and gain a competitive advantage in their respective industries.
By combining analytics, reporting, and visualisation capabilities into a single platform, the Power BI Tool enables businesses to make data-driven choices. Businesses may increase operational effectiveness, obtain real-time insights, and spot growth prospects with Enterprise BI Solutions’ sophisticated data analysis. Businesses may improve strategic planning, optimise operations, and keep a competitive advantage in today’s data-centric market by implementing enterprise BI solutions.
Components of BI
The key components of BI include data sources, data warehousing, ETL (Extract, Transform, Load) processes, reporting, dashboards, and analytics. Data sources provide raw information, while ETL processes clean and prepare data for storage in a data warehouse.
- From there, reporting tools and dashboards make the data accessible and understandable to business users.
- Who is a Business Intelligence Analyst They use advanced analytics techniques, such as predictive modeling, to further enhance the value of BI by uncovering deeper patterns and insights.
Developing a successful business intelligence plan requires an understanding of the components of business intelligence. Together, the BI components data warehousing, analytics, reporting, and visualization convert unprocessed data into insights that can be put to use. Effective integration of BI’s components can help organisations make better decisions, perform better, and obtain a competitive edge in the data-driven world of today.
To Explore Business Analyst in Depth, Check Out Our Comprehensive Business Analyst Training To Gain Insights From Our Experts!
Data Warehousing Basics
A data warehouse is the foundation of most BI systems. It acts as a central repository where data from multiple sources is integrated and stored. Unlike transactional databases, data warehouses are optimized for querying and reporting rather than transaction processing. They provide a structured environment where historical data can be analyzed to identify patterns, trends, and correlations.
- This makes data warehousing essential for organizations that rely heavily on BI for strategic decision-making.
- By examining past data and patterns, predictive analytics helps businesses predict future trends and behaviours.
- Businesses may anticipate client wants, streamline operations, and lower risks across a range of areas by utilising predictive analytics.
An MSBI Developer helps businesses obtain a strategic edge by applying predictive analytics, enabling them to make more informed decisions that spur innovation and expansion. Organisations looking to maintain their competitiveness in a data ecosystem that is changing quickly must keep up with BI trends. The way businesses utilise data to make decisions is changing as a result of emerging BI trends including self-service reporting, real-time analytics, and artificial intelligence integration. Businesses may improve insights, increase agility, and develop faster, more intelligent business strategies by adopting these BI trends.
Reporting & Dashboards
One of the most visible aspects of BI is reporting and dashboards. Reports allow organizations to track key performance indicators (KPIs) and generate summaries of operational or financial data. Dashboards, on the other hand, present this information in a visual format that is easy to interpret. Exploring Top Career Options After BA , modern dashboards often include interactive features such as drill-downs, filters, and real-time updates, enabling decision-makers to explore data dynamically.
- These tools empower executives, managers, and employees at all levels to make informed decisions quickly.
- Dashboards and reporting are essential for turning unprocessed data into understandable, useful insights for decision-makers.
Organisations can track important indicators, keep an eye on performance, and pinpoint areas for development instantly with the help of efficient reporting and dashboards. Businesses may increase openness, foster better teamwork, and promote data-driven plans in all departments by utilising reporting and dashboards.

BI Tools Overview
There are numerous BI tools available in the market, each offering unique features. Popular tools include Microsoft Power BI, Tableau, QlikView, and SAP BusinessObjects.
- These tools allow organizations to visualize data, build interactive dashboards, and perform advanced analytics without requiring deep technical expertise.
- Cloud-based BI platforms are also gaining traction due to their scalability and cost-effectiveness, making BI accessible even to small and medium-sized businesses.
Business Analyst Training helps organisations better grasp the features and advantages of various business intelligence systems by using a BI Tools Overview. Businesses can assess capabilities like data integration, visualisation, and analytics to select the best option for their requirements by using a thorough BI Tools Overview. Businesses can make well-informed decisions that improve data accessibility, reporting accuracy, and overall performance by carrying out a thorough BI Tools Overview.
Role of BI in Decision Making
The primary purpose of BI is to support better decision-making. BI systems provide leaders with accurate, timely, and relevant information to guide their strategies. For instance, marketing teams can use BI to analyze campaign effectiveness, while supply chain managers can identify bottlenecks in distribution.
- With BI, decisions are based on evidence rather than intuition, reducing the likelihood of errors and improving overall organizational performance.
- Organisations aiming to become data-driven must comprehend the role of Top Business Analytics Tools in business intelligence (BI) and decision-making.
In order to produce actionable insights that direct strategic and operational decisions, business intelligence (BI) is used in the collection, analysis, and visualisation of data. Businesses may increase productivity, lower risks, and guarantee that every choice is backed by timely and reliable information by highlighting the role of business intelligence (BI) in decision-making.
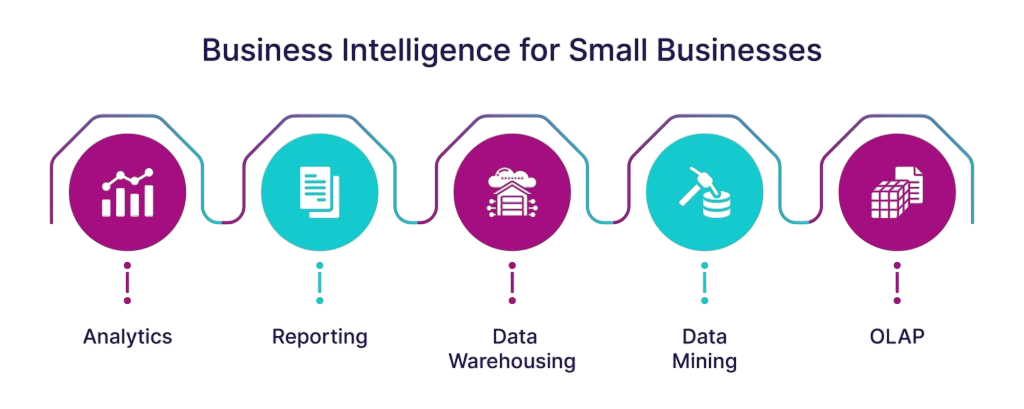
BI for Small Businesses
While BI was once considered suitable only for large corporations, today it is equally valuable for small businesses. Affordable and user-friendly BI tools allow small companies to gain insights into customer preferences, sales trends, and operational efficiencies. By leveraging BI, small businesses can compete with larger players by making smarter decisions, identifying niche opportunities, and improving customer satisfaction.
Without the need for extensive infrastructure, BI for Small Businesses enables business owners to make more informed decisions based on data. Businesses can use easily accessible and reasonably priced analytics tools, along with Time Series Analysis Tactics , to track sales patterns, monitor performance, and spot growth prospects by deploying BI for Small Businesses. Small business owners may increase productivity, boost customer happiness, and more successfully compete in the competitive market of today by utilising BI.
Trends in BI
The future of BI is being shaped by several key trends. Self-service BI is empowering non-technical users to explore data independently without relying on IT teams. Artificial intelligence and machine learning are enhancing BI by enabling predictive and prescriptive analytics.
- Mobile BI is making data accessible anytime and anywhere, while real-time analytics is allowing organizations to respond quickly to changing conditions.
- Understanding What is Six Sigma? helps illustrate how BI is becoming more intelligent, accessible, and integrated into daily business operations.
For businesses hoping to use data to gain a competitive edge, keeping abreast of BI trends is essential. Self-service dashboards, real-time reporting, and AI-driven analytics are some of the emerging BI trends that are revolutionising how companies derive insights from data. Businesses may improve decision-making, streamline processes, and maintain an advantage in a market that is changing quickly by using the newest BI trends.
Preparing for Business Analyst Job? Have a Look at Our Blog on Business Analyst Interview Questions and Answers To Ace Your Interview!
Challenges in BI Adoption
Despite its benefits, adopting BI comes with challenges. Data quality issues, such as inconsistent or incomplete data, can hinder the effectiveness of BI systems. Integrating data from multiple sources is often complex, requiring significant investment in infrastructure. Additionally, organizations may face resistance from employees who are unfamiliar with BI tools or skeptical of data-driven decision-making. Overcoming these challenges requires proper planning, training, and a strong data governance framework.
Conclusion
Business Analyst Training in Business Intelligence is a powerful approach that enables organizations to harness the value of data for smarter decision-making. From its evolution in simple reporting to today’s AI-driven insights, BI has become an indispensable tool for enterprises of all sizes. By understanding its components, applications, and challenges, businesses can implement effective BI strategies that enhance performance, drive innovation, and secure long-term success in an increasingly competitive world.