 LMS
LMS
Last updated on 28th Apr 2026| 6183
 (5.0) | 19876 Ratings
E-mail this post
(5.0) | 19876 Ratings
E-mail this post
- Introduction to Data Analytics Without Coding
- Essential Skills for Non‑Coding Analysts
- Visualization and Dashboard Tools
- Cloud‑Based Analytics Platforms
- Learning Through Online Resources
- Building Practical Experience Without Coding
- Job Preparation and Career Growth
- Conclusion
Introduction to Data Analytics Without Coding
Data analytics is often associated with programming, but freshers can begin their journey without writing a single line of code. he rise of no-code platforms has democratized analytics, making it accessible to those with business or domain expertise. Data Analytics Without Coding tools allow users to collect, clean, and visualize data through intuitive interfaces. For freshers, this means they can focus on understanding data rather than struggling with syntax. Data Analytics Training helps build the right skills to effectively use these tools and understand data-driven decision-making. Employers increasingly value analysts who can interpret insights and communicate them effectively. No‑code analytics careers are ideal for those who want to combine analytical thinking with business problem‑solving. Ultimately, breaking into analytics without coding is about leveraging the right tools and developing strong interpretive skills.
Essential Skills for Non‑Coding Analysts
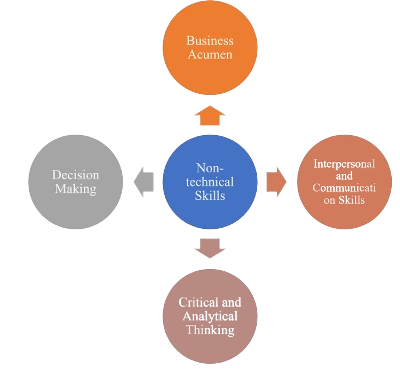
- Analytical Thinking: Freshers must learn to approach problems logically. Analytical thinking helps identify trends, patterns, and anomalies in datasets. It ensures that insights are meaningful and aligned with business goals. This skill also supports decision‑making under uncertainty. It helps analysts break down complex problems into manageable steps. Over time, strong analytical thinking builds confidence in tackling diverse challenges.
- Data Literacy: Understanding how data is structured and what it represents is crucial. Freshers should learn concepts like data types, metrics, and KPIs. Data literacy builds confidence in handling information. It also prevents misinterpretation of datasets. Developing this skill ensures accuracy in reporting and analysis. With strong data literacy, analysts can communicate findings more effectively. Learning through Data Science Solutions helps strengthen these skills and apply them in real-world scenarios.
- Visualization Skills: Presenting data clearly is a core skill. Freshers should practice creating charts, dashboards, and reports. Visualization ensures stakeholders can grasp insights quickly. It also enhances storytelling by making complex data accessible. Effective visuals reduce confusion and improve decision‑making. Mastering visualization tools helps analysts stand out in competitive job markets.
- Business Acumen: Analysts must connect data to business outcomes. Freshers should study industry trends and organizational goals. Business acumen ensures analytics adds value beyond numbers. It helps analysts align insights with strategic objectives. Strong business knowledge improves collaboration with non‑technical teams. Over time, this skill positions analysts as trusted advisors in organizations.
- Communication Skills: Explaining insights to non‑technical audiences is vital. Freshers should practice storytelling with data. Strong communication bridges the gap between analysis and decision‑making. It also builds trust with stakeholders. Clear communication ensures insights are actionable and impactful. Developing this skill enhances career growth and leadership potential in Data Analyst.
Ready to Pursue Your Data Analytics Certificate? View The AWS Training Offered By ACTE Right Now!
Visualization and Dashboard Tools
Visualization tools are the backbone of no‑code analytics. Platforms like Tableau, Power BI, and Google Data Studio allow freshers to create interactive dashboards without programming. No‑code platforms simplify complex datasets into charts and graphs that highlight key insights. Freshers can drag and drop fields to build visuals, making the process intuitive. Visualization enhances storytelling, enabling analysts to present findings in ways that resonate with stakeholders. Using Power BI Dashboard, analysts can create interactive dashboards that support real-time monitoring, which is critical in fast-paced industries. By mastering visualization tools, freshers can quickly demonstrate their value in data-driven organizations.

Cloud‑Based Analytics Platforms
- Google BigQuery: A cloud‑based platform that allows large‑scale data analysis without coding. Freshers can run queries using simple interfaces. It supports integration with visualization tools. BigQuery also offers strong scalability for handling massive datasets. Its seamless integration with Google Cloud services enhances usability. Beginners benefit from its pay‑as‑you‑go model, which reduces upfront costs.
- AWS QuickSight: Amazon’s analytics service designed for business users. It enables interactive dashboards and predictive insights. Freshers benefit from its scalability and ease of use. Tableau Careers also align well with similar visualization and analytics skills. QuickSight supports machine learning features for advanced analytics. It integrates smoothly with other AWS services for end-to-end solutions. Its user-friendly interface makes it accessible even to non-technical professionals.
- Microsoft Azure Synapse: Provides powerful analytics capabilities with minimal coding. Freshers can explore data warehouses and build reports using SQL. Integration with Power BI enhances usability. Synapse supports real-time analytics for faster decision-making. It offers strong security features to protect sensitive data. Beginners can leverage its guided workflows to simplify complex tasks.
- Snowflake: A modern cloud data platform that simplifies storage and analysis. Freshers can manage datasets and collaborate easily. Its intuitive design reduces technical barriers. Snowflake’s elastic scaling ensures performance even with growing data. It supports secure data sharing across organizations. Its multi‑cloud compatibility makes it versatile for diverse business needs.
- Zoho Analytics: A beginner‑friendly platform offering drag‑and‑drop analytics. Freshers can create dashboards and reports quickly. It is ideal for small businesses and entry‑level analysts. Zoho provides AI‑powered insights for smarter reporting. Its mobile accessibility allows users to monitor dashboards on the go. Affordable pricing makes it a practical choice for startups and individuals.
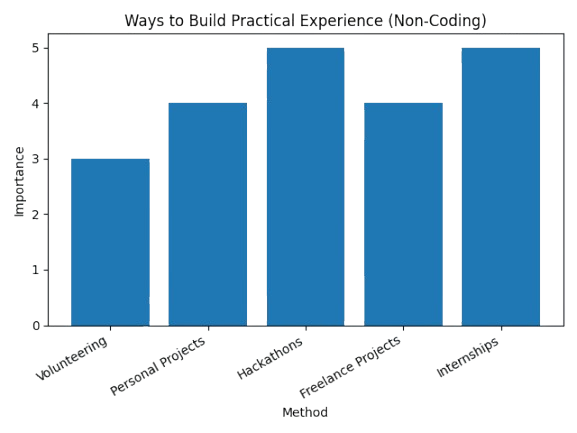
- Internships: Many companies offer roles focused on visualization and reporting. Freshers can gain exposure to real‑world datasets. Internships build confidence and industry credibility. They also provide mentorship opportunities from experienced analysts. Internships often lead to full‑time roles if performance is strong. Exposure to corporate tools and workflows enhances technical readiness.
- Freelance Projects: Platforms like Upwork and Fiverr provide opportunities to work on analytics tasks. Freshers can practice building dashboards for clients. Freelancing enhances portfolios. It also teaches client communication and project management skills. Freelance work helps freshers understand diverse industry requirements. Over time, freelancing builds independence and entrepreneurial thinking. Using Power BI Tool is Best for Data Visualization can further help freshers create impactful dashboards and improve their data visualization skills for real-world projects.
- Hackathons: Data visualization hackathons allow freshers to showcase creativity. These events provide exposure to industry challenges. Participation demonstrates initiative and skill. Hackathons also encourage teamwork and collaboration. They simulate real‑world problem‑solving under time constraints. Winning or even participating adds credibility to resumes.
- Personal Projects: Analyzing public datasets builds practical knowledge. Freshers can create dashboards on topics like sports or finance. Personal projects strengthen resumes. Publishing these projects online demonstrates initiative. They also showcase creativity and domain interest. Personal projects often become talking points in interviews. Enrolling in Data Analytics Training can further help freshers gain structured guidance and improve their practical skills.
- Volunteering: Non‑profits often need help with reporting. Freshers can contribute by building dashboards. Volunteering adds experience and social impact. It also builds empathy and community engagement. Volunteering projects highlight social responsibility on resumes. These experiences often lead to networking opportunities with professionals.
Excited to Obtaining Your Data Analytics Certificate? View The Data Analytics Training Course Offered By ACTE Right Now!
Learning Through Online Resources
Freshers can build strong foundations in analytics through online resources. Platforms offer beginner‑friendly courses on no‑code tools. YouTube tutorials and blogs provide practical demonstrations of dashboards and reports. Many tools also offer free community editions, allowing learners to practice hands‑on. Online communities such as Kaggle and LinkedIn groups provide networking and peer learning opportunities. Freshers should adopt a habit of continuous learning, as analytics trends evolve rapidly. Start Career In Data Analytics helps beginners understand the right path to enter this field. Self-learning builds independence and adaptability, which are critical in this field. Ultimately, online resources empower freshers to learn at their own pace and gain practical exposure. Structured certifications add credibility to self-learning efforts. Peer discussions also help clarify doubts and accelerate growth. Over time, consistent online learning builds confidence and prepares freshers for industry challenges.
Are You Considering Pursuing a Data Analytics Master’s Degree? Enroll For Data Analytics Expert Masters Program Training Course Today!
Building Practical Experience Without Coding
Set to Ace Your Data Analytics Job Interview? Check Out Our Blog on Data Analytics Interview Questions & Answer
Job Preparation and Career Growth
Preparing for a career in no‑code analytics requires strategic planning. Freshers should build strong resumes highlighting skills in visualization tools and cloud platforms. Networking through LinkedIn and industry events helps in discovering opportunities. Practicing interview questions on dashboards, KPIs, and business scenarios is essential. Employers look for candidates who can demonstrate problem-solving abilities. Understanding concepts through Business Intelligence vs Data Analytics can further strengthen clarity and improve interview performance. Career growth depends on continuous learning and adapting to new technologies. Freshers should set short‑term goals like securing internships and long‑term goals like specialization. With persistence and preparation, freshers can achieve steady career progression in analytics. Mentorship from industry professionals accelerates learning. Certifications also provide structured pathways to career advancement.
Conclusion
Breaking into data analytics without coding is not only possible but increasingly common. With the rise of no‑code platforms, freshers can focus on interpreting data and delivering insights. Building skills in visualization, business acumen, and communication ensures employability. Practical experience through internships, projects, and volunteering strengthens confidence. Certifications and online learning platforms provide credibility and structured growth. The field of analytics is dynamic, requiring adaptability and continuous learning. Enrolling in Data Analytics Training can help freshers gain structured knowledge and industry-ready skills. By embracing these strategies, freshers can unlock rewarding careers and contribute meaningfully to the data‑driven world.