Last updated on 06th Sep 2025| 11913
- Introduction
- What is an Algorithm?
- Characteristics of Algorithms
- What is a Flowchart?
- Flowchart Symbols
- Creating a Flowchart
- Algorithm vs Flowchart: Key Differences
- Pros and Cons of Algorithms
- Pros and Cons of Flowcharts
- When to Use Each
- Real-Life Examples
- Summary
Introduction
In problem-solving and programming, clarity and planning are crucial. Two foundational tools used to approach complex tasks are Algorithms and Flowchart. Though both aim to simplify and represent solutions, they serve different purposes and are applied at different stages of planning an important distinction emphasized in Web Developer Training, where learners explore how flowcharts, wireframes, and algorithmic logic contribute to structured development workflows. By understanding the role of each planning tool, developers can streamline coding, improve collaboration, and enhance project clarity from concept to deployment. Understanding the role of Algorithms and Flowchart helps developers, students, and engineers break down problems logically and communicate them effectively.
To Earn Your Web Developer Certification, Gain Insights From Leading Web Developer Experts And Advance Your Career With ACTE’s Web Developer Courses Today!
What is an Algorithm?
An algorithm is a step-by-step set of instructions to solve a specific problem or perform a task a logical foundation that complements component behavior and data flow in Mastering State in React JS, where learners explore how state updates, hooks, and controlled components drive dynamic user interfaces. Understanding algorithmic thinking alongside state management empowers developers to build predictable, scalable React applications with clean architecture and responsive logic. It is a logical sequence of operations written in natural language, pseudocode, or programming language. Algorithms form the basis of all computer programs and systems. For example, an algorithm to add two numbers might look like this:
- Start
- Input two numbers A and B
- Add A and B, store result in C
- Display C
- Stop
Among these, the Circular Linked List is unique because it forms a continuous loop, allowing for efficient use in certain applications like buffering and round-robin scheduling.
Characteristics of Algorithms
A well-structured algorithm has the following essential characteristics:
- Finiteness: It must terminate after a finite number of steps.
- Definiteness: Each step must be clearly and unambiguously defined.
- Input: It should have zero or more inputs from an external source.
- Output: It must produce at least one output as a result.
- Effectiveness: All operations must be basic enough to be performed easily.
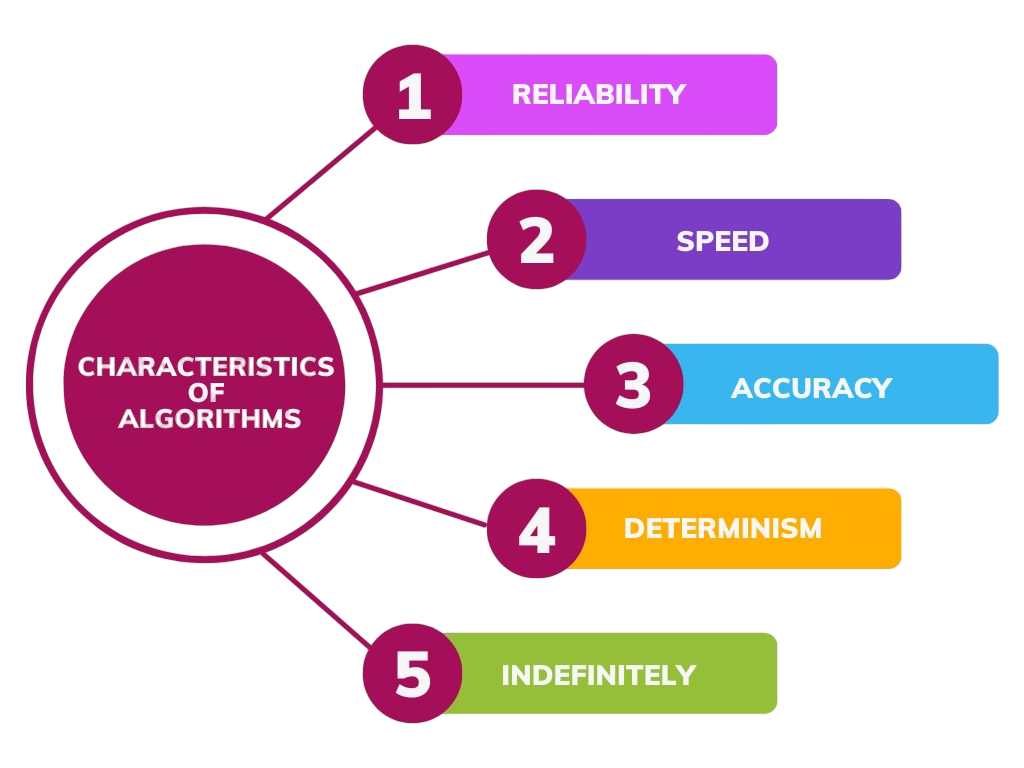
These characteristics ensure that the algorithm is practical, efficient, and implementable.
What is a Flowchart?
A flowchart is a diagrammatic or visual representation of a process or algorithm. It uses standardized symbols to depict different types of actions, decisions, and processes, with arrows showing the flow of control. Flowcharts help in visualizing logic, identifying bottlenecks, and improving communication between teams especially relevant in Frontend vs Backend Explained, where learners explore how data flows between client-side interfaces and server-side logic. Understanding these visual tools enhances collaboration and clarity across full-stack development workflows.
- Visualizing logical flow
- Identifying potential errors or loops
- Communicating ideas among team members
For example, a flowchart for the same task of adding two numbers would use shapes like parallelograms for input/output, rectangles for processing, and arrows for direction.
Would You Like to Know More About Web Developer? Sign Up For Our Web Developer Courses Now!
Flowchart Symbols
Understanding flowchart symbols requires familiarity with standard symbols visual logic tools that play a key role in planning and debugging, as emphasized in Web Developer Training, where learners explore structured development workflows, algorithmic thinking, and diagrammatic clarity. Mastering these symbols helps developers communicate processes effectively, streamline coding stages, and enhance collaboration across design and engineering teams.
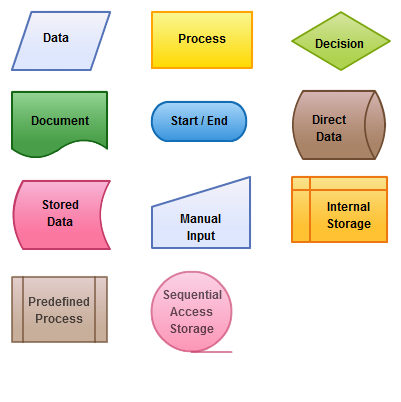
Understanding the symbols in process mapping can improve how we visualize and communicate our workflows. Each symbol has a specific purpose. An oval marks the start or end of a process, while a parallelogram shows input or output operations. The rectangle is important for illustrating the processing or computational steps, and the diamond represents decision-making points that guide the flow of operations. Arrows are crucial because they indicate the direction of the process flow, helping to connect all elements clearly. By learning these symbols, you can create more effective and engaging process maps that boost collaboration and understanding within your team.

Develop Your Skills with Web Developer Certification Course
Weekday / Weekend BatchesSee Batch DetailsCreating a Flowchart
Creating a flowchart involves several steps: identifying the process, defining start and end points, mapping decisions, and connecting actions with directional arrows an approach that mirrors structured planning in Front End Developer Salary, where learners explore how skillset, experience, and location influence compensation across tech hubs. Just as flowcharts clarify logic, understanding salary breakdowns helps developers navigate career paths with informed expectations.
- Define the problem: Clearly understand the task you want to visualize.
- List the steps: Based on your algorithm, jot down each action in order.
- Select appropriate symbols: Use standard symbols for each type of action.
- Draw the flow: Connect the symbols with arrows showing the process flow.
- Review and test: Walk through the flowchart with test data to verify its correctness.
Tools like Lucidchart, Draw.io, or even pen-and-paper can be used to sketch flowcharts easily.
Are You Interested in Learning More About Web Developer? Sign Up For Our Web Developer Courses Today!
Algorithm vs Flowchart: Key Differences
| Feature | Algorithm | Flowchart |
|---|---|---|
| Definition | Step-by-step textual instruction | Graphical representation of a process |
| Format | Written in pseudocode or language | Visual using symbols and arrows |
| Clarity | Requires understanding of instructions | Easier to understand due to visual format |
| Debugging | Harder to spot errors visually | Easier to trace logic and mistakes |
| Time Consumption | Faster to write | Takes more time to create |
| Usage | Ideal for logic creation | Ideal for documentation or communication |
| Adaptability | Easier to modify quickly | Modifications can be tedious graphically |
Algorithm vs Flowchart Both are complementary tools and often used together in the design phase of software development.
Pros and Cons of Algorithms
Pros:
- Precise and concise: Easy to write and understand if logic is clear.
- Language-independent: Can be implemented in any programming language.
- Scalable: Algorithms can be expanded to handle complex problems.
- Flexible: Easy to modify logic without redrawing anything.
Cons:
- Abstract: Not as intuitive as visuals for beginners.
- Not interactive: Doesn’t provide a real-time view of flow.
- May miss logical flaws: Errors may not be obvious without visual tracking.
Pros and Cons of Flowcharts
Pros:
- Visual clarity: Easy for anyone to follow logic at a glance.
- Better debugging: Helps identify looping or logical errors easily.
- Great for presentations: Helpful in team discussions and client demos.
- Step-by-step flow: Encourages systematic thinking.
Cons:
- Time-consuming: Takes longer to draw, especially for complex logic.
- Less detailed: Doesn’t show code-level detail.
- Difficult to update: Editing one step may affect the entire structure.
- Limited scalability: Large systems can result in cluttered flowcharts.
When to Use Each
Use Algorithms:
- During early planning or ideation of a program
- When explaining logic to technical team members
- To write pseudocode before coding
Use Flowcharts:
- When presenting ideas to non-technical stakeholders
- For training or teaching beginners
- When documenting existing systems for visualization
Ideally, you might start with an algorithm and then draw a flowchart to present the same logic to others in a more understandable form a visualization technique that complements the structured communication principles taught in HTTP Request Methods, where learners explore how GET, POST, PUT, DELETE, and other verbs define client-server interactions. By combining algorithmic thinking with visual mapping, developers can design clearer, more efficient APIs and web services.
Real-Life Examples
Algorithms and flowcharts are useful visual tools that clearly outline processes in different areas. They show how complex steps can be represented efficiently. In the ATM withdrawal example, the algorithm details each step from inserting a card to receiving cash a sequential logic model that mirrors the structured workflows taught in End-to-End Web Development, where learners explore how Angular and Node.js integrate to build full-stack applications. By mastering client-server communication, routing, and modular architecture, developers can design seamless user experiences backed by robust backend logic. The flowchart shows a graphical version with decision points like PIN verification and balance checks. In the cooking process illustration, these tools capture important details, such as ingredient preparation, temperature checks, and possible branching paths. By using these techniques together, professionals can explain complicated workflows clearly. This helps everyone understand and standardize processes in various fields.
Summary
Algorithms and flowcharts are essential tools that support each other in programming, education, and systems design. Algorithms express logic in structured text, while flowcharts provide a visual outline of computational processes. Developers and designers can effectively use these tools by applying algorithms during the planning and coding stages and using flowcharts for presentations and debugging practical techniques emphasized in Web Developer Training, where learners gain hands-on experience with structured logic, visual planning, and iterative development. By integrating algorithmic thinking and diagrammatic clarity, designers can streamline workflows and enhance both functionality and maintainability in web projects. Mastering both methods leads to better design thinking, improved error detection, and stronger team collaboration in technical and business projects. By recognizing the unique strengths of algorithms and flowcharts, professionals can develop more robust, clear, and well-organized solutions that combine textual detail with visual clarity.