
Last updated on 30th Oct 2025| 12972
- Data Visualization in React
- Popular Chart Libraries for React
- Setting Up Chart.js in React
- Creating Line and Bar Charts in React
- Pie and Doughnut Charts in React
- Customizing Charts in React
- Interactive Charts with D3.js
- Handling Large Data Sets in Charts
- Animations and Transitions in React Chart Libraries
- Best Practices for Implementing Charts in React
- Conclusion
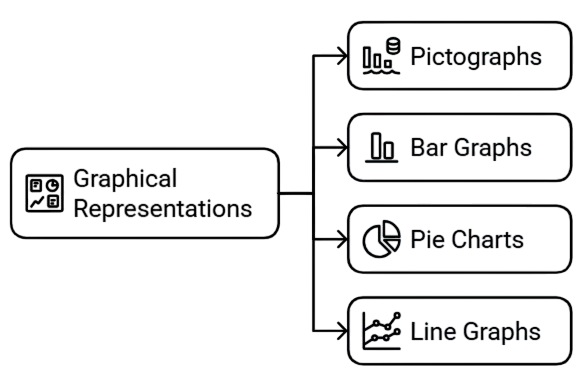
Data Visualization in React
Data visualization is a cornerstone of modern web applications, allowing developers to present complex data in an intuitive and engaging way. In React, charts are widely used to display trends, patterns, and insights in dashboards, reporting tools, and analytics platforms. To understand how chart components integrate with backend data sources and real-time updates, explore Full Stack Training a hands-on program that covers data visualization, API integration, and full stack coordination for building interactive, insight-driven web applications. React’s component-based architecture makes it easy to create reusable, interactive charts that respond dynamically to state changes. From simple line charts to advanced interactive dashboards, integrating charts into React applications significantly enhances user understanding and decision-making.
Popular Chart Libraries for React
The React ecosystem offers numerous charting libraries tailored for different needs. Chart.js (via react-chartjs-2) is a popular choice for its simplicity and versatility. To complement visualizations with interactive UI components, explore React Drag and Drop a practical module within full stack development that teaches how to implement intuitive drag-and-drop interfaces using libraries like React DnD and react-beautiful-dnd for dynamic dashboards and data manipulation.
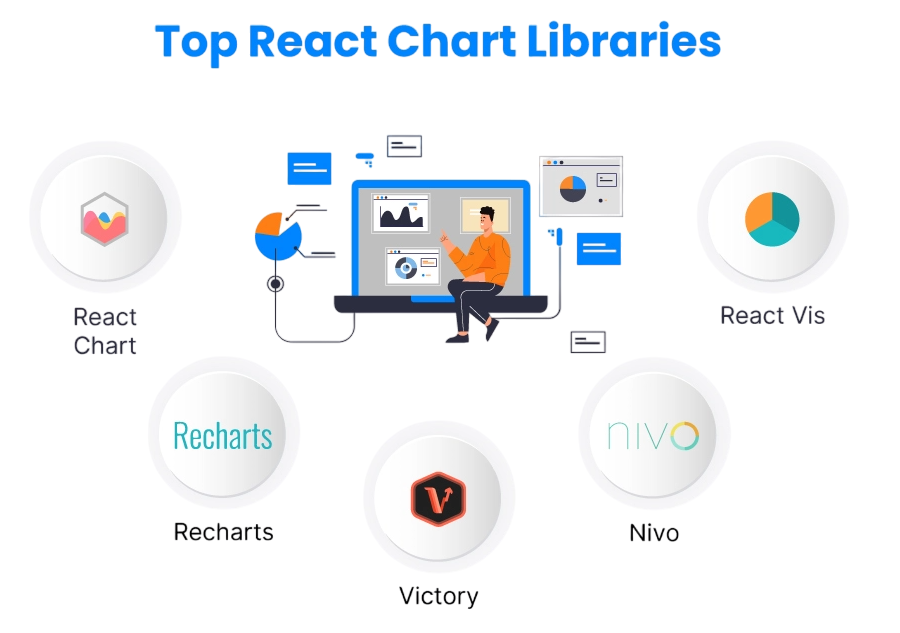
Recharts provides composable charts with a declarative API, while Victory offers modular components and built-in animations. Nivo delivers responsive charts with rich customization options. For advanced and highly interactive visualizations, D3.js remains a powerful tool, though it has a steeper learning curve. Choosing the right library depends on your project requirements, including interactivity, performance, and aesthetic preferences.
Are You Interested in Learning More About Full Stack Developer? Sign Up For Our Full Stack Developer Training Today!
Setting Up Chart.js in React
Getting started with Chart.js in React is straightforward using the react-chartjs-2 wrapper. Begin by installing the packages and configuring your chart components. To understand how these visual layers integrate with component hierarchies, state management, and rendering logic, explore React JS Architecture a structured guide that explains how React’s declarative model supports scalable UI design, data-driven rendering, and modular chart integration.
- npm install chart.js react-chartjs-2
Once installed, you can import chart components like Line, Bar, Pie, or Doughnut. The library’s integration allows developers to quickly render charts with minimal setup, making it ideal for both small-scale and enterprise applications.
Would You Like to Know More About Full Stack Developer? Sign Up For Our Full Stack Developer Training Now!
Creating Line and Bar Charts in React
Line charts are ideal for tracking trends over time, while bar charts excel at comparing categories. With Chart.js, creating these charts is as simple as providing a data object and labels.
- import { Line, Bar } from ‘react-chartjs-2’;
- const lineData = {
- labels: [‘Jan’, ‘Feb’, ‘Mar’, ‘Apr’],
- datasets: [{ label: ‘Sales’, data: [120, 150, 170, 200], borderColor: ‘blue’ }],
- };
- const barData = {
- labels: [‘Product A’, ‘Product B’, ‘Product C’],
- datasets: [{ label: ‘Revenue’, data: [100, 200, 150], backgroundColor: [‘red’,’blue’,’green’] }],
- };
These charts automatically update when the data changes, supporting React’s reactive state management.

Develop Your Skills with Full Stack Developer Certification Training
Weekday / Weekend BatchesSee Batch DetailsPie and Doughnut Charts in React
Pie and doughnut charts are used to visualize proportions and percentages. Chart.js provides built-in components for these chart types, allowing customization of colors, labels, and tooltips. To understand how these visual elements integrate with component-based design, event handling, and responsive layouts, explore Front End Developer Guide a practical resource that covers chart integration, UI architecture, and essential skills for building dynamic, data-driven interfaces.
- import { Pie, Doughnut } from ‘react-chartjs-2’;
- const pieData = {
- labels: [‘Chrome’, ‘Firefox’, ‘Safari’],
- datasets: [{ data: [60, 25, 15], backgroundColor: [‘blue’,’orange’,’green’] }],
- };
Pie charts highlight distributions, while doughnut charts offer a modern variant with a hollow center, often used in dashboards.
Customizing Charts in React
Modifying charts is key to making them easier to read and ensuring they match the look of your application. Developers can change colors, gradients, and fonts to add a personal touch. They can also set up tooltips and legends to give users clear information about the data. These enhancements improve chart readability and user interaction, especially in analytics dashboards and reporting tools. To learn how such features integrate with backend data and real-time updates, explore Full Stack Training a comprehensive program that covers data visualization, API coordination, and full stack workflows for building responsive, insight-driven web applications. Adjusting axes, gridlines, and scales is another important way to make charts clearer and more useful. Using responsive layouts and themes makes sure charts look good on different devices and screen sizes. Libraries like Chart.js, Recharts, Victory, and Nivo provide many ways to change charts through props, option settings, or themes, helping developers create charts that are both functional and visually pleasing.
Preparing for Full Stack Development Job? Have a Look at Our Blog on Full Stack Development Interview Questions and Answers To Ace Your Interview!
Interactive Charts with D3.js
For complex interactivity, D3.js remains the gold standard. It allows zooming, panning, animated transitions, and real-time updates. When combined with React, D3.js enables developers to manipulate SVG elements or canvas directly, creating highly customized visualizations beyond standard chart types.
- import * as d3 from ‘d3’;
- import { useEffect, useRef } from ‘react’;
- function D3Chart({ data }) {
- const ref = useRef();
- useEffect(() => {
- const svg = d3.select(ref.current).attr(‘width’,400).attr(‘height’,200);
- svg.selectAll(‘circle’).data(data).join(‘circle’)
- .attr(‘cx’,(d,i)=>i*50+25)
- .attr(‘cy’, d=>200-d)
- .attr(‘r’,10).attr(‘fill’,’blue’);
- }, [data]);
- return <svg ref={ref}></svg>;
- }
Handling Large Data Sets in Charts
When working with big sets of data, how quickly they appear can be a problem. Programmers have some ways to make things better, such as implementing lazy loading, virtualization, and pagination to improve performance. To learn how these techniques fit into component design and rendering logic, explore ReactJS Tutorial a step-by-step guide that covers performance optimization, state handling, and best practices for building responsive, data-driven React applications.
One way is to group similar data together before showing it, making things simpler. Another is to only load parts of the chart as they are needed, so not everything loads at once. Canvas rendering is often better than SVG for big charts because it performs better. Using Web Workers to handle complicated calculations in the background also helps keep the program running smoothly. Using these methods can keep charts running well, even with lots of data.
Animations and Transitions in React Chart Libraries
Animations improve the user experience by visually representing data changes. Libraries like Chart.js provide built-in animation support, while Victory and Nivo offer custom transitions. To enhance user experience during data fetches and rendering delays, explore Use of React Loader a practical guide that explains how to implement loading indicators, skeleton screens, and asynchronous feedback mechanisms for smoother, more responsive React applications. Animations should be used thoughtfully to enhance clarity without overwhelming the user.
- const options = { animation: { duration: 1000, easing: ‘easeInOutQuad’ } };
Smooth transitions make charts more engaging, particularly in dashboards displaying frequently updated data.
Best Practices for Implementing Charts in React
- Choose the right chart type for the dataset.
- Keep charts simple and readable.
- Ensure responsiveness for all devices.
- Optimize for performance, especially with large datasets.
- Use consistent color schemes and legends.
- Separate chart logic into reusable components.
- Document data transformations for maintainability.
- Test with real-world data for accuracy and usability.
Following these best practices results in charts that are functional, visually appealing, and performant.
Conclusion
React chart Libraries are indispensable for modern applications requiring data visualization. Whether using Chart.js for basic charts, Recharts or Victory for modular visualizations, or D3.js for advanced interactivity, developers have a wide range of tools to create effective dashboards and reporting tools. To master how these libraries connect with backend data, real-time updates, and full stack workflows, explore Full Stack Training a hands-on program that teaches data visualization, API integration, and scalable architecture for building insight-driven web applications. Handling large datasets, integrating live data, customizing visuals, and optimizing performance ensures that React chart Libraries remain a powerful solution for web developers. By adhering to best practices and leveraging the capabilities of modern React libraries, teams can transform raw data into actionable insights and deliver an engaging user experience.