
Last updated on 21st Apr 2025| 9371
- A Normal Distribution: What Is It?
- Kurtosis: What is it?
- Types of Kurtosis
- Recognizing Over-Kurtosis?
- Skewness: What is it?
- The Formula for Skewness
- How the Skewness Coefficient is Calculated
- Conclusion
A Normal Distribution: What Is It?
A normal distribution (Gaussian distribution) is one of the most commonly used probability distributions in statistics. It represents a bell-shaped curve where most data points cluster around the Mean, and fewer data points appear as you move farther from the Mean. This distribution is symmetric, meaning that the left side of the curve is a mirror image of the right side. The normal distribution is essential because many real-world variables, such as human heights, IQ scores, test results, and measurement errors, tend to follow this pattern. Understanding the normal distribution is foundational to grasping the concepts of Skewness and kurtosis. A normal distribution is defined by several key characteristics that make it a fundamental concept in statistics. Firstly, it is symmetric around the mean, meaning the mean, median, and mode all coincide at the center of the distribution, a property often discussed in Data Science Training. This symmetry results in a bell-shaped curve, which peaks at the mean and gradually tapers off toward both extremes. One of the most well-known properties of the normal distribution is the 68-95-99.7 rule, which states that approximately 68% of data points lie within one standard deviation from the mean, 95% within two standard deviations, and 99.7% within three standard deviations. Mathematically, the normal distribution is described by its probability density function (PDF): f(x∣μ,σ2)=1σ2πexp(−(x−μ)22σ2)f(x|\mu,\sigma^2) = \frac{1}{\sigma \sqrt{2\pi}} \exp \left( -\frac{(x – \mu)^2}{2\sigma^2} \right)f(x∣μ,σ2)=σ2π1exp(−2σ2(x−μ)2) . In this equation, μ (mu) represents the mean of the distribution, σ (sigma) is the standard deviation, and x is a value from the distribution. This function captures the likelihood of different outcomes within a normally distributed dataset.
Are You Interested in Learning More About Data Science? Sign Up For Our Data Science Course Training Today!
Kurtosis: What Is It?
Kurtosis is a statistical measure that describes the shape of the tails and the sharpness of the peak of a distribution in comparison to a normal distribution. In simple terms, kurtosis helps us understand the presence of extreme values (outliers) in a dataset and how tall or flat the distribution’s peak is, a key concept for building a Successful Career in Data Science. A mesokurtic distribution, which is the normal distribution, has a kurtosis value of 3, indicating a moderate peak and typical tail behavior.
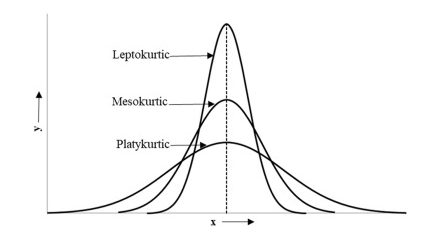
Distributions with a kurtosis greater than 3 (leptokurtic) have a sharper peak and heavier tails, meaning they contain more extreme values or outliers. Conversely, a kurtosis less than 3 (platykurtic) indicates a flatter peak and lighter tails, with fewer extreme values. By examining kurtosis, we gain insights into whether data points are tightly clustered around the mean or more widely dispersed, helping analysts identify unusual patterns in the data.
Types of Kurtosis
- Mesokurtic: A distribution with a kurtosis value of 3, similar to the normal distribution, having a moderate peak and standard tail behavior, indicating no extreme outliers.
- Leptokurtic: A distribution with a kurtosis value greater than 3, characterized by a sharp peak and heavy tails, which suggests a higher occurrence of extreme values or outliers.
- Platykurtic: A distribution with a kurtosis value less than 3, featuring a flatter peak and lighter tails, indicating fewer extreme values and a more evenly spread data set.
- Excess Kurtosis: A measure of how much a distribution’s kurtosis deviates from 3, where positive excess kurtosis indicates leptokurtic behavior and negative excess kurtosis indicates platykurtic behavior, a concept that can be understood alongside How to Use IF ELSE Statements in Python.
- Heavy-Tailed (Hyperbolic) Distributions: Distributions with very high kurtosis, often seen in financial data, that have extremely heavy tails, implying a greater frequency of extreme outliers or events.
- Kurtosis and Risk Assessment: The kurtosis value of a distribution can be crucial for risk management. Leptokurtic distributions, with their heavy tails, often indicate higher risk and the potential for extreme, unpredictable events, making them particularly relevant in finance, insurance, and other fields where rare but impactful occurrences are of concern.
- Role in Statistical Modeling: Understanding kurtosis is essential in statistical modeling, especially when making assumptions about the data’s underlying distribution. Models that assume normality (mesokurtic) might fail when dealing with data that exhibits leptokurtic or platykurtic characteristics, affecting the accuracy and robustness of predictions.
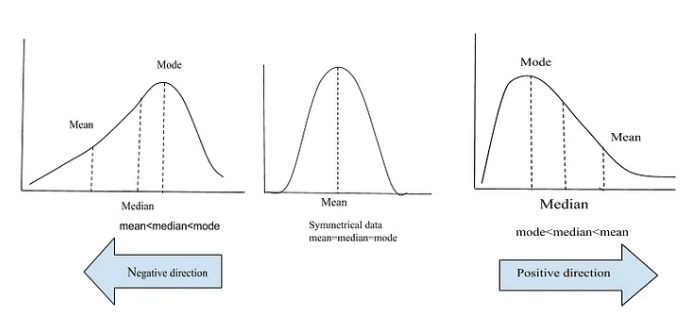
- Positive Skew (Right Skew): When the right tail (larger values) is longer than the left tail, the distribution is positively skewed. This indicates that most of the data points are clustered on the lower end, with a few larger values pulling the Mean toward the right.
- No Skew (Symmetry): If the distribution is symmetric, there is no skew, and the data points are evenly distributed around the Mean, a key concept explored in Data Science vs Data Analytics vs Machine Learning.
- Negative Skew (Left Skew): The distribution is negatively skewed when the left tail (smaller values) is longer than the right tail. This indicates that most data points are clustered on the higher end, with a few smaller values pulling the Mean toward the left.
- nn is the number of data points,
- xix_i represents individual data points,
- xˉ\bar{x} is the Mean of the dataset,
- Ss is the standard deviation.
- 0 indicates a perfectly symmetric distribution.
- Positive Skewness indicates a right-skewed distribution.
- Negative Skewness indicates a left-skewed distribution.
- Calculate the Mean (xˉ\bar{x}): First, find the Mean of the dataset, which is the sum of all values divided by the number of data points.
xˉ=∑i=1nxin\bar{x} = \frac{\sum_{i=1}^{n} x_i}{n}
- Calculate the Standard Deviation (ss): The standard deviation measures the spread of data points around the Mean. Use the formula:
s=1n∑i=1n(xi−xˉ)2s = \sqrt{\frac{1}{n} \sum_{i=1}^{n} (x_i – \bar{x})^2}
- Calculate the Third Central Moment: This is the third power of the deviation from the Mean:
M3=1n∑i=1n(xi−xˉ)3M_3 = \frac{1}{n} \sum_{i=1}^{n} (x_i – \bar{x})^3
- Calculate Skewness Coefficient: Finally, the skewness coefficient is given by:
Skewness=M3s3\text{Skewness} = \frac{M_3}{s^3}
- Positive Skewness: A positive value indicates that the data has a longer right tail, meaning there are more high-value outliers, a key aspect often considered in a Data Analyst Job Description.
- Negative Skewness: A negative value suggests that the data has a longer left tail, meaning there are more low-value outliers.
- Zero Skewness: A value of 0 indicates a perfectly symmetrical distribution, similar to a normal distribution.
To Explore Data Science in Depth, Check Out Our Comprehensive Data Science Course Training To Gain Insights From Our Experts!
Recognizing Over-Kurtosis?
When a distribution is described as over-kurtic, it exhibits a leptokurtic nature, characterized by a higher peak and heavier tails compared to a normal distribution. This suggests that the dataset contains more extreme values or outliers. The concept of “excess kurtosis” is used to determine the degree of over-kurtosis. If the excess kurtosis is greater than 0, the distribution is leptokurtic, meaning it has fatter tails and a higher peak, with data points more likely to be extreme or outliers, as covered in Data Science Training. For instance, in finance, asset returns often follow leptokurtic distributions, showing more frequent large swings than a normal distribution would predict. When the excess kurtosis equals 0, the distribution is mesokurtic (normal), indicating no over-kurtosis or under-kurtosis.
If the excess kurtosis is less than 0, the distribution is platykurtic, with lighter tails and a flatter peak, suggesting that the data is less prone to extreme values. Recognizing over-kurtosis is important in areas such as risk management and outlier detection. In fields like finance and insurance, it helps identify the higher likelihood of extreme events, such as stock market crashes or large claims, which could otherwise be underestimated. Additionally, over-kurtosis signals the need for careful attention to outliers in the data, prompting analysts to use specialized techniques when making predictions or performing statistical tests.

Skewness: What Is It?
Skewness measures the asymmetry of the distribution of data points around the Mean. A distribution is said to be skewed if one tail is longer than the other, indicating that the data is not symmetrically distributed.There are three types of Skewness:
Are You Considering Pursuing a Master’s Degree in Data Science? Enroll in the Data Science Masters Course Today!
The Formula for Skewness
The Skewness of a dataset is calculated using the following formula, a process often discussed in What is Data Scrubbing.
Skewness=n(n−1)(n−2)∑i=1n(xi−xˉs)3\text{Skewness} = \frac{n}{(n-1)(n-2)} \sum_{i=1}^{n} \left(\frac{x_i – \bar{x}}{s}\right)^3
Where:
A Skewness value of:
How the Skewness Coefficient is Calculated
Steps to Calculate Skewness:
Interpretation of the Skewness Coefficient:
Preparing for Data Science Job Interviews? Have a Look at Our Blog on Data Science Interview Questions & Answer To Ace Your Interview!
Conclusion
Skewness and kurtosis are powerful statistical techniques that provide deep insights into the shape and characteristics of a distribution. Kurtosis measures the “tailedness” of a distribution, helping to identify the presence of outliers or extreme values. It reveals whether a distribution is flat (platykurtic), follows a normal shape (mesokurtic), or has heavy tails and sharp peaks (leptokurtic). Skewness, on the other hand, indicates the asymmetry of the distribution. It shows whether the data is concentrated more on one side of the mean (positive or negative skew), or if the distribution is roughly balanced around the mean, a concept frequently explored in Data Science Training. Together, skewness and kurtosis offer valuable insights, particularly for real-world data analysis. They enable analysts to assess data more comprehensively, allowing for better decision-making and a more accurate understanding of the underlying distribution, which is crucial when drawing conclusions or making predictions from the data.