Last updated on 28th May 2025| 10074
- Introduction to Regression in Statistics
- Importance of Regression in Data Science
- Types of Regression Techniques
- Simple Linear Regression Explained
- Multiple Linear Regression Model
- Logistic Regression for Classification Problems
- Polynomial Regression and Curve Fitting
- Ridge and Lasso Regression for Regularization
Introduction to Regression in Statistics
Regression analysis is a fundamental statistical technique used to explore and quantify the relationship between variables. It helps determine how the dependent variable, often called the target, changes when one or more independent variables (predictors) are altered. This method is extensively applied across various fields such as economics, finance, healthcare, and artificial intelligence to forecast outcomes, identify patterns, and enable informed, data-driven decisions. In the realm of machine learning, regression falls under supervised learning, where models are trained on labeled data to predict continuous outcomes, a key topic covered in Data Science Training. It remains one of the most popular and powerful tools for predictive modeling, due to its simplicity and interpretability. The main goal of regression analysis is to build a mathematical model that best describes the connection between the target and predictors. The strength and quality of this relationship are evaluated using statistical metrics like R-squared, mean squared error, and p-values, which help assess the model’s accuracy and reliability. By understanding these relationships, organizations can make better predictions, optimize processes, and gain valuable insights into complex data. Regression analysis thus serves as a critical tool in both traditional statistics and modern data science.
Are You Interested in Learning More About Data Science? Sign Up For Our Data Science Course Training Today!
Importance of Regression in Data Science
Regression is a cornerstone technique in data science, playing a critical role in modeling relationships between variables and making predictions. At its core, regression helps data scientists understand how changes in one or more independent variables impact a dependent variable, enabling both descriptive and predictive analytics. One of the primary uses of regression in data science is forecasting, which highlights the Role of Citizen Data Scientists in Today’s Business. For example, businesses rely on regression models to predict sales based on marketing spend, seasonal trends, or economic indicators. In healthcare, regression can estimate patient outcomes based on treatment plans and demographic factors, aiding in personalized medicine. Regression techniques also assist in feature selection and interpretation. By analyzing regression coefficients, data scientists can identify which variables significantly influence the target outcome, helping simplify models and focus on the most impactful factors. This interpretability is crucial for transparency, especially in regulated industries like finance and healthcare.
Moreover, regression serves as the foundation for many advanced machine learning algorithms and techniques. Its simplicity and effectiveness make it an excellent starting point for understanding complex data relationships. From linear to polynomial, ridge, and lasso regression, these methods provide flexibility to handle various data patterns and prevent issues like overfitting. In summary, regression is vital in data science because it combines prediction, insight, and interpretability, making it indispensable for data-driven decision-making across industries.
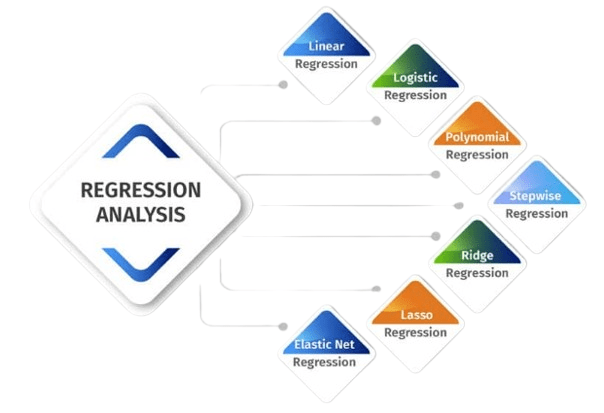
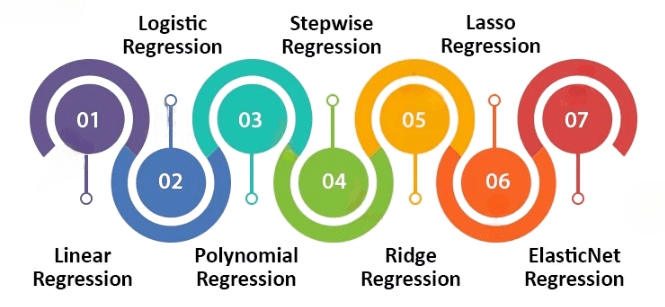
Types of Regression Techniques
- Linear Regression: The most basic form, it models the relationship between a dependent variable and one or more independent variables using a straight line. It assumes a linear correlation.
- Ridge Regression: A type of linear regression that includes L2 regularization. It helps reduce overfitting by penalizing large coefficients, making the model more robust.
- Lasso Regression: Similar to Ridge but uses L1 regularization, which can shrink some coefficients to zero. This makes it useful for feature selection in high-dimensional datasets.
- Polynomial Regression: Extends linear regression by fitting a nonlinear relationship between variables using polynomial functions. Useful when data shows a curved trend, and often implemented for projects among the Top Reasons To Learn Python.
- Logistic Regression: Although used for classification, it’s a regression-based technique that predicts probabilities for binary outcomes using the logistic function.
- Elastic Net Regression: Combines both L1 and L2 regularization, balancing the strengths of Ridge and Lasso. It’s useful when dealing with highly correlated predictors.
- Stepwise Regression: An iterative method that adds or removes variables based on statistical criteria to find the best-fitting model.
- Basic Concept: Simple linear regression fits a straight line through a scatter plot of data points to show the relationship between the independent and dependent variables.
- Equation Format: The model is expressed as y = mx + b, where y is the dependent variable, x is the independent variable, m is the slope, and b is the y-intercept.
- Line of Best Fit: The regression line minimizes the distance between the actual data points and the predicted values. This is done using a method called least squares, which is a fundamental concept in Data Science Training.
- Slope Interpretation: The slope (m) indicates how much the dependent variable is expected to change for a one-unit increase in the independent variable.
- Assumptions: Simple linear regression assumes linearity, independence, constant variance (homoscedasticity), and normally distributed residuals.
- Use Cases: It is widely used in economics, biology, and business to predict trends such as sales based on advertising spend or temperature effects on energy consumption.
- Limitations: It only models linear relationships and may not perform well if the data is nonlinear or contains outliers.
- Purpose: Unlike linear regression, logistic regression is used to predict categorical outcomes, such as yes/no, true/false, or success/failure.
- Binary Classification: Standard logistic regression is used for binary classification tasks, such as determining whether an email is spam or not, or predicting customer churn.
- Model Output: Logistic regression doesn’t predict the class directly, it predicts the probability of a data point belonging to a specific class.
- Multiclass Extension: With methods like One-vs-Rest or Softmax, logistic regression can be extended to handle multiclass classification problems, utilizing important Python Keywords.
- Applications: It’s widely used in fields like healthcare (disease prediction), finance (loan default risk), and marketing (customer segmentation).
- Sigmoid Function: It uses the sigmoid (logistic) function to convert linear outputs into probabilities between 0 and 1. This helps determine the likelihood that a given input belongs to a particular class.
- Decision Boundary: Predictions are made by applying a threshold (usually 0.5) to the output probability. If the probability is above the threshold, the instance is classified as one class; otherwise, it’s classified as the other.
To Explore Data Science in Depth, Check Out Our Comprehensive Data Science Course Training To Gain Insights From Our Experts!
Simple Linear Regression Explained

Multiple Linear Regression Model
Multiple Linear Regression (MLR) is a statistical technique used to model the relationship between one dependent variable and two or more independent variables. It extends simple linear regression by incorporating multiple predictors to explain or predict the outcome more accurately. The general form of the model is: y = b₀ + b₁x₁ + b₂x₂ + … + bₙxₙ + ε, where y is the dependent variable, x₁ to xₙ are the independent variables, b₀ is the intercept, b₁ to bₙ are the coefficients (slopes), and ε is the error term. Each coefficient represents the change in the dependent variable associated with a one-unit change in the respective independent variable, holding the others constant an essential concept in understanding What is Data Science. This makes MLR useful for understanding the relative impact of multiple factors. For example, in predicting a student’s final exam score, independent variables might include hours studied, attendance, and prior grades. MLR assumes a linear relationship, normally distributed residuals, no multicollinearity among predictors, and constant variance of errors (homoscedasticity). When these assumptions are met, the model provides reliable and interpretable insights. It is widely used in economics, marketing, healthcare, and social sciences to forecast outcomes and identify key influencing factors in complex datasets.
Looking to Master Data Science? Discover the Data Science Masters Course Available at ACTE Now!
Logistic Regression for Classification Problems
Polynomial Regression and Curve Fitting
Polynomial regression is an extension of linear regression that models the relationship between the independent variable and the dependent variable as an nth-degree polynomial. It is particularly useful when the data shows a non-linear trend that cannot be captured by a straight line. Instead of fitting a linear equation like y = mx + b, polynomial regression fits a curve of the form y = a + b₁x + b₂x² + … + bₙxⁿ, where n is the degree of the polynomial. This technique is commonly used for curve fitting, where the goal is to find the best possible curve that represents the underlying pattern in the data, illustrating The Importance of Machine Learning for Data Scientists. By increasing the degree of the polynomial, the model becomes more flexible and can capture more complex relationships. However, this flexibility comes with the risk of overfitting, especially when the model tries to fit every small fluctuation in the data. Polynomial regression is applied in various fields like physics, economics, and engineering for tasks such as predicting growth trends, modeling sensor data, or estimating non-linear relationships. While it’s more powerful than simple linear regression for non-linear data, careful model selection and validation are essential to avoid excessive complexity and poor generalization.
Go Through These Data Science Interview Questions & Answer to Excel in Your Upcoming Interview.
Ridge and Lasso Regression for Regularization
Ridge and Lasso regression are two popular techniques used for regularization in linear models. Regularization helps prevent overfitting, a common problem where a model performs well on training data but poorly on unseen data. Both methods add a penalty term to the standard linear regression loss function, which discourages overly complex models by shrinking the regression coefficients. Ridge Regression (also known as L2 regularization) adds the squared magnitude of the coefficients as a penalty term. This encourages the model to keep all features but reduces the size of the coefficients, especially when they are not strongly predictive, a concept covered in Data Science Training. It is particularly effective when dealing with multicollinearity when independent variables are highly correlated. Lasso Regression (L1 regularization), on the other hand, adds the absolute value of the coefficients to the loss function. Lasso not only reduces coefficient values but can also shrink some of them to zero, effectively performing feature selection. This makes it useful in high-dimensional datasets where only a subset of features are relevant. Both Ridge and Lasso help improve model generalization and interpretability. Choosing between them depends on the specific dataset and goals Ridge for when all features are somewhat useful, and Lasso for when feature selection is important.