Last updated on 13th Oct 2025| 9819
- What is Data Warehousing?
- Data Warehouse vs Database
- Components of a Data Warehouse
- ETL Process Overview
- Star Schema and Snowflake Schema
- OLAP vs OLTP
- Data Marts and Aggregation
- Data Warehouse Architecture
- Tools Used in Data Warehousing
- Data Quality and Governance
- Case Studies in Data Warehousing
- Conclusion
What is Data Warehousing?
Data warehousing refers to the process of collecting, integrating, and storing data from different sources in a centralized repository to support business decision-making, analytics, and reporting. Unlike operational databases designed for day-to-day transactions, a data warehouse is optimized for complex queries, aggregations, and historical analysis. It serves as the backbone for business intelligence (BI) systems, enabling organizations to derive actionable insights from vast datasets. Data warehousing systems are designed to provide a consolidated view of the organization’s data by integrating information from different departments and formats. This unified view enhances decision-making, boosts productivity, and streamlines operations by offering reliable and consistent data.
Data Warehouse vs Database
A traditional database (such as those used in ERP or CRM systems) is optimized for handling real-time transaction processing (OLTP). These databases are best for managing inserts, updates, and deletes efficiently. In contrast, a data warehouse is designed for Online Analytical Processing (OLAP), where the focus is on complex queries and data analysis.
- Key Differences:
- Functionality: Databases handle transactions (e.g., placing orders), while data warehouses support analysis (e.g., monthly sales reports).
- Data Type: Databases typically contain current data; warehouses store both current and historical data.
- Schema Design: Databases use normalized schemas; warehouses use star or snowflake schemas for faster querying.
- Performance: Databases optimize write operations; warehouses optimize read and analytical operations.
- Users: Databases are used by operational staff; warehouses are used by analysts and decision-makers.
Do You Want to Learn More About Data Science? Get Info From Our Data Science Course Training Today!
Components of a Data Warehouse
- Data Sources: Originate from internal systems (CRM, ERP) and external systems (web logs, market data).
- ETL Process: Responsible for extracting, transforming, and loading data into the warehouse.
- Staging Area: A temporary environment where data is cleaned and transformed before loading.
- Data Storage Layer: The centralized repository that stores structured, consistent, and historical data.
- Metadata: Provides context about data origin, transformation rules, and schema.
- Extract: Data is pulled from various source systems, including relational databases, APIs, and files.
- Transform: Data is cleaned (e.g., removing nulls), formatted (e.g., date standardization), deduplicated, and enriched.
- Load: The processed data is loaded into the data warehouse, often using incremental or full-load methods.
- Star Schema: The central fact table (e.g., Sales) is directly connected to dimension tables (e.g., Time, Product, Region). It is denormalized, which makes it easier and faster for analysts to query.
- Snowflake Schema: A normalized version of the star schema where dimension tables are split into additional related tables (e.g., Product → Category → Department). It reduces redundancy but can slow down query performance. Comparison:
- Star Schema: Simpler structure, faster queries, more storage.
- Snowflake Schema: Complex structure, slower queries, less storage.
- OLAP (Online Analytical Processing): Optimized for analytical queries that involve aggregations and multidimensional analysis.
- Example: Comparing sales across quarters.
- Characteristics: Read-heavy, supports historical data, involves complex joins.
- OLTP (Online Transaction Processing): Designed for real-time operations like data entry, updates, and deletions.
- Example: Banking transactions or inventory updates.
- Characteristics: Write-heavy, supports current data, uses simple queries.
- Data Marts: Focused subsets of a data warehouse. Departments like HR, Finance, or Marketing can have dedicated data marts, enabling faster access to relevant data without overloading the main warehouse.Can be Dependent (sourced from a central DW) or Independent (built separately).
- Aggregation: Pre-computed summaries of large data sets (e.g., daily sales totals) to improve query performance. Aggregated tables reduce computational overhead during peak reporting times.
- Accuracy: Data reflects real-world values.
- Completeness: No missing fields.
- Consistency: Uniform format and logic.
- Timeliness: Updated data available on time.
- Validity: Conforms to business rules.
- This feature minimises implementation problems by ensuring that the logical model and the actual database structure match.
- Conversely, you can extract data models from pre-existing databases by reverse engineering.
- This is very helpful for moving databases, analysing current structures, and documenting legacy systems.
- Both features preserve consistency between models and real database implementations while saving time.
Would You Like to Know More About Data Science? Sign Up For Our Data Science Course Training Now!
ETL Process Overview
ETL (Extract, Transform, Load) is the backbone of any data warehousing system:
ETL can be scheduled in batches (daily, weekly) or run in near real-time using stream-based tools. Quality ETL processes ensure that the data warehouse is reliable, accurate, and analytics-ready.
Star Schema and Snowflake Schema
These schemas define how data is structured within the warehouse:

OLAP vs OLTP
Data Marts and Aggregation
Data Warehouse Architecture
The architecture of a data warehouse can be divided into several levels. Due to its inefficient combination of data storage and analysis in a single layer, the single-tier design is rarely utilised. Client apps and the data warehouse are kept apart by the two-tier architecture, but as the system expands, scalability problems frequently arise. The most widely used method is the three-tier design, which has three layers: the OLAP engine and metadata repository are located in the middle tier, BI tools and front-end applications are located in the top tier, and data sources and storage are located in the bottom tier. Higher performance, simpler maintenance, and improved scalability are guaranteed by this three-tier design.
Gain Your Master’s Certification in Data Science Training by Enrolling in Our Big Data Analytics Master Program Training Course Now!
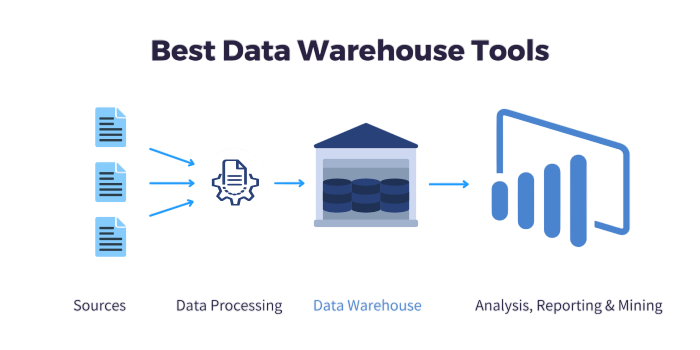
Tools Used in Data Warehousing
The management and analysis of company data is aided by a number of crucial data warehousing tools. ETL tools for effective data extraction, transformation, and loading include Microsoft SQL Server Integration Services (SSIS), Apache NiFi, Talend Open Studio, and Informatica PowerCenter. Google BigQuery, Microsoft Azure Synapse Analytics, Amazon Redshift, and Snowflake are well-known data warehousing platforms for processing and storing data. Commonly used BI technologies include Tableau, Power BI, Qlik Sense, and SAP BusinessObjects for data visualisation and analysis. When used in tandem, these solutions simplify the integration, archiving, and display of vast amounts of data from many organisations.
Commonly used BI technologies include Tableau, Power BI, Qlik Sense, and SAP BusinessObjects for data visualisation and analysis. When used in tandem, these solutions simplify the integration, archiving, and display of vast amounts of data from many organisations.
Data Quality and Governance
A critical aspect of successful data warehousing is maintaining high data quality, which ensures the information is accurate, consistent, and reliable. Effective ETL processes and governance frameworks help preserve data quality throughout the data lifecycle. Ultimately, strong data quality leads to trustworthy insights and better strategic outcomes for organizations.
Data Quality ensures the warehouse delivers reliable and consistent data. Key dimensions include:
Preparing for Data Science Job? Have a Look at Our Blog on Data Science Interview Questions & Answer To Acte Your Interview!
Import/Export Features
- Import Options:
A data modelling tool’s import/export features make data integration and interchange simple. For interoperability with UML tools, import options include XMI (XML Metadata Interchange) and Excel or CSV files to import entity and attribute definitions. Models from other modelling programmes, such as IBM InfoSphere and SAP PowerDesigner, or the ERwin Mart Repository, can also be imported for use in Big Data Examples and analytics scenarios.
Export Options:However, export options enable the creation of Excel/CSV reports for data definition sharing and SQL scripts for database setup. Diagrams can be exported as PNG, JPG, or BMP pictures for use in visual presentations, or they can be integrated with business architecture tools using XML/XMI formats. HTML reports also offer browser-viewable interactive documentation, which facilitates sharing with stakeholders and teams.
Forward and Reverse Engineering in Erwin
To expedite database creation, Erwin Data Modeller facilitates both forward and reverse engineering. By allowing you to create SQL scripts straight from your data models, forward engineering makes it possible to quickly and precisely create databases according to your plan.
Best Practices for Data Modeling in Erwin
It’s critical to adhere to industry best practices in order to maximise Erwin Data Modeler’s functionality. Just as debates like Elon Musk Vs Mark Zuckerberg highlight contrasting approaches to technology, it’s important to explicitly define the business needs prior to modelling to ensure alignment and clarity. To keep things clear, name entities, characteristics, and relationships according to standard conventions. When necessary, normalise your data; however, avoid over-normalizing to the point that performance is negatively impacted. To guarantee quality and accuracy, make use of Erwin’s built-in capabilities, such as version control and model validation. Finally, use Erwin’s reporting features to document everything. This will help with understanding and support governance and compliance initiatives.
Conclusion
Erwin Data Modeler is a feature-rich tool that enables efficient and accurate design of enterprise-level databases. Its powerful capabilities support a wide range of modeling activities from simple logical diagrams to complex physical schema implementations. With tools for automation, governance, collaboration, and documentation, Erwin empowers data professionals to deliver high-quality, future-proof database architectures that align with organizational objectives and support Data Science training initiatives. Mastery of Erwin ensures better data governance, regulatory compliance, and improved business insights through clean and structured data systems.Whether you are starting from scratch or documenting legacy databases, Erwin Data Modeler is a reliable companion in your data modeling journey.