
Last updated on 24th Apr 2025| 9528
- Introduction to Exploratory Data Analysis (EDA)
- Importance of EDA in Data Science
- Steps Involved in EDA
- Summary Statistics in EDA
- Data Visualization Techniques for EDA
- Handling Missing Data During EDA
- Identifying Outliers in Data
- Feature Engineering in EDA
- Tools and Libraries for EDA (Pandas, Matplotlib, Seaborn)
- EDA for Machine Learning Model Preparation
- Common Mistakes in EDA and How to Avoid Them
- Conclusion and Best Practices
Introduction to Exploratory Data Analysis (EDA)
Exploratory Data Analysis (EDA) is a crucial step in Data Science Training that focuses on analyzing and summarizing datasets to reveal underlying patterns, trends, and relationships. The primary goal of EDA is to gain a deeper understanding of the data, test initial hypotheses, and prepare the dataset for more advanced analysis or modeling. Using statistical and graphical techniques, EDA allows data scientists to explore the data visually and numerically, identifying essential characteristics such as distributions, correlations, and potential outliers. This process is vital before diving into more complex modeling tasks, as it helps inform decisions about data preprocessing, feature selection, and the choice of modeling techniques. Through EDA, data scientists can ensure the data is suitable for analysis, gain insights that guide further investigation, and uncover hidden patterns that might not be immediately apparent.
Importance of EDA in Data Science
EDA is crucial in data science because
Understanding Data: EDA helps data scientists understand the dataset’s structure, the relationships between variables, and the potential challenges in the data.Steps Involved in EDA
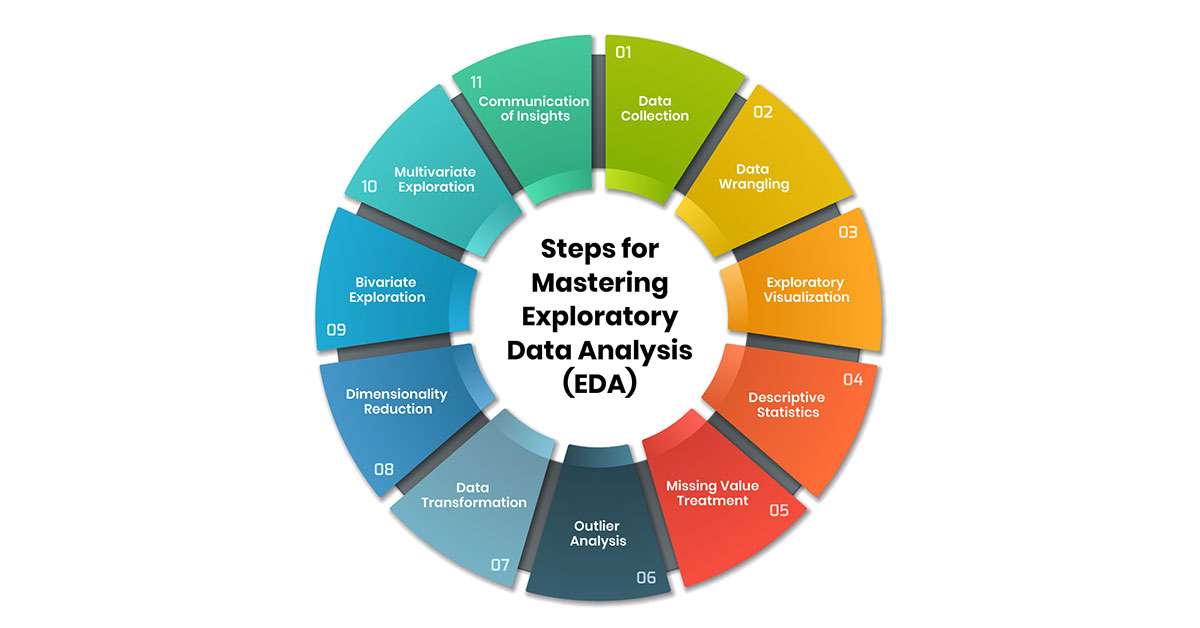
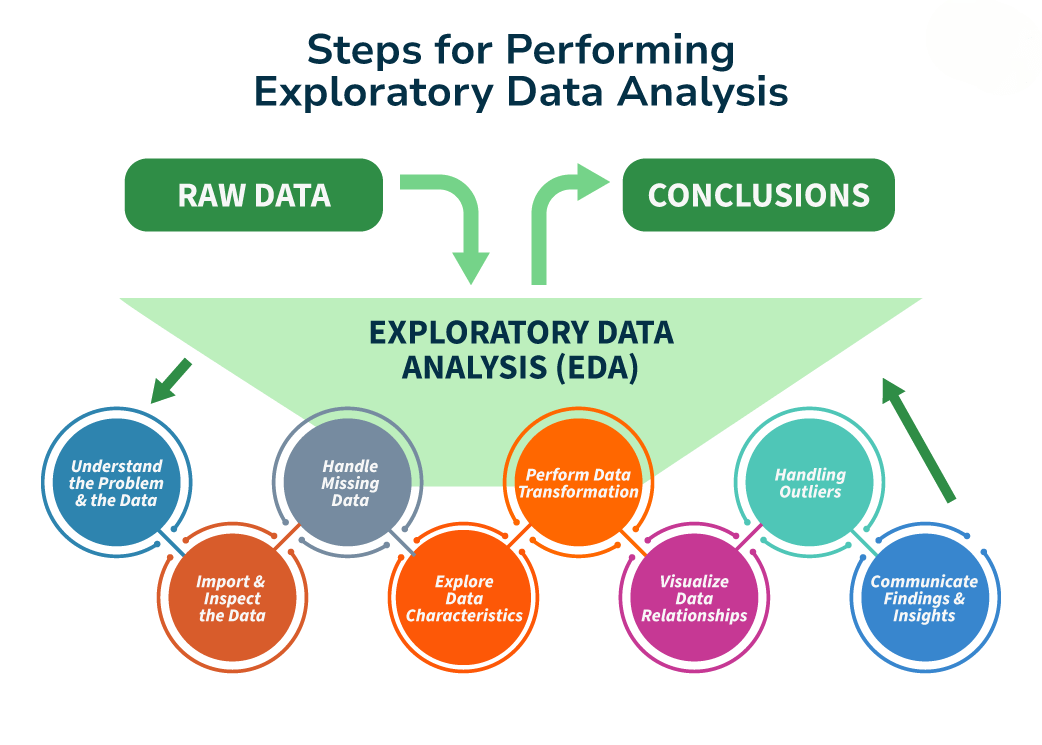
EDA typically involves the following steps:
- Data Collection: Gather the dataset from relevant sources. This could include loading data from CSV files, databases, or APIs.
- Data Cleaning: Identify and handle missing data, duplicates, and errors in the dataset.
- Data Transformation: Convert data types (e.g., categorical to numerical), normalize or standardize values, and handle any necessary transformations to prepare the data for analysis.
- Descriptive Statistics: Compute summary statistics like mean, median, mode, standard deviation, and percentiles to get a quick dataset overview.Learn more in the Basics of Data Science guide.
- Visualization: Create histograms, box plots, scatter plots, and heat maps to explore relationships and distributions.
- Hypothesis Testing: Form and test hypotheses using statistical tests, like correlation analysis or t-tests, to understand data relationships further.
- Feature Engineering: Develop new features or modify existing features to enhance the predictive power of the data.
Summary Statistics in EDA
Summary statistics are an essential part of EDA and provide a high-level overview of the data. Standard summary statistics include:
-
Central Tendency:
- Mean: The average of the data points.
- Median: The middle value of the data when sorted in order.
- Mode: The most frequent value in the dataset. Dispersion:
- Standard Deviation: Measures the spread of data around the mean.
- Variance: The square of the standard deviation shows how much data varies from the mean.
- Range: The difference between the maximum and minimum values in the dataset.
- Interquartile Range (IQR): The range between the 25th and 75th percentiles, representing the middle 50% of the data.
- Skewness and Kurtosis: Measures of the asymmetry (skewness) and the peakedness (kurtosis) of the distribution of the data.
These statistics provide insight into the distribution and spread of the data, which helps in understanding its general behavior.

Data Visualization Techniques for EDA
Data visualization is key to EDA because it allows for intuitive data exploration. Standard visualization techniques include
- Histograms are used to visualize a single variable’s distribution, showing the frequency of different value ranges.
- Box Plots: Useful for visualizing the spread, central tendency, and identifying outliers in a dataset.
- Scatter Plots: Display the relationship between two numerical variables to identify correlations or patterns.
- Pair Plots: Show pairwise relationships between multiple numerical variables, making it easier to spot trends and correlations. Explore more in Artificial Intelligence.
- Heatmaps: Visual representations of correlation matrices to observe the relationships between multiple variables at once.
- Bar Charts: Great for comparing the frequency of categorical data across different categories.
- Violin Plots are similar to box plots but show the full distribution, providing more detailed insights into the data’s spread.
Handling Missing Data During EDA
Handling missing data is a critical part of EDA. There are several strategies to deal with missing values:
- Mean/Median Imputation: Replace missing values with the mean or median of the feature.
- Forward/Backward Filling: This technique uses adjacent values (previous or next) to fill in missing values, and it is often used in time-series data.
- Predictive Imputation: Using a machine learning model to predict missing values based on other variables. 3.Flagging Missing Values: Create a binary indicator variable to mark where data is missing.
1.Removing Data: Dropping rows or columns with missing values is an option, but this may not be ideal if there is a lot of missing data or if it’s essential data.
2.Imputation: Filling in missing values with imputed values, such as
The choice of method depends on the nature of the missing data and the impact on the analysis.
Identifying Outliers in Data
Outliers are data points that deviate significantly from other observations. Identifying outliers is essential to avoid skewed results or erroneous conclusions. Standard methods for detecting outliers include
- Box Plots: Points outside the “whiskers” (1.5 * IQR above the 75th or below the 25th percentile) are considered outliers.
- Z-score: A standard score that indicates how many standard deviations a data point is from the mean. A Z-score more significant than three or less than -3 often indicates an outlier. Learn more with our Data Science Training.
- IQR Method: Outliers are data points above the upper bound (Q3 + 1.5 * IQR) or below the lower bound (Q1 – 1.5 * IQR).
- Visualizations: Scatter plots or histograms can help visually identify points that fall outside the expected range.
Once identified, outliers can either be removed, transformed, or kept depending on their relevance to the analysis.
Feature Engineering in EDA
Feature engineering involves creating new features or modifying existing ones to represent the underlying patterns in the data better. Some standard techniques include:
- Binning: Converting numerical features into categorical bins (e.g., age groups).
- Polynomial Features: Creating interaction terms or polynomial features to capture non-linear relationships.
- Log Transformations: Applying log transformations to reduce skewness in skewed features.
- Encoding Categorical Variables: Converting categorical data into numeric formats using one-hot or label encoding.
- Feature Scaling: Standardizing or normalizing features ensures they all contribute equally to model training.
Feature engineering can significantly improve the performance of machine learning models by making the data more informative.
Tools and Libraries for EDA (Pandas, Matplotlib, Seaborn)
Several powerful libraries help in performing EDA in Python:
-
1.Pandas: A data manipulation library that provides data structures like DataFrame and Series for efficiently handling and analyzing datasets. It includes functions for filtering, transforming, and aggregating data.
- Example: df.describe(), df.info() 2.Matplotlib: A widely used plotting library in Python for creating static, animated, and interactive visualizations. Learn more in Mastering Python.
- Example: plt.plot(), plt.hist() 3.Seaborn: Built on Matplotlib, Seaborn provides a high-level interface for creating attractive and informative statistical graphics.
- Example: sns.boxplot(), sns.heatmap() 4.Plotly: For interactive plots, particularly useful in web-based applications and dashboards.
These libraries are often combined to provide statistical summaries and rich visualizations during EDA.
EDA for Machine Learning Model Preparation
EDA plays a key role in preparing the dataset for machine learning. It helps in:
- Feature Selection: Identifying the most relevant features to use in model building.
- Handling Imbalanced Data: Identifying and addressing class imbalances before model training.
- Scaling Features: Ensuring that all numerical features are on the same scale before training a machine learning model.
- Data Transformation: Applying transformations (e.g., log transformation, encoding) to make data more suitable for machine learning algorithms.
- Detecting Multicollinearity: Checking for correlations between independent variables to avoid issues in regression models.
Common Mistakes in EDA and How to Avoid Them
Several tools and software platforms are available for conducting hypothesis testing:
- Skipping Data Cleaning: Failing to clean data can lead to inaccurate conclusions. Always address missing values, duplicates, and data inconsistencies before proceeding with EDA.
- Overlooking Visualizations: Relying too heavily on summary statistics without using visualizations can miss essential patterns in the data. Use both to get a comprehensive understanding.
- Ignoring Domain Knowledge: Not incorporating domain expertise into the analysis may lead to irrelevant findings. Always understand the context of the problem.
- Overfitting in Feature Engineering: Creating too many or overly complex features can lead to overfitting. Keep the features simple and relevant.
- Not Validating Assumptions: Assumptions such as normality or linearity should be validated using statistical tests during EDA. Relying on assumptions without validation can skew results.
Conclusion
Exploratory Data Analysis (EDA) is a crucial phase in data science. It helps data scientists understand their datasets better, uncover hidden patterns, and prepare the data for modeling. EDA lays the groundwork for building robust machine-learning models by leveraging summary statistics, visualizations, and feature engineering. Best practices in EDA involve carefully cleaning and transforming data, incorporating domain knowledge, and applying statistical and visual techniques. These practices help identify key insights, detect outliers, and understand the relationships between variables. EDA not only aids in refining the dataset but also plays a vital role in making informed decisions about the most suitable modeling approaches. It ensures that the data used for model building is highly relevant, making it an essential step in any data science project. Data Science Training can enhance model accuracy and efficiency through EDA by addressing potential issues before delving into more complex analyses.