Last updated on 17th Jun 2025| 9756
- Why Choose R for Data Science?
- Overview of R Certification Programs
- Curriculum and Topics Covered
- R Programming Basics
- Data Visualization with ggplot2
- Statistical Modeling in R
- Real-Life Projects in R
- Certification Bodies and Institutions
Why Choose R for Data Science
R is a powerful programming language specifically designed for data analysis and statistical computing, making it an ideal choice for data science. It offers a wide range of packages and libraries that cater to various aspects of data science, from data manipulation to machine learning, statistical modeling, and visualization. With its vast community support, R continually evolves, providing data scientists with cutting-edge tools and resources. The language’s intuitive syntax and robust visualization capabilities through packages like ggplot2 make exploring and presenting complex data insights easy. R’s seamless integration with popular data science tools and its ability to handle large datasets efficiently further enhance its appeal. Additionally, R is open-source and free, enabling both beginners and professionals to access its full potential without any financial barrier. This makes it an excellent choice for those looking to pursue Data Science Training as it provides the tools and flexibility needed for various data analysis tasks. Furthermore, its strong presence in academia and research ensures a high level of credibility and reliability, making it a trusted choice for data-driven decision-making. Whether you’re working on exploratory data analysis, predictive modeling, or building advanced machine learning algorithms, R provides an exceptional environment to conduct comprehensive and reproducible data science work. These combined strengths make R a top choice for both aspiring and seasoned data scientists.
Would You Like to Know More About Data Science? Sign Up For Our Data Science Course Training Now!
Overview of R Certification Programs
- Comprehensive Curriculum: R certification programs typically cover topics such as data manipulation, data visualization, statistical modeling, machine learning, and data wrangling using R. They are structured to cater to both beginners and advanced users.
- Hands-on Learning: Most programs focus on practical experience with hands-on exercises and projects, helping learners apply their knowledge. This is particularly useful for those exploring careers like Machine Learning Engineer vs. Data Scientist, highlighting the skill differences between the roles.
- Industry Recognition: Earning an R certification can improve job prospects and increase credibility, as it’s recognized by employers in various industries like healthcare, finance, and technology.
R certification programs are designed to validate your skills in data analysis, statistical modeling, and programming using R. These certifications help professionals demonstrate their expertise in using R for data science and analytics, providing a competitive edge in the job market.
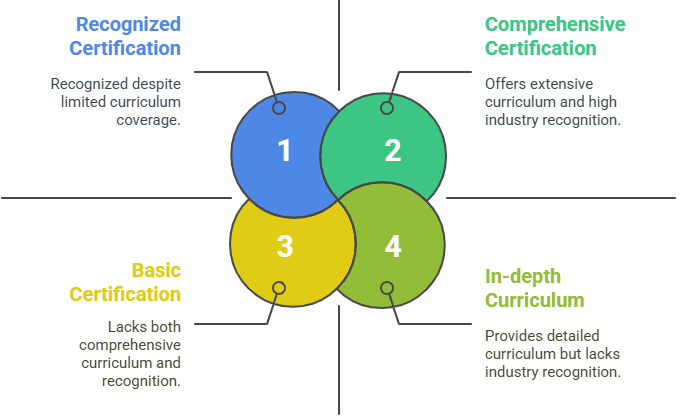
- Flexible Learning Options: These programs are available through online platforms, allowing you to learn at your own pace. Many platforms offer self-paced courses, webinars, and live sessions.
- Prerequisites: While some programs require basic knowledge of statistics and programming, there are beginner-level certifications available for those new to R and data science.
- Certification Providers: Leading organizations like DataCamp, Coursera, edX, and the R Foundation offer certification courses. Additionally, universities and specialized institutions also provide recognized certifications to help you advance your career.
Curriculum and Topics Covered
R certification programs offer a comprehensive curriculum designed to equip learners with essential skills for data science and statistical analysis. The program typically begins with an introduction to R programming, covering basic syntax, data structures, and functions. As learners progress, the focus shifts to more advanced topics such as data manipulation using packages like dplyr and tidyr, enabling effective handling and transformation of large datasets. Key topics also include data visualization, where tools like ggplot2 are used to create informative and aesthetically pleasing charts and graphs. Additionally, the content covers What is Data Engineering providing insights into the infrastructure and tools that support data processing and analysis. Statistical analysis is another core component, teaching concepts such as hypothesis testing, regression analysis, and probability distributions, all of which are crucial for data interpretation. Machine learning techniques, such as clustering, classification, and predictive modeling, are also covered, with an emphasis on applying algorithms to solve real-world problems. Additionally, learners are taught how to work with time series data, text mining, and web scraping to gather and analyze data from various sources. The program often concludes with a capstone project, allowing learners to apply their knowledge to a practical data science problem, reinforcing their skills and demonstrating their capabilities to potential employers. Overall, the curriculum provides a well-rounded education in R and data science.
Want to Pursue a Data Science Master’s Degree? Enroll For Data Science Masters Course Today!
R Programming Basics
- R Syntax: R uses a simple and readable syntax. It’s important to understand how to write basic commands, assign variables, and work with operators (like arithmetic, comparison, and logical operators).
- Data Structures: R supports several data structures, including vectors, lists, matrices, data frames, and factors. Understanding these structures is key for organizing and manipulating data efficiently.
- Functions and Loops: Functions in R allow you to perform repetitive tasks without rewriting code. Loops, such as for, while, and repeat, help automate processes across data sets. Additionally, for those looking to expand their skills, exploring Python Project Ideas for beginners can be a great way to apply programming concepts in a practical, hands-on manner.
- Packages and Libraries: R has a rich ecosystem of packages that extend its capabilities. Learning how to install and load libraries like dplyr, ggplot2, and tidyr will boost your efficiency in data manipulation and visualization.
- Basic Data Import/Export: Being able to read and write data files (CSV, Excel, etc.) is fundamental. R provides functions such as read.csv() and write.csv() to easily import and export data.
- Basic Data Operations: R makes it easy to filter, sort, and aggregate data using simple functions. Familiarity with operations like subset(), merge(), and basic aggregation functions will help streamline your data analysis tasks.
- Linear and Logistic Regression: R provides built-in functions such as lm() for linear regression and glm() for logistic regression. These models help in understanding the relationship between dependent and independent variables, whether for prediction or hypothesis testing.
- ANOVA (Analysis of Variance): ANOVA is used to compare means across multiple groups. R’s aov() function makes it easy to test hypotheses about group differences and analyze variance within datasets.
- Time Series Analysis: R offers tools for analyzing time-dependent data with packages like forecast and tseries, using techniques like ARIMA and exponential smoothing to model trends. This also underscores the Differences between Data Scientists vs Software Engineers, as data scientists focus on analysis, while software engineers build systems and applications.
- Survival Analysis: The survival package in R allows users to analyze time-to-event data, which is crucial in fields like healthcare and reliability engineering.
- Multivariate Analysis: For analyzing multiple variables simultaneously, R provides methods like Principal Component Analysis (PCA) and Multidimensional Scaling (MDS) through packages like stats and factoextra.
- Model Evaluation and Diagnostics: R offers tools to assess model performance, such as residual analysis, cross-validation, and calculating metrics like AIC, BIC, and R-squared. Functions like plot() and summary() help diagnose issues with fitted models and improve accuracy.
R is a powerful language for data analysis and statistics, offering a range of functionalities for both beginners and advanced users. Before diving into more complex data analysis tasks, it’s essential to grasp the basic concepts of R programming.

Data Visualization with ggplot2
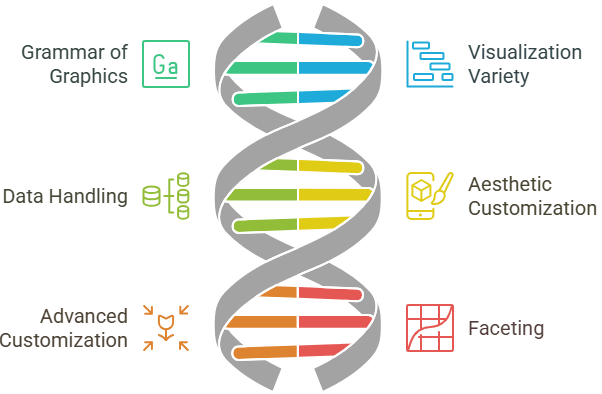
ggplot2 is one of the most powerful and widely used packages in R for creating sophisticated and visually appealing data visualizations. Built on the principles of the Grammar of Graphics, ggplot2 allows users to create complex plots by layering components like data, aesthetics, geometric objects, and statistical transformations. This makes ggplot2 a powerful tool in enroll Data Science Training, helping learners develop essential skills in data visualization and analysis. The package makes it easy to produce a variety of visualizations, such as bar charts, line graphs, scatter plots, histograms, and box plots, with just a few lines of code. A key feature of ggplot2 is its ability to handle large datasets and provide clear, insightful representations of data patterns and trends. By specifying aesthetics like color, size, and shape, users can tailor visualizations to highlight key data features. Furthermore, ggplot2 offers advanced customization options, including themes, labels, and legends, enabling users to refine plots for better readability and presentation. It also supports faceting, which allows for the creation of multiple plots based on subsets of data, making it easier to compare different categories or groups within a dataset. Whether for exploratory data analysis or presentation, ggplot2’s versatility and ease of use make it an essential tool for data visualization in R, empowering analysts to convey insights effectively and intuitively.
Statistical Modeling in R
Statistical modeling in R is a core aspect of data analysis, allowing data scientists to make inferences, predictions, and understand relationships within their data. With R’s extensive suite of statistical functions and packages, users can build robust models for various types of analysis.
Real-Life Projects in R
Working on real-life projects in R allows you to apply your theoretical knowledge to practical problems, showcasing your ability to analyze and interpret data. One example is sales forecasting, where you can use time series analysis, like ARIMA models, to predict future sales trends and optimize inventory. In customer segmentation, clustering algorithms such as K-means can help group customers based on behavior or demographics, which is valuable for targeted marketing strategies. Financial data analysis is another popular project, where you can apply statistical models to assess risks, forecast stock prices, or optimize investment portfolios. This is valuable for anyone exploring the Data Analyst Career Path providing hands-on experience in data-driven decision-making and analysis. In the healthcare sector, you can analyze medical data to predict patient outcomes, optimize hospital resources, or understand disease progression using machine learning algorithms. Social media sentiment analysis can be performed using R’s text mining packages like tm or textclean to assess public opinion on brands or social issues by analyzing social media data. Finally, web scraping is a practical project where you use R packages like rvest to collect data from websites for further analysis, such as tracking product prices or gathering market trends. These projects provide hands-on experience with R, allowing you to solve real-world problems and demonstrate your data analysis skills effectively.
Go Through These Data Science Interview Questions & Answer to Excel in Your Upcoming Interview.
Certification Bodies and Institutions
Several reputable certification bodies and institutions offer R programming certifications that validate your skills and expertise in data analysis, statistics, and data science. Leading online platforms like Coursera and edX partner with renowned universities and institutions such as Harvard University and Johns Hopkins University to offer comprehensive R certification programs. These programs typically include hands-on projects, quizzes, and peer reviews to ensure practical learning. Additionally, DataCamp is another popular platform that offers specialized R courses and certifications, focusing on topics like data visualization, statistical modeling, and machine learning using R. These courses are perfect for anyone looking to enhance their Data Science Training providing valuable skills in the field of data analysis and machine learning with R. The R Foundation, the official body behind R, also provides resources for R education and connects learners with certified training providers. Microsoft and IBM offer R certifications through platforms like edX and Coursera, focusing on R’s applications in data science, machine learning, and artificial intelligence. Other institutions, such as Udacity and LinkedIn Learning, also provide R-related courses, ranging from beginner to advanced levels, with certificates to help boost your credentials. These certifications are highly valued by employers and help demonstrate your proficiency in R, making you more competitive in fields like data science, analytics, finance, and healthcare.