
Last updated on 15th Jul 2020| 1522
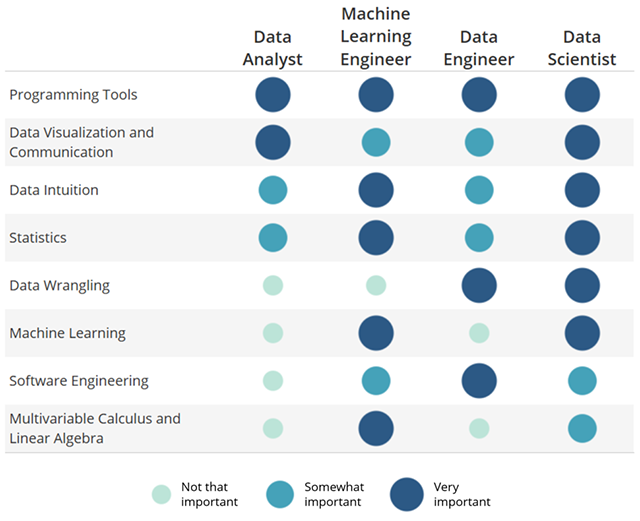
Essential Skills for Data Science
Programming Skills

No matter what type of company or role you’re interviewing for, you’re likely going to be expected to know how to use the tools of the trade. This means a statistical programming language, like R or Python, and a database querying language like SQL.
Statistics

A good understanding of statistics is vital as a data scientist. You should be familiar with statistical tests, distributions, maximum likelihood estimators, etc. This will also be the case for machine learning, but one of the more important aspects of your statistics knowledge will be understanding when different techniques are (or aren’t) a valid approach. Statistics is important at all company types, but especially data-driven companies where stakeholders will depend on your help to make decisions and design / evaluate experiments.
Math and Statistics are among the most powerful tools in a data scientist toolkit for performing the art of data science. As a data scientist, one will not just make use of complex techniques like neural networks to glean insights. Simple linear regression analysis is also a kind machine learning algorithm that every data science enthusiast starts with. Just by plotting the data on a chart and analyzing what it means is one of the essential first steps in the data science process.
A basic visualization like a histogram or a bar chart just gives some high-level information but with statistics, data scientists get to work with data in an information-driven and targeted way. The math involved in performing technical analysis of data helps draw concrete conclusions rather than just guesstimating. Having a good foundation in math concepts like rational and irrational numbers helps data scientists write accurate and efficient code.
Following are the basic math and statistic concepts every data scientist must know –
- Statistics and probability theory,
- Probability distributions,
- Multivariable Calculus,
- Linear Algebra,
- Hypothesis testing,
- Statistical modeling and fitting,
- Data summaries and descriptive statistics,
- Regression analysis,
- Bayesian thinking and modeling, and
- Markov Chains
Machine Learning

If you’re at a large company with huge amounts of data, or working at a company where the product itself is especially data-driven (e.g. Netflix, Google Maps, Uber), it may be the case that you’ll want to be familiar with machine learning methods. This can mean things like k-nearest neighbors, random forests, ensemble methods, and more. It’s true that a lot of these techniques can be implemented using R or Python libraries—because of this, it’s not necessary to become an expert on how the algorithms work. More important is to understand the broad strokes and really understand when it is appropriate to use different techniques.
As artificial intelligence and predictive analytics are two of the hottest topics in the field of data science, an understanding of machine learning has been identified as a key component of an analyst’s toolkit. While not every analyst works with machine learning, the tools and concepts are important to know in order to get ahead in the field. You’ll need to have your statistical programming skills down first to advance in this area, however. An “out-of-the-box” tool like Orange can also help you start building machine learning models.
Multivariable Calculus & Linear Algebra

Understanding these concepts is most important at companies where the product is defined by the data, and small improvements in predictive performance or algorithm optimization can lead to huge wins for the company. In an interview for a data science role, you may be asked to derive some of the machine learning or statistics results you employ elsewhere. Or, your interviewer may ask you some basic multivariable calculus or linear algebra questions, since they form the basis of a lot of these techniques. You may wonder why a data scientist would need to understand this when there are so many out of the box implementations in Python or R. The answer is that at a certain point, it can become worth it for a data science team to build out their own implementations in house.
Data Wrangling

Often, the data you’re analyzing is going to be messy and difficult to work with. Because of this, it’s really important to know how to deal with imperfections in data. Some examples of data imperfections include missing values, inconsistent string formatting (e.g., ‘New York’ versus ‘new york’ versus ‘ny’), and date formatting (‘2017-01-01’ vs. ‘01/01/2017’, unix time vs. timestamps, etc.). This will be most important at small companies where you’re an early data hire, or data-driven companies where the product is not data-related (particularly because the latter has often grown quickly with not much attention to data cleanliness), but this skill is important for everyone to have.

Learn Python Training to Get Most In-Demand IT Skills
- Instructor-led Sessions
- Real-life Case Studies
- Assignments
Data Visualization & Communication

Visualizing and communicating data is incredibly important, especially with young companies that are making data-driven decisions for the first time, or companies where data scientists are viewed as people who help others make data-driven decisions. When it comes to communicating, this means describing your findings, or the way techniques work to audiences, both technical and non-technical. Visualization-wise, it can be immensely helpful to be familiar with data visualization tools like matplotlib, ggplot, or d3.js. Tableau has become a popular data visualization and dashboarding tool as well. It is important to not just be familiar with the tools necessary to visualize data, but also the principles behind visually encoding data and communicating information.
Software Engineering

If you’re interviewing at a smaller company and are one of the first data science hires, it can be important to have a strong software engineering background. You’ll be responsible for handling a lot of data logging, and potentially the development of data-driven products.
Data Intuition

Companies want to see that you’re a data-driven problem-solver. At some point during the interview process, you’ll probably be asked about some high level problem—for example, about a test the company may want to run, or a data-driven product it may want to develop. It’s important to think about what things are important, and what things aren’t. How should you, as the data scientist, interact with the engineers and product managers? What methods should you use? When do approximations make sense?
SQL
SQL, or Structured Query Language, is the ubiquitous industry-standard database language and is possibly the most important skill for data analysts to know. The language is often thought of as the “graduated” version of Excel; it is able to handle large datasets that Excel simply can’t.
Almost every organization needs someone who knows SQL—whether to manage and store data, relate multiple databases (like the ones Amazon uses to recommend products you may be interested in,) or build or change those database structures altogether. Each month, thousands of job postings requiring SQL skills are posted, and the median salary for someone with advanced SQL skills sits well over $75,000. While even non-techies can benefit from learning this tool, if you’re looking to work with Big Data, learning SQL is the first step.
Microsoft Excel
When you think of Excel, the first thing that comes to mind is likely a spreadsheet, but there’s a lot more analysis power under the hood of this tool. While a programming language like R or Python is better suited to handle a large data set, advanced Excel methods like writing Macros and using VBA lookups are still widely used for smaller lifts and lighter, quick analytics. If you are working at a lean company or startup, the first version of your database may even be in Excel. Over the years, the tool has remained a mainstay for businesses in every industry, so learning it is a must. Luckily, there is an abundance of great free resources online to help you get started, as well as structured data analytics classes for those looking for a deeper understanding of the tool.
Critical Thinking
Using data to find answers to your questions means figuring out what to ask in the first place, which can often be quite tricky. To succeed as an analyst, you have to think like an analyst. It is the role of a data analyst to uncover and synthesize connections that are not always so clear. While this ability is innate to a certain extent, there are a number of tips you can try to help improve your critical thinking skills. For example, asking yourself basic questions about the issue at hand can help you stay grounded when searching for a solution, rather than getting carried away with an explanation that is more complex than it needs to be. Additionally, it is important that you remember to think for yourself instead of relying on what already exists.

Get Best Python Course to Be An Expert in Python Concepts By Experts Trainers
Weekday / Weekend BatchesSee Batch DetailsData Visualization
Being able to tell a compelling story with data is crucial to getting your point across and keeping your audience engaged. If your findings can’t be easily and quickly identified, then you’re going to have a difficult time getting through to others. For this reason, data visualization can have a make-or-break effect when it comes to the impact of your data. Analysts use eye-catching, high-quality charts and graphs to present their findings in a clear and concise way. Tableau’s visualization software is considered an industry-standard analytics tool, as it is refreshingly user-friendly.
Presentation Skills
Data visualization and presentation skills go hand-in-hand. But presenting doesn’t always come naturally to everyone, and that’s okay! Even seasoned presenters will feel their nerves get the best of them at times. As with anything else, start with practice—and then practice some more until you get into your groove. Forbes also suggests setting specific goals for your improvement and focusing on the audience rather than yourself as ways of getting more comfortable with presenting.
Data Visualization
There is a popular saying –“A picture is worth a thousand words.” It is easier to understand insights in the form of appealing charts and graphs than raw data. One crucial skill that many people tend to miss out is data visualization. Having knowledge of data visualization tools like QlikView, D3.js, Tableau helps you convert complex analytic results into a format that is easily comprehensible by people in technical and non-technical roles. Most of the stakeholders and business leaders do not understand the output of machine learning models. In such cases, data scientists can make use of visualizations to explain what those insights represent and their business implications.
Problem Solving
Problem-solving is the most critical data science skill because data science is all about solving challenging business problems. Without business problems, there wouldn’t be a need for a data scientist. As a data scientist, it does not matter what technology or programming language you use, if you cannot solve business problems, you won’t be very good at developing algorithms for the same. We constantly hear complaints about job interviews that are too difficult to crack because they ask the candidate to solve some difficult business cases at hand to test a candidate’s ability to solve problems.
A data scientist’s job role relates to that of a doctor. The more problems they solve and the more experience they have, the better they become at their job. This is one of the reasons why organizations value hands-on experience a lot more than just qualifications. However, it is still important to have the basic educational qualification.
A data scientist needs to know how to approach a problem productively. This implies identifying the salient features of a situation, finding out how to frame a question that will produce the desired answer, making a decision on what assumptions and approximations make sense, and coordinating with the right co-workers at the appropriate stages of the data science process. All this, along with knowledge of which data science technique or method needs to be applied to the problem at hand is a key skill for a successful data science career.
Business Acumen
While programming in Python, querying in SQL, and visualizing data are the core technical skills a data scientist must-have, the need to have a strong business acumen cannot be overlooked. It is important to have industry-specific knowledge to gain an in-depth understanding of the business problem and design a solution for it. For instance, if you are working in the healthcare domain, how human testing of medicines is conducted, the permissions that are needed for testing, etc can be considered as industry-specific knowledge. If you are working in the finance domain, then basic business knowledge on rules like minimum age criteria for credit cards, loan quantum for a mortgage as defined by the regulatory authorities, compliance, and regulations, knowledge of accounting standards and risk management, etc are industry-specific knowledge. Industry-specific business knowledge can be easily picked up through business periodicals or books that report the latest trends and analysis.