Last updated on 28th Jun 2020| 1858
Logistic regression is the appropriate regression analysis to conduct when the dependent variable is dichotomous (binary). Like all regression analyses, the logistic regression is a predictive analysis. Logistic regression is used to describe data and to explain the relationship between one dependent binary variable and one or more nominal, ordinal, interval or ratio-level independent variables.
Sometimes logistic regressions are difficult to interpret; the Intellect us Statistics tool easily allows you to conduct the analysis, then in plain English interprets the output.
Types of Logistic Regression:
1. Binary Logistic Regression: The categorical response has only two 2 possible outcomes. E.g.: Spam or Not
2. Multinomial Logistic Regression: Three or more categories without ordering. E.g.: Predicting which food is preferred more (Veg, Non-Veg, Vegan)
3. Ordinal Logistic Regression: Three or more categories with ordering. E.g.: Movie rating from 1 to 5
Logistic regression predicts the probability of an outcome that can only have two values (i.e. a dichotomy). The prediction is based on the use of one or several predictors (numerical and categorical). A linear regression is not appropriate for predicting the value of a binary variable for two reasons:
- A linear regression will predict values outside the acceptable range (e.g. predicting probabilities outside the range 0 to 1)
- Since the dichotomous experiments can only have one of two possible values for each experiment, the residuals will not be normally distributed about the predicted line.
On the other hand, a logistic regression produces a logistic curve, which is limited to values between 0 and 1. Logistic regression is similar to a linear regression, but the curve is constructed using the natural logarithm of the “odds” of the target variable, rather than the probability. Moreover, the predictors do not have to be normally distributed or have equal variance in each group.
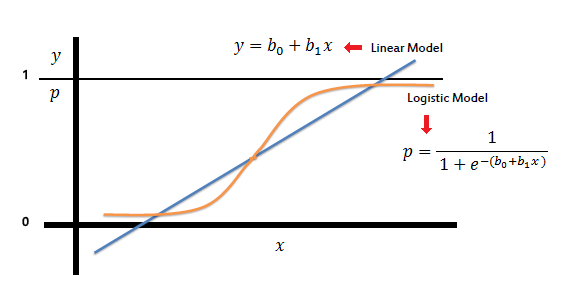
In the logistic regression the constant (b0) moves the curve left and right and the slope (b1) defines the steepness of the curve. By simple transformation, the logistic regression equation can be written in terms of an odds ratio.
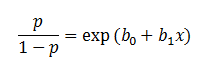
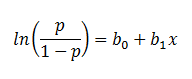
Finally, taking the natural log of both sides, we can write the equation in terms of log-odds (logit) which is a linear function of the predictors. The coefficient (b1) is the amount the logit (log-odds) changes with a one unit change in x.
As mentioned before, logistic regression can handle any number of numerical and/or categorical variables.

Enroll in JOB Oriented Machine Learning Training By Expert Trainers
- Instructor-led Sessions
- Real-life Case Studies
- Assignments
There are several analogies between linear regression and logistic regression. Just as ordinary least square regression is the method used to estimate coefficients for the best fit line in linear regression, logistic regression uses maximum likelihood estimation (MLE) to obtain the model coefficients that relate predictors to the target. After this initial function is estimated, the process is repeated until LL (Log Likelihood) does not change significantly.
Benefits of using regression analysis:
- It indicates the significant relationships between dependent variable and independent variable.
- It indicates the strength of impact of multiple independent variables on a dependent variable.
Logistic Regression — Detailed Overview
Logistic Regression was used in the biological sciences in early twentieth century. It was then used in many social science applications. Logistic Regression is used when the dependent variable(target) is categorical.
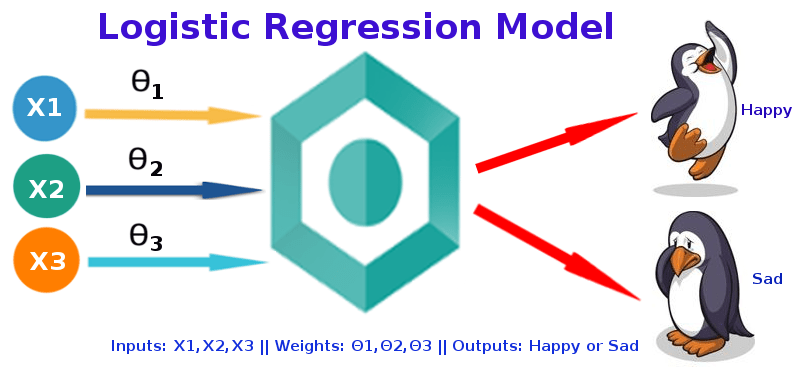
- Representation Used for Logistic Regression
- Logistic regression uses an equation as the representation, very much like linear regression.
- Input values (x) are combined linearly using weights or coefficient values (referred to as the Greek capital letter Beta) to predict an output value (y). A key difference from linear regression is that the output value being modeled is a binary values (0 or 1) rather than a numeric value.
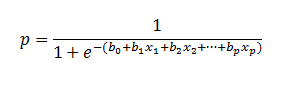
Below is an example logistic regression equation:
y = e^(b0 + b1*x) / (1 + e^(b0 + b1*x))
Where y is the predicted output, b0 is the bias or intercept term and b1 is the coefficient for the single input value (x). Each column in your input data has an associated b coefficient (a constant real value) that must be learned from your training data.
The actual representation of the model that you would store in memory or in a file are the coefficients in the equation (the beta value or b’s).
Learning the Logistic Regression Model
- The coefficients (Beta values b) of the logistic regression algorithm must be estimated from your training data. This is done using maximum-likelihood estimation.
- Maximum-likelihood estimation is a common learning algorithm used by a variety of machine learning algorithms, although it does make assumptions about the distribution of your data (more on this when we talk about preparing your data).
- The best coefficients would result in a model that would predict a value very close to 1 (e.g. male) for the default class and a value very close to 0 (e.g. female) for the other class. The intuition for maximum-likelihood for logistic regression is that a search procedure seeks values for the coefficients (Beta values) that minimize the error in the probabilities predicted by the model to those in the data (e.g. probability of 1 if the data is the primary class).
- We are not going to go into the math of maximum likelihood. It is enough to say that a minimization algorithm is used to optimize the best values for the coefficients for your training data. This is often implemented in practice using efficient numerical optimization algorithm (like the Quasi-newton method).
- When you are learning logistic, you can implement it yourself from scratch using the much simpler gradient descent algorithm.
Prepare Data for Logistic Regression
The assumptions made by logistic regression about the distribution and relationships in your data are much the same as the assumptions made in linear regression.Much study has gone into defining these assumptions and precise probabilistic and statistical language is used. My advice is to use these as guidelines or rules of thumb and experiment with different data preparation schemes.Ultimately in predictive modeling machine learning projects you are laser focused on making accurate predictions rather than interpreting the results. As such, you can break some assumptions as long as the model is robust and performs well.
- Binary Output Variable: This might be obvious as we have already mentioned it, but logistic regression is intended for binary (two-class) classification problems. It will predict the probability of an instance belonging to the default class, which can be snapped into a 0 or 1 classification.
- Remove Noise: Logistic regression assumes no error in the output variable (y), consider removing outliers and possibly misclassified instances from your training data.
- Gaussian Distribution: Logistic regression is a linear algorithm (with a non-linear transform on output). It does assume a linear relationship between the input variables with the output. Data transforms of your input variables that better expose this linear relationship can result in a more accurate model. For example, you can use log, root, Box-Cox and other uni-variate transforms to better expose this relationship.
- Remove Correlated Inputs: Like linear regression, the model can overfit if you have multiple highly-correlated inputs. Consider calculating the pairwise correlations between all inputs and removing highly correlated inputs.
- Fail to Converge: It is possible for the expected likelihood estimation process that learns the coefficients to fail to converge. This can happen if there are many highly correlated inputs in your data or the data is very sparse (e.g. lots of zeros in your input data).

Best Machine Learning Course with Industry Oriented Concepts
Weekday / Weekend BatchesSee Batch DetailsAdvantages of logistic regression
- Logistic regression is much easier to implement than other methods, especially in the context of machine learning: A machine learning model can be described as a mathematical depiction of a real-world process. The process of setting up a machine learning model requires training and testing the model. Training is the process of finding patterns in the input data, so that the model can map a particular input (say, an image) to some kind of output, like a label. Logistic regression is easier to train and implement as compared to other methods.
- Logistic regression works well for cases where the dataset is linearly separable: A dataset is said to be linearly separable if it is possible to draw a straight line that can separate the two classes of data from each other. Logistic regression is used when your Y variable can take only two values, and if the data is linearly separable, it is more efficient to classify it into two separate classes.
- Logistic regression provides useful insights: Logistic regression not only gives a measure of how relevant an independent variable is (i.e. the (coefficient size), but also tells us about the direction of the relationship (positive or negative). Two variables are said to have a positive association when an increase in the value of one variable also increases the value of the other variable. For example, the more hours you spend training, the better you become at a particular sport. However: It is important to be aware that correlation does not necessarily indicate causation! In other words, logistic regression may show you that there is a positive correlation between outdoor temperature and sales, but this doesn’t necessarily mean that sales are rising because of the temperature. If you want to learn more about the difference between correlation and causation, take a look at this post
Disadvantages of logistic regression
- Logistic regression fails to predict a continuous outcome. Let’s consider an example to better understand this limitation. In medical applications, logistic regression cannot be used to predict how high a pneumonia patient’s temperature will rise. This is because the scale of measurement is continuous (logistic regression only works when the dependent or outcome variable is dichotomous).
- Logistic regression assumes linearity between the predicted (dependent) variable and the predictor (independent) variables. Why is this a limitation? In the real world, it is highly unlikely that the observations are linearly separable. Let’s imagine you want to classify the iris plant into one of two families: sentosa or versicolor. In order to distinguish between the two categories, you’re going by petal size and sepal size. You want to create an algorithm to classify the iris plant, but there’s actually no clear distinction—a petal size of 2 cm could qualify the plant for both the sentosa and versicolor categories. So, while linearly separable data is the assumption for logistic regression, in reality, it’s not always truly possible.
- Logistic regression may not be accurate if the sample size is too small. If the sample size is on the small side, the model produced by logistic regression is based on a smaller number of actual observations. This can result in overfitting. In statistics, overfitting is a modeling error which occurs when the model is too closely fit to a limited set of data because of a lack of training data. Or, in other words, there is not enough input data available for the model to find patterns in it. In this case, the model is not able to accurately predict the outcomes of a new or future dataset.