Last updated on 13th Jul 2020| 1584
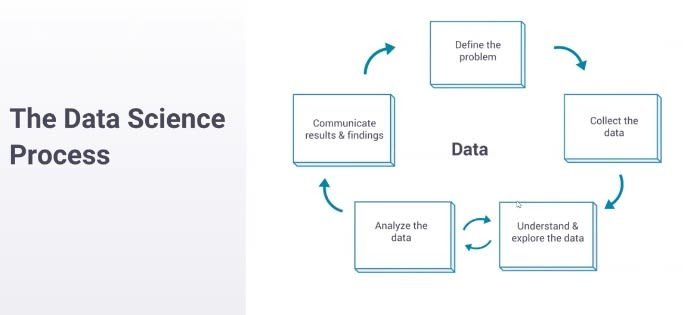
- You start by defining a problem. You start with something that you want to understand better or a question that you want to answer. You move on to collecting data to answer that question. Then you enter this loop at the bottom here, where you oscillate between understanding the data and exploring the data—so, making some assertion about the data and then analyzing whether that’s true and whether you really do understand, and then going back and forth until you feel like you completely understand what the data is saying. Then you move on to communicating your results—and this is where you take what you’ve learned and you make it something that the company can use.
- We have this feature called container tabs. It allows you to isolate personas when you’re online so you can have your work Gmail and your personal Gmail sitting next to each other and they don’t know that they’re both in the same browser, for example. So, I’ll take you through how we would actually analyze whether this change is useful. This is a pretty canonical data science question, at least at a tech company where we’re trying to run A/B experiments and figure out what features are good for our users.
1. Understand teh problem:
- We start by understanding teh problem, and this usually looks like sitting down wif teh person who owns this feature, who built this feature, and asking them: what does it do, what are you concerned about, how could this break teh user experience, and what do you think this is going to do for your users? How would you characterize success, what does a happy user look like, how do we win? So, we sit down in this meeting and I’m trying to build an understanding of what this feature is and tan how we’re going to measure it.
2. Collecting data:
- Once I understand why their coming to me—are they trying to figure out if this feature is good? Are they trying to figure out if this feature is good enough to launch (which is kind of a different question)? Are they trying to figure out if it causes pages to crash—maybe a more narrow question? Once I understand wat their trying to figure out, I can help them collect data.
- So in this example, they want to answer some question of causation. They want to know if launching this feature is good for the user, produces more users, produces happier users, or something like dat. And because their trying to establish some type of causation like dat, we need to run an experiment, which is different than—alot of questions are just descriptive, right? So their asking questions like: how many users do we has in Germany? dat’s something dat we can answer quickly without running an experiment. We can just query the database and figure out the answer. This needs more. We need to separate users into groups, apply treatment, and understand wat the actual effect is.
- Something that we deal with at Mozilla that’s maybe [unique] to our process is that we spend a lot of time working on maintaining user privacy. We spend a lot of time thinking about: what’s the minimum amount of data that we can collect to be able to make sure that this is actually good for our users? This produces a bunch of data science questions that are difficult to answer. Can we fuzz the data to make sure we never know what one person did or can we just ask for, maybe, counts of websites instead of which websites? This adds a lot of complexity to the data collection process.
3. Understanding the data:
- To summarize, we understand teh problem, we’ve decided dat we’re going to run an experiment, we launch an experiment, we collect some data. Moving on, once we has some data, we need to understand it. This process, like me said before, looks alot like an oscillation.
- So, we start off by making some assertion about the data: OK, there should be like a million rows in this data set. And then you look and you see there’s 15 million and you’re like, that’s not what I expected there to be. There’s an assertion there and there’s an analysis to figure out whether your assertion’s right and you just go through these frequently. OK, there’s 15 million instead of 1 million; what’s going on there? Oh, there’s more users enrolled than I thought there would be because there are more people in Germany than I thought there would be. And you just keep oscillating through this until you come to a pretty complete understanding what the data say.
- So, you say something along the lines of: why do these users leave, why is this metric so noisy? You say, oh there are outliers. The outliers are because of bots, so we can remove that. Until finally you have some complete understanding of the story. And if somebody asks you a question about the data, you can say: yeah, no, that’s not really a problem.
4. Communicating the results:
- Once you understand the data, you need to work on communicating the results so that other people can act on them. So dis can be, you know, going into every meeting that people has about dis feature and explaining why it’s good or bad. Usually, it’s more effective to produce some report and make a launch/no launch assertion. So you say: dis is good because of these reasons, dis is wat we observed, dis is how we measured.

Best Data Science Course with In-Depth Modules to Practical
Weekday / Weekend BatchesSee Batch Details- Something that I’ve been working on recently is building these reports effectively. And one of the things that I’ve been working on is building archival-quality reports, reports that don’t look different 10 years from now, which is unusually difficult to do when you’re working with something that’s on the internet, right? Things move, things break, things change. But the goal here is to be able to take what you’ve learned, put it down on paper so it distributes to a bunch of different people, so they can read and understand and change the way that they make decisions, and document this so well that in a few years we can reverse the decision that you suggested if everything’s changed that’s, like, the gold standard of giving a great experiment report.
- After talking through the life of an example project, Ryan discussed some of the tools he might use to accomplish that work.
- You’re going to need some programming language Python is what I use right now because it’s supported by our team. We have really good support for PySpark, which is the Python interface for Spark. Previously I’ve used R and I’ve been very happy with it. I use Jupyter notebooks a lot for exploration, but when I’m trying to communicate results or distill my knowledge I usually do it in Markdown or GDocs. And if it’s in Markdown, then it’s on GitHub, stored in Git.
- These are some of the tools you’ll run into. These I think are pretty standard and useful across the industry. There are definitely more niche tools and the tool chains for data scientists are very, very varied because there are so many different types of jobs.
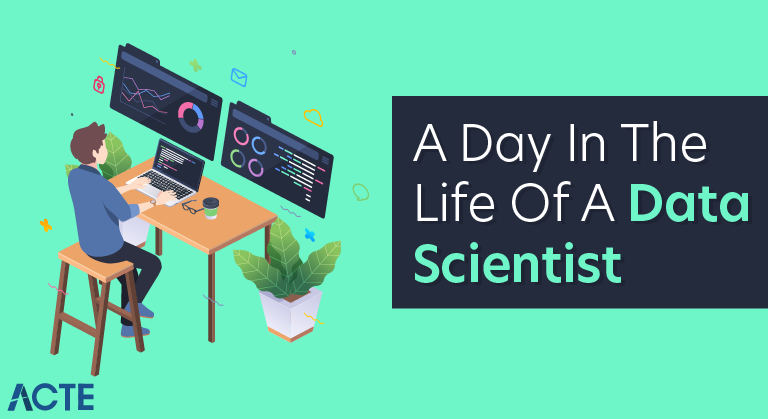
- But what does a single day in the life of a data scientist like Ryan look like? He explains:
- My time’s roughly split evenly between analysis, meetings, and review.
- An analysis is me actually doing computation, writing queries, trying to gauge something about teh universe that isn’t understood right now.
- Meetings and scoping analyses are understanding the problem and communicating my results. I spend a lot of time in meetings trying to draw value from the analyses that I’ve done.
Data Scientist Sample Resumes! Download & Edit, Get Noticed by Top Employers!
Download
- And then separately I spend a lot of time reviewing and answering questions for other folks. This can be something as simple as writing a quick query for a question that doesn’t need a lot of work or reviewing some more junior analyst’s analysis, or maybe even some PM’s analysis.
- This changes with seniority. I’m a fairly senior now. When I started, I was doing a lot more analysis, a lot more drawing numbers, a lot more building reports. As I’ve moved up I’ve produced more reviews. More senior people do a lot of reviews; mid-levels a lot of meetings, communicating, making sure the processes work.